
Journal of Environmental Studies
Download PDF

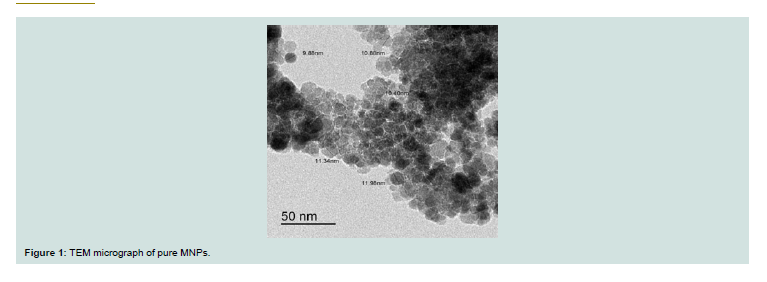 Figure 1: TEM micrograph of pure MNPs.
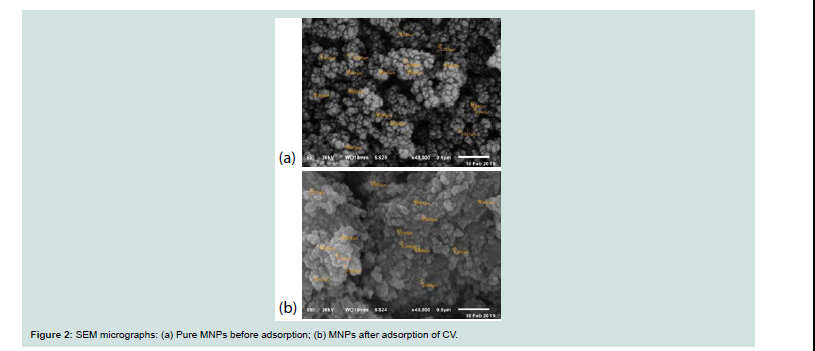 Figure 2: SEM micrographs: (a) Pure MNPs before adsorption; (b) MNPs after adsorption of CV.
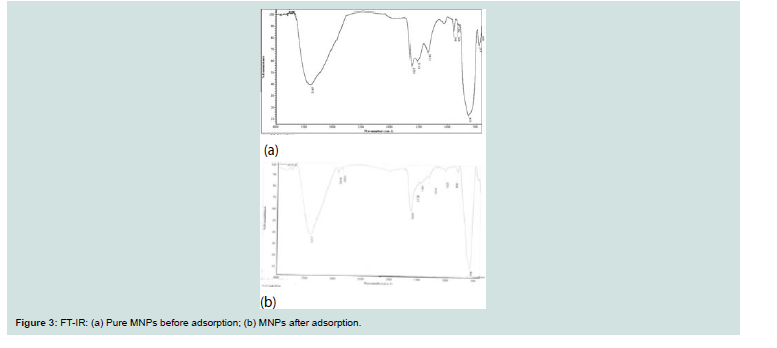 Figure 3: FT-IR: (a) Pure MNPs before adsorption; (b) MNPs after adsorption.
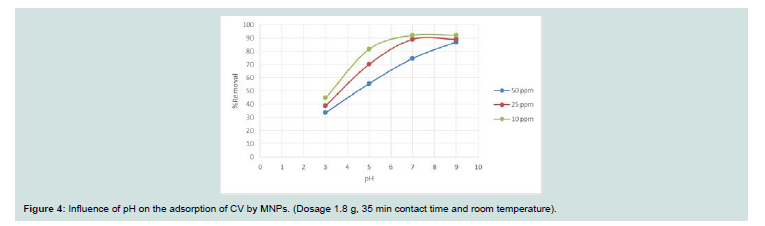 Figure 4: Influence of pH on the adsorption of CV by MNPs. (Dosage 1.8 g, 35 min contact time and room temperature).
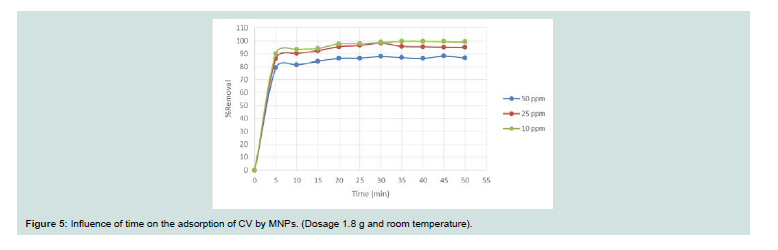 Figure 5: Influence of time on the adsorption of CV by MNPs. (Dosage 1.8 g and room temperature).
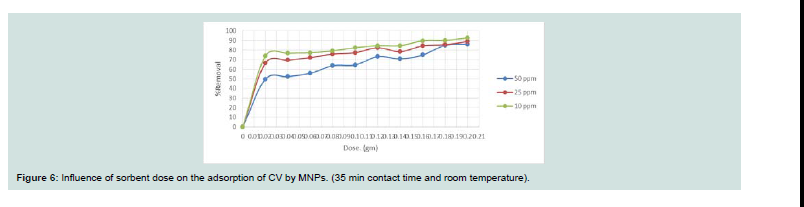 Figure 6: Influence of sorbent dose on the adsorption of CV by MNPs. (35 min contact time and room temperature).


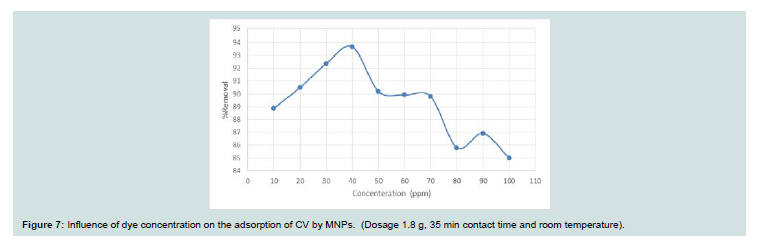 Figure 7: Influence of dye concentration on the adsorption of CV by MNPs. (Dosage 1.8 g, 35 min contact time and room temperature).
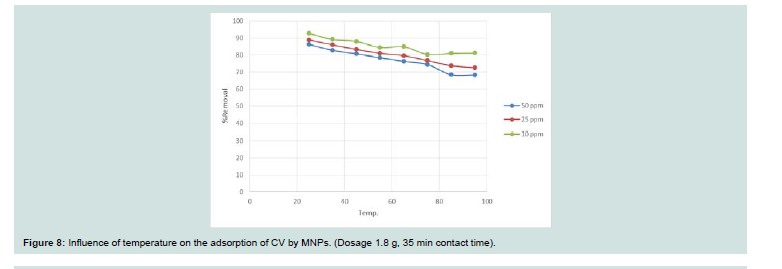 Figure 8: Influence of temperature on the adsorption of CV by MNPs. (Dosage 1.8 g, 35 min contact time).
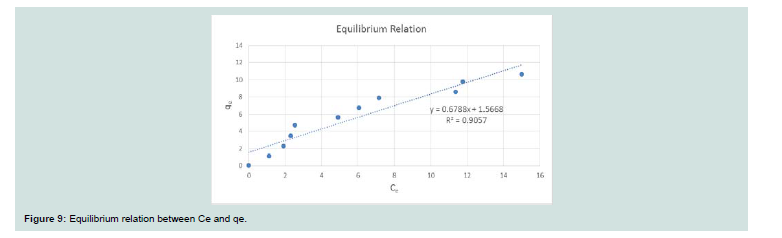 Figure 9: Equilibrium relation between Ce and qe.
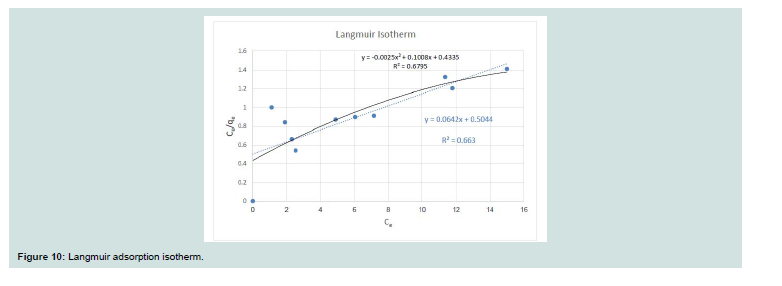 Figure 10: Langmuir adsorption isotherm.
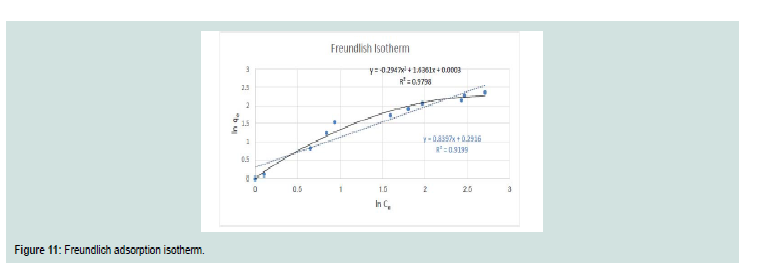 Figure 11: Freundlich adsorption isotherm.
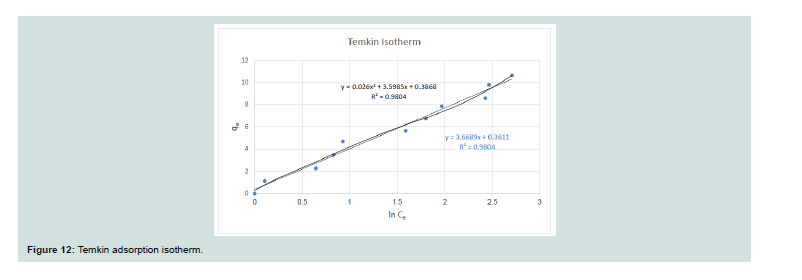 Figure 12: Temkin adsorption isotherm.
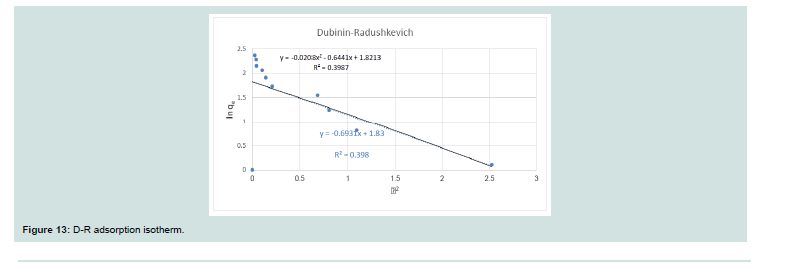 Figure 13: D-R adsorption isotherm.
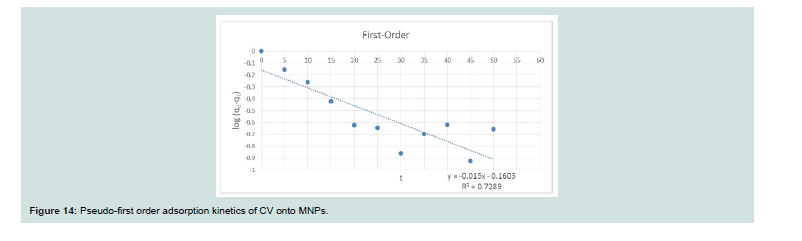 Figure 14: Pseudo-fi rst order adsorption kinetics of CV onto MNPs.
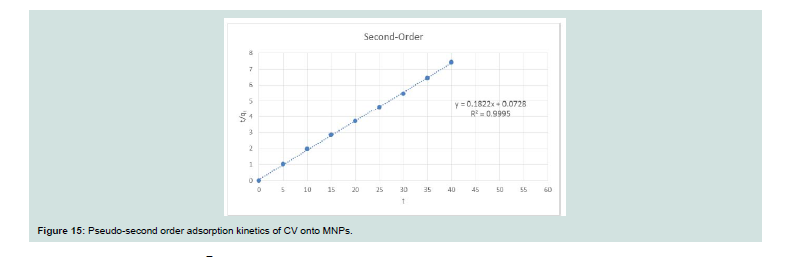 Figure 15: Pseudo-second order adsorption kinetics of CV onto MNPs.


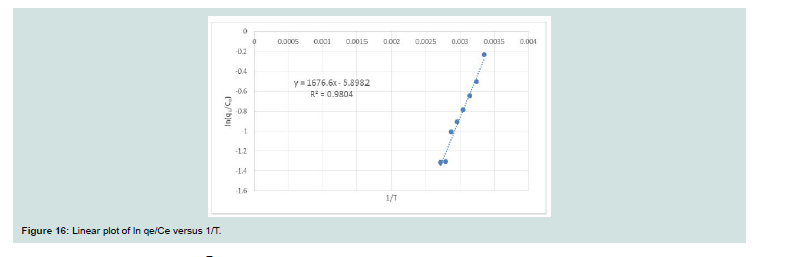 Figure 16: Linear plot of ln qe/Ce versus 1/T.


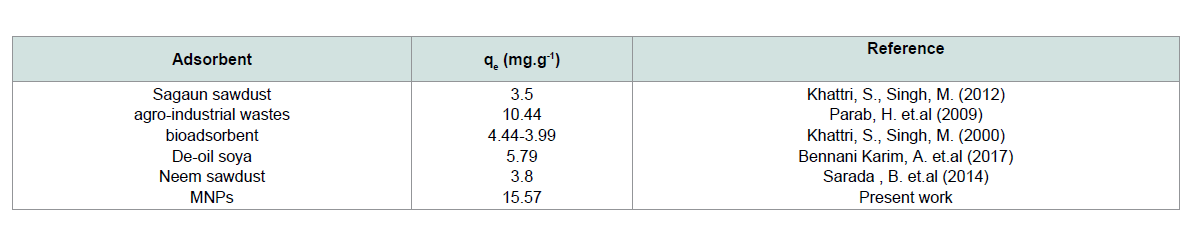 Table 1: The adsorption capacities of diff erent adsorbents for crystal violet dye.
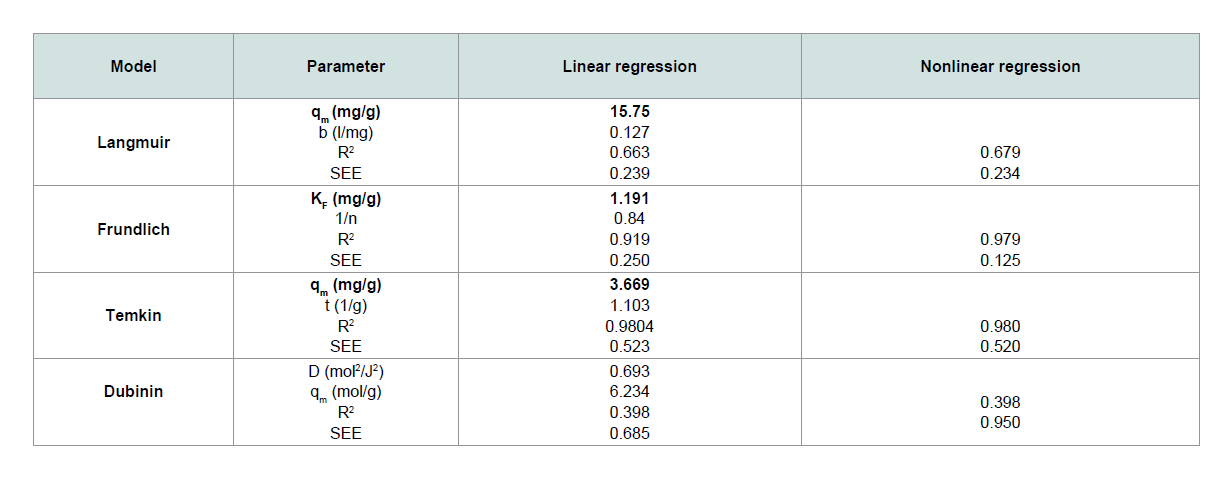 Table 2: Constants and correlation coefficients for the four isotherms.
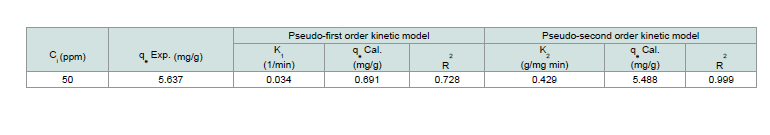 Table 3: Adsorption dynamic constants (calculated and experimental qe values obtained at 50 ppm of CV).
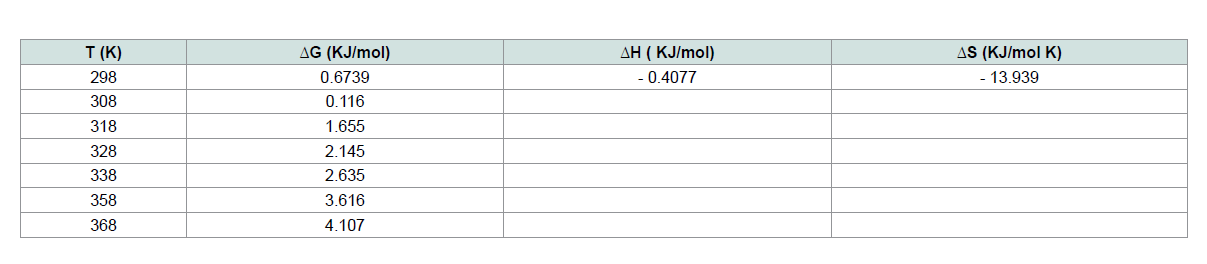 Table 4: Thermodynamic parameters for the adsorption of CV (10 ppm) on MNPs.


Research Article
Remediation of Contaminated Water With Crystal Violet Dye by Using Magnetite Nanoparticles: Synthesis, Characterization and Adsorption Mechanism Studies
Abobakr SM1, Abdo NI2* and Mansour RA1
1Higher Institute of Engineering and Technology, New Damietta, Egypt
2Higher Institute of Engineering and Technology, New Borg Al Arab, Egypt
*Address for Correspondence: Abdo NI, Higher Institute of Engineering and Technology, New Borg Al Arab, Egypt; E-mail: nabiha_ibrhim@yahoo.com
Submission: 14 September, 2020;
Accepted: 28 October, 2020;
Published: 30 October 2020
Copyright: © 2020 Abobakr SM et al. This is an open access article distributed under the Creative Commons Attribution License, which permits unrestricted use, distribution, and reproduction in any medium, provided the original work is properly cited.
Abstract
Magnetite Nanoparticles (MNPs) have become a promising material for scientific research. Among numerous technologies, MNPs seem to be one of the most convenient to environmental applications
as adsorbent. In the present study, the dye adsorption from aqueous solution, using available resources such as Crystal Violet (CV) as model colorant was used. The magnetic nanoparticles (MNPs: before and after adsorption) were characterized by FTIR, SEM and TEM techniques. These nanoparticles have a spherical shape and their diameter about 11 nm. The influence of several experimental conditions (pH, contact time, sorbent dose, concentration and temperature) as well as properties of the adsorbent materials in terms of thermodynamics, kinetics and adsorption isotherms was all investigated. Once compared with adsorption models, our results enabled us to describe this adsorption as a process being spontaneous, exothermic and
having pseudo-second order kinetics. The adsorption isotherm data were described by the Freundlich model.
Keywords
Dye removal; Magnetite nanoparticles (MNPs); TEM; FTIR; Adsorption mechanisms; Freundlich isotherm
Introduction
Dyes are known as pollutants that not only aff ect aesthetic
advantages of environment, but also reduce light penetration and
photosynthesis, and some of them are considered toxic and even
carcinogenic to human health [1]. Adsorption process provides an
attractive alternative for the treatment of colored wastewaters due to
its simplicity, selectivity, and efficiency [2-6].
Recently, Adsorbents with magnetic properties such as MNPs
have attracted interest in many environmental engineering related
applications due to a significant effect in accelerating separation
and improving the efficiency of water treatment. With reported
sizes ranging from 1 to 100 nm, high surface-to-volume ratio, and
high loading capacity, MNPs were successfully used as adsorptive
materials for pollutants [7-9]. Th erefore, these nanoparticles received
significant attention as a low-cost processing and operational easiness
adsorbents for potential applications in the environmental treatment.
CV dye is highly toxic to mammalian cells and could cause skin
and digestive tract irritation. Also, It may leads to respiratory and
kidney failure in extreme conditions. Th us it is necessary to remove
this dye from waste water before its fi nal disposal.
Th e study scope is to investigate the adsorption behavior of MNPs
as a surfactant for removal of crystal violet (CV). Based on this, the
eff ects of variables infl uencing the removal of dyes were evaluated. Th e adsorption kinetics and isotherms for CV dye onto MNPs were
studied.
Experimental
Materials:
Crystal Violet (C25H30N3Cl) as a cationic azo dye, ferric chloride
(FeCl3.6H2O), ferrous sulfate (FeSO4.7H2O), ammonium hydroxide (NH4OH), diluted hydrochloric acid (HCl) and sodium hydroxide
(NaOH) were used for this study. A stock solution of CV (1000 mg l-1) was prepared in distilled water. Th is solution was diluted with distilled water to prepare stock solutions with the concentration of
10, 25 and 50 mg l-1 of CV.
Preparation of magnetite nanoparticles (MNPs):
Stock solutions of ferrous ions (Fe+2; 1M) and ferric ions (Fe+3; 2M) were prepared by dissolving appropriate weight in 200 ml of distilled water, the stock solutions were mixed and heated at 90 °C, ammonium hydroxide solution (33%) was introduced by syringe dropwise until pH adjust around 10-12. Th e appearance of black colour was indicated the formation of magnetite particles. Th e black mixture was heated at 80 °C for 60 minutes, filtered and washed with deionized water repeatedly until pH become neutral and dried at room temperature [10].
Preparation of crystal violet dye solution
A stock solution of CV (1000 mg/l) was prepared by dissolving 1 gm in 1 liter distilled water. Th en, it diluted by distilled water to prepare different concentrations of dye according to dilution law.
Th e dye was made up in stock solution of concentration 1000 mg l-1 (1 g CV in 1000 ml of distilled water) and was subsequently diluted to the required concentrations from 10 to 100 mg l-1. Th e effect of some parameters such as pH (3-9) and adsorbent dosage (0.02-0.2 g) was made by known amount of MNPs and 25 ml of CV solution. Th e pH of dye solution was adjusted using with 0.1 M HCl or 0.1 M NaOH solutions. The sorption studies were performed at different temperatures (25 oC-95 oC). Th e mixture was shaken using water bath at 240 rpm (25 °C for 30 min). Aft er each adsorption process, the residual CV solution was separated the absorbance of the filtrate was measured at λmax 576 nm. In all these different parameters, the amount of dye taken by adsorbent is calculated as:
Where: (qe; the amount of dye taken by adsorbent (mg/g)), (Ci and Ce; the concentrations of dye at initial and equilibrium (mg/l), respectively), (V; the volume of solution (l)) and (m; the mass of adsorbent (g)). Also the removal efficiency is calculated as:
Where: (Ci and Cf: the initial and final dye concentrations (mg/l), respectively).
Characterization
FT-IR spectra of the samples were carried out using (FT/IR-4100) spectrophotometer (ThermoFisher Nicolet IS10, USA) in KBr pellets at room temperature. Micrographs of the samples were taken using SEM (JSM-6510, JEOL, Ltd.). Th e images of TEM were taken by a JEM-2100 operated at an accelerating voltage of 200 kV. UVvisible spectroscopic analysis was carried out on Oasis Scientific (PG Instruments T80).
Results and Discussion
Morphology Characterization:
Th e morphology and particle size of the prepared MNPs was investigated by TEM. As shown in Figure 1, MNPs exhibited spherical morphologies with a uniform particle size (about 11 nm).
Th e morphologies of MNPs (a: before adsorption) and MNPs-CV
(b: aft er adsorption) are investigated by SEM and shown in Figure 2.
It can be seen from this Figure 2 (2a) that MNPs shows a spherical
shape with aggregated porous surface, but MNPs-CV (2b) has a
relatively loose and fibrous surface, which indicated the penetration
of dye molecules into the MNPs powder.
Th e FT-IR spectra of Fe3O4 before and aft er adsorption were shown
in Figure 3. Th e presence of strong broad absorption band at around
447- 634 cm-1 shows the formation of magnetic nanoparticles. The
absorption band at 447 cm-1 attributed to tetrahedral and octahedral
sites and peak at 3385 cm-1 due to the O-H stretching adsorbed on the
surface of the Fe3O4 nanoparticles [11].
In the case of CV-Fe3O4 nanoparticles (curve b in Figure 3); the adsorption of CV is established by the appearance of peaks at 2918 and 2843 cm-1 considered to be the stretching vibrations of -CH3. The appearance of peaks at 1538 and 1630 cm-1 are assigned to the C-C stretching vibration of the aromatic (bending vibration).
Th e appearance of peak at 1025 cm-1 (C-N stretch) confi rms
adsorption of CV (dimethylamino). Th e observed shift of bands to
higher and /or to lower wavelength is taken as a strong evidence for
the adsorption process (Figure 3).
Adsorption Parameters:
Effect of pH: When the pH of the dye solution increased, the amount of dye adsorbed also increases (Figure 4). Th e adsorption of cationic dye is promoted due to electrostatic forces of attraction between the negatively charged adsorbent and the positively charged dyes
molecules [12,13]. It is noticeabe that high removal efficiency even at neutral pH (74.75%, 89.23% and 92.23%) for concentrations of 50, 25 and 10, respectively.
Proposed mechanism for adsorption: Based on the result obtained from the effect of pH; at high pH, an oxide surface will probably exist and this will increase the negative charge, while with deceasing pH the hydroxide form will instead of oxide form (positive polarization).
Th is confi rms that the adsorption process is promoted
as electrostatic attraction mechanization at higher pH.
Effect of time:
Th e influence of the time on the adsorption of CV on MNPs was evaluated to determine the equilibrium time and to investigative the adsorption process (Figure 5). Th e removal rate (%) increases with time and detects a rapid removal during the first few minutes of contact until the equilibrium state is reached (35 min at r.t.). The uptake ratios (%) obtained aft er equilibrium are 86.99%, 95.70% and 99.73% for CV adsorption onto MNPs for concentrations of 50 mg/l, 25 mg/l and 10 mg/l, respectively.
Effect of sorbent dose:
From Figure 6, the removal efficiency of investigated dye
increases rapidly with increasing amount of MNPs. At the same time,
further increasing the adsorbent dose leads to a slightly decrease of
the removal efficiency. Th e removal rate (%) decreases with increase
in concentration and takes prolonged period to reach equilibrium
because of the verity that with increase in dye concentration, there
will be increase in contest amongest the dye molecules and the
adsorption process will increasingly slowing down [14].
Effect of dye concentration:
Th e effect of the concentration of the dye adsorption process was
investigated (10-100 mg l-1 at 25 oC and pH 9). Th e concentration of
the dye at 𝜆max was obtained using a standard calibration curve. Th e
adsorption is very rapid in the initial stages of the adsorption until
concentration of 50 (higher than 90%) and then decreased for higher
concentrations (Figure 7). Th is can be clarified by a large number of
active centers at the starting of adsorption and saturation of these
centers on the surface of the adsorbent with attaining equilibrium.
Th e requisite time for reaching the equilibrium increases with
increasing the concentration due to the fact that adsorption involves
film diffusion and internal diffusion [15].
Effect of temperature:
Temperature is a point for the adsorption whether it is an
endothermic or exothermic process. The solubility and chemical
potential of dye is affected by increasing the temperature. Figure 8 represents the sorption of CV onto MNPs at various temperatures
(25 oC to 95 oC) with a fixed initial dye concentrations (10, 25 and
50 mg l-1). With increasing the temperature the rate of adsorption decreases that indicates the adsorption process is exothermic. The decrease in rate of adsorption with increasing temperature, this may
be due to when the temperature increased the solubility of dye will be increased.
Adsorption isotherms:
The sorption profile of CV was specified over a wide range of equilibrium concentrations (10-100 ppm) as shown in Figure 9.
Adsorption isotherms:
Langmuir isotherm: Langmuir equation used is given below:
Where: (Ce; equilibrium concentration of dye), (qe; the amount of
dye adsorbed at equilibrium), (qm; Langmuir monolayer adsorption
capacity (mg/g)), and (b; Langmuir constant (l/mg)). Th e equation is
linearized by different ways to give the next equation:
A straight-line plot of Ce/qe vs. Ce (Figure 10) indicated that uptake rate of CV dye occurred on adsorbent (MNPs) homogenous surface by monolayer adsorption without any interaction between adsorbate molecules. Th e values of b and qm for the system evaluated from the intercept and slope were 0.127 and 15.57 for CV dye. These values indicate good retention for CV onto MNPs.
The value of adsorption capacity of MNPs was compared with the adsorption capacities of various adsorbents (Table 1). According to that comparison, MNPs have a good adsorption capacity for CV
Freundlich isotherm:
It is oft en used to depict non-specific adsorption that comprises
of heterogeneous surfaces.
Th e equation is linearized by different ways to give the next
equation:
Where: (kf; Freundlich coeffi cients (m/g)) and (n; related to
adsorption intensity) were obtained from the slope and the intercep
of the linearized Freundlich plots.
The plot of ln Ce versus ln qe of CV in Figure 11 is straight line over the entire concentrations of dye in the aqueous phase. Th e values of kf and 1/n computed from the intercept and slope of the plot were equal to 1.191 and 0.84 for CV. Th e amount of 1/n < 1 indicates that the sorption strength is slightly miniature at lower equilibrium concentration and the isotherm does not predict any saturation of the solid surface of the adsorbent by the adsorbate [16,17].
Temkin isotherm:
It assumes that the heat of adsorption of all the molecules in
the layer decreases linearly with coverage due to adsorbate species
adsorbent interactions, and adsorption is described by a regular
distribution of binding energies, up to some maximum binding
energy [18].
Th e equation is linearized by different ways to give the next equation:
Where: (qe; the concentration of CV removed (mg/g)), (t; the
equilibrium binding constant (l/g)) and (qm; constant related to heat
of adsorption (J/mol).
The linear plot of qe versus ln Ce for both the adsorption system
gave good fit for the Temkin isotherm as shown in Figure 12. Th e
computed values of qm and t from the slope and intercept were equal
3.669 and 1.103 for CV dye, respectively.
Dubinin-Radushkevich isotherm (D-R):
It is used to evaluate the characteristic porosity of the adsorbent
and the apparent energy of adsorption. It is illustated by the equation:
Th e equation is linearized by different ways to give the next
equation:
Where: (qe; amount of CV adsorbed on MNPs), (qm; highest adsorption capacity mg/g), (D; constant related to the energy of adsortion (mol2 KJ2), (Ce; equilibrium concentration of CV in mg/l) and (ɛ; RT ln (1+1/Ce), which is called as Polanyi Potential).
A plot of ln qe versus ɛ2 as shown in Figure 13 yielding straight line confirms the model. Th e D-R constant can be specified from the intercept of the straight-line diagram.
Error analysis:
To estimate the fi t of the adsorption isotherm and isotherm
parameters by linear and nonlinear regression, Standard Error of the
Estimate function (SEE ) was applied. It is the most commonly used
error evaluation function and the mathematical form of the SEE can
be written as:
ẏ: Estimated value
y: Actual value
n: # of values
Th e isotherm parameters determined by linearization and the
nonlinear regression of the Langmuir, Freundlich, Temkin and
Dubinin equations, using Standard Error of the Estimate function,
together with the correlation coeffi cient (R2) and error values, are
summarized in Table 2.
Th e results obtained from the linear and the nonlinear regressions
with Standard Error of the Estimate function were compared. It was
found that the regression methods revealed that CV adsorption were
better fi tted to the Freundlich isotherm (nonlinear regression) in
terms of the R2 and error values, because of the higher R2 values and
lower error values than those of other models.
Adsorption Kinetics:
Th e dynamics of the adsorption of CV onto MNPs were inspected using the Lagergren’s pseudo-first order (Eq. 10) and pseudo-second order (Eq. 11) equations:
Where: (qe and qt; the amount of dye adsorbed at equilibrium and at any time t, respectively), (k1; the first-order adsorption rate constant (1/min)), (k2; the pseudo-second order rate constant (g/mg min)). Th e K1 and K2 have been calculated from the intercept of the corresponding of log (qe-qt) versus t as shown in Figure 14 and t/q versus t shown in Figure 15, and are tabulated in Table 3.
Th e correlation coefficient value (R2) for the pseudo-second order
rate equation was higher than the pseudo-first order rate equation, so through these results, it was assured that the adsorption system pursued the pseudo-second order rate equation.
Th ermodynamic Studies
To further understand the effect of temperature the thermodynamic parameters including the change in Gibbs free energy (ΔG, KJ /mol), enthalpy (ΔH, KJ/mol), and entropy (ΔS, KJ/mol K), were used to describing thermodynamic behavior of CV onto MNPs. Th ermodynamic equations can be expressed as follow:
Where: (ΔG; the Gibbs free energy (KJ /mol)), (ΔH; the change in enthalpy ( KJ/mol)), (ΔS; the entropy change (KJ/mol K)), (T; the absolute temperature in (K)), (K; the equilibrium constant (1/q)), (R; the universal gas constant (KJ /mol K)), (qe; the amount of adsorbed dye onto MNPs (mg/g)), and (Ce; the equilibrium concentration of CV in the solution (mg/l)).
Th e values of the thermodynamic parameters reported in Table 4 were obtained from the linear plot of ln K versus 1/T (Figure 16). Th e positive value of ΔH indicates the endothermic nature of adsorption.
Th e negative amount of ΔG indicates the spontaneous nature of the adsorption of CV onto MNPs. Th e positive amount of ΔS shows the increased disorder and randomness at the solid solution interface
during the adsorption dye on the adsorbent [19-21] . Th e magnitude of ΔG, ΔH and ΔS vales indicate that the adsorption of CV onto MNPs is nonspontaneous at high temperature and spontaneous atlow temperature. It can be said that the adsorption of CV MNPs is physical adsorption and the forces can be Van deer Waals forces or electrostatic attraction between CV and MNPs surface.
Conclusion
Th e present study highlights the potential application of iron oxide nanoparticles to remove the crystal violet dye. Th e adsorption of CV was found to increase with increase in time, decrease temperature,
decrease dye concentration and increase pH up to equilibrium amont. It was found the adsorption process of CV on MNPs was exothermic and spontaneous. A pseudo-second order equation well explained the
kinetic data and revealed the physisorption.
References
Citation
Abobakr SM, Abdo NI, Mansour RA. Remediation of Contaminated Water With Crystal Violet Dye by Using Magnetite Nanoparticles: Synthesis, Characterization and Adsorption Mechanism Studies. J Environ Stud. 2020;6(1): 10.