
Journal of Environmental Studies
Download PDF
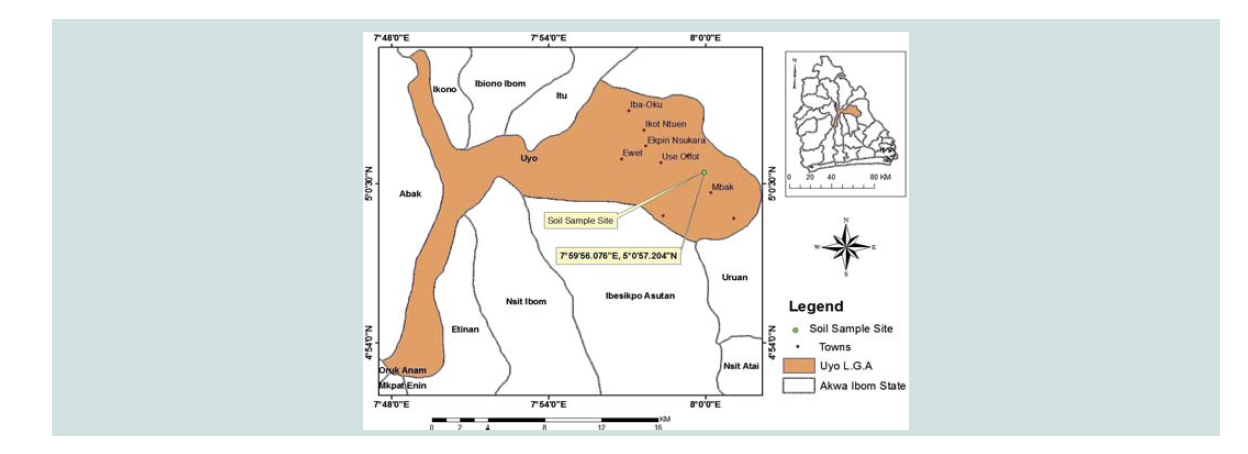 Figure 1: Map of the study location showing the BTS.
 Figure 2: (a) Galvanized steel mesocosm. (b) Collection of undisturbed soil sample.
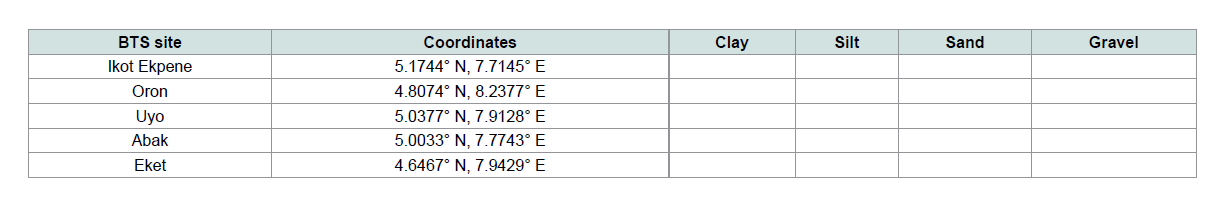 Table 1: Description of sampling sites and soil properties.
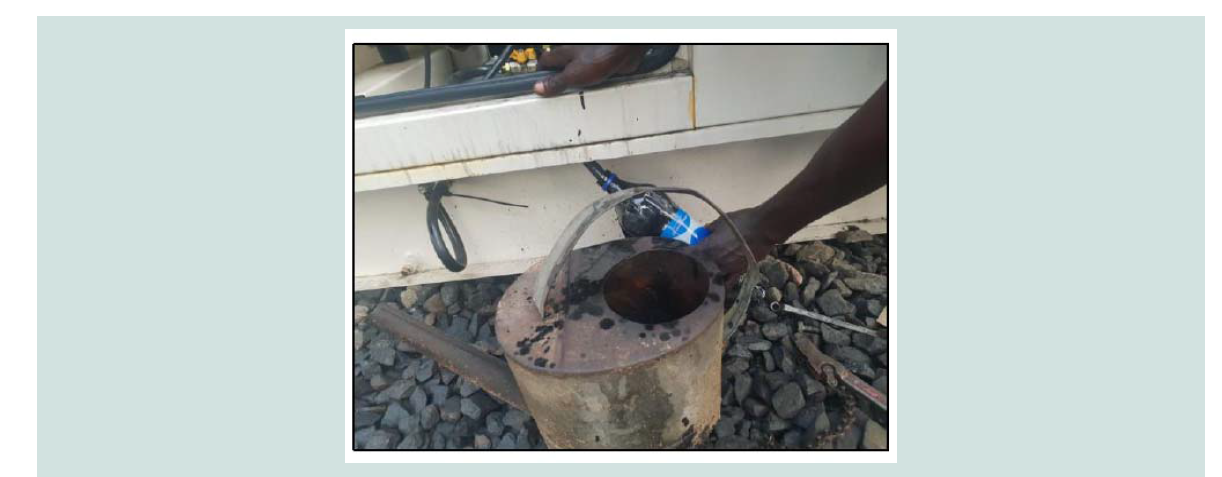 Figure 3: Collection of spent engine oil sample during maintenance of diesel generator used at BTS site.
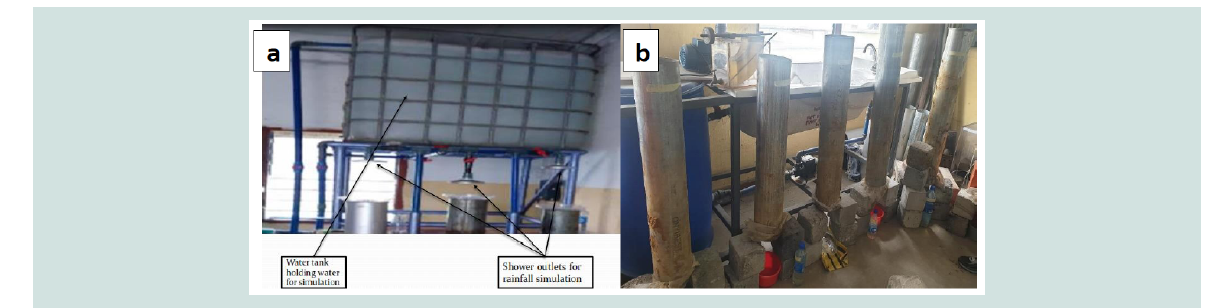 Figure 4: (a) Rainfall simulation set-up and (b) Contamination of undisturbed soil samples in galvanized steel mesocosms and collection of leachates.
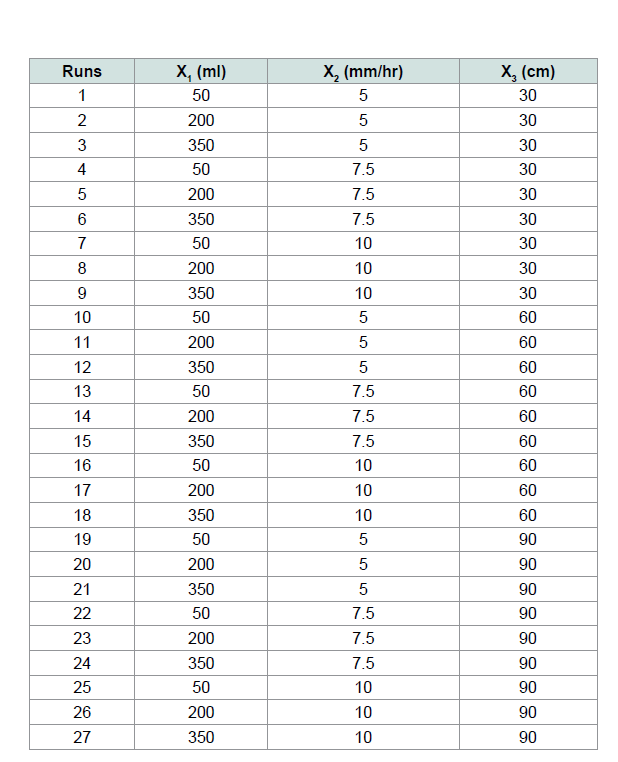 Table 2: Spent engine oil leaching and retention in soil as aff ected by
independent variables.
Table 2: Spent engine oil leaching and retention in soil as aff ected by
independent variables.
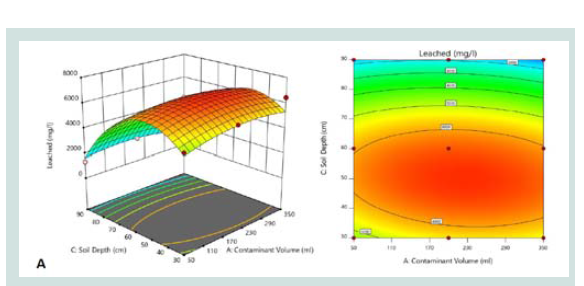 Figure 6: Eff ect of soil depth and contaminant volume on leached (A) 3D
surface plot (B) 2D contour plot.
Figure 6: Eff ect of soil depth and contaminant volume on leached (A) 3D
surface plot (B) 2D contour plot.
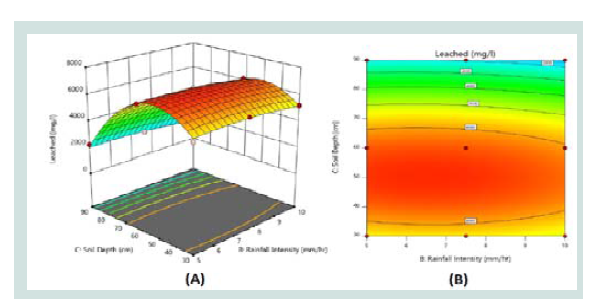 Figure 7: Eff ect of soil depth and rainfall intensity on leached (A) 3D surface
plot (B) 2D contour plot.
Figure 7: Eff ect of soil depth and rainfall intensity on leached (A) 3D surface
plot (B) 2D contour plot.
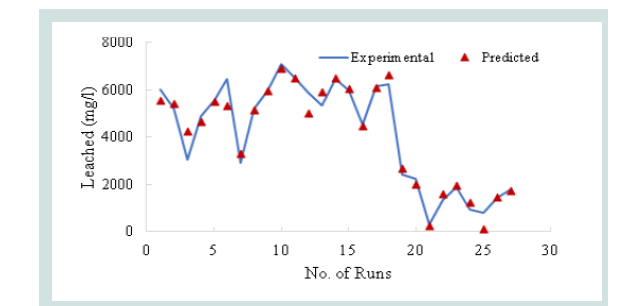 Figure 8: Validation of predicted retained used oil with experimental values.
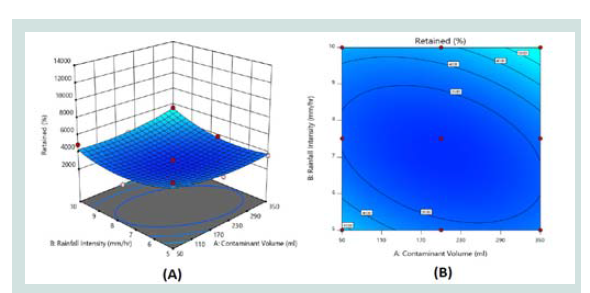 Figure 9: Eff ect of contaminant volume and rainfall intensity on retained (A)
3D surface plot (B) 2D contour plot.
Figure 9: Eff ect of contaminant volume and rainfall intensity on retained (A)
3D surface plot (B) 2D contour plot.
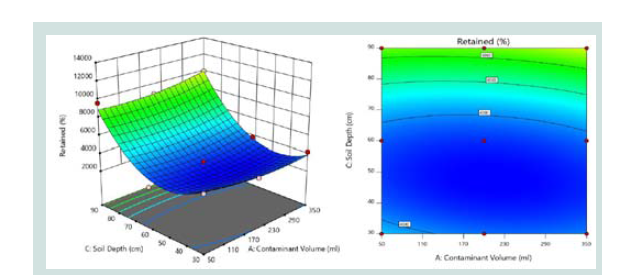 Figure 10: Eff ect of contaminant volume and soil depth on retained (A) 3D
surface plot (B) 2D contour plot.
Figure 10: Eff ect of contaminant volume and soil depth on retained (A) 3D
surface plot (B) 2D contour plot.
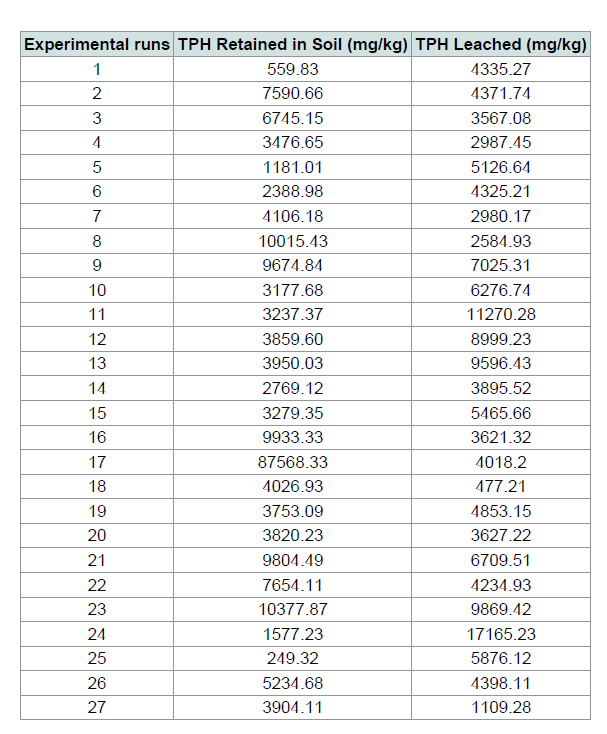 Table 3: Baseline concentration of total petroleum hydrocarbon (TPH).
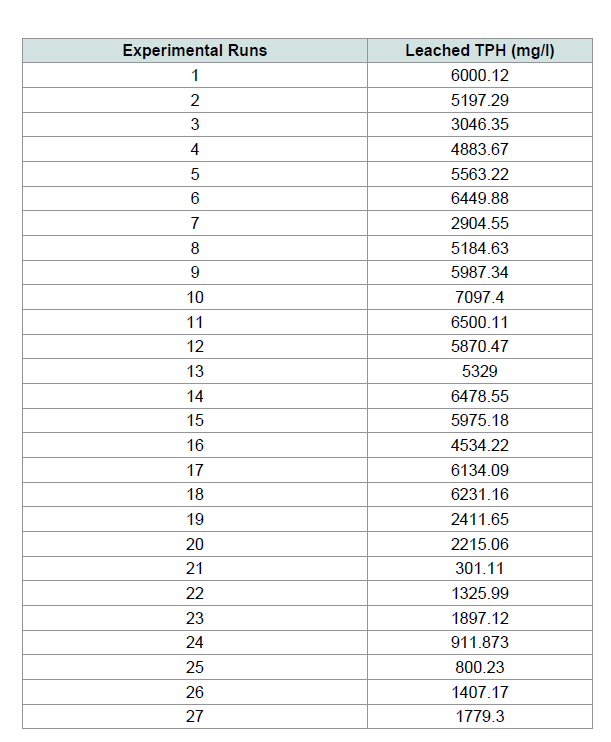 Table 4: Leached TPH concentration.


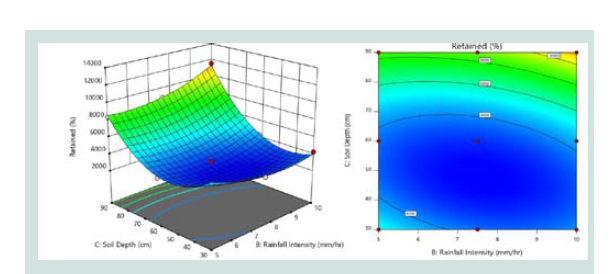 Figure 11: Eff ect of rainfall intensity and soil depth on retained (A) 3D surface
plot (B) 2D contour plot.
Figure 11: Eff ect of rainfall intensity and soil depth on retained (A) 3D surface
plot (B) 2D contour plot.
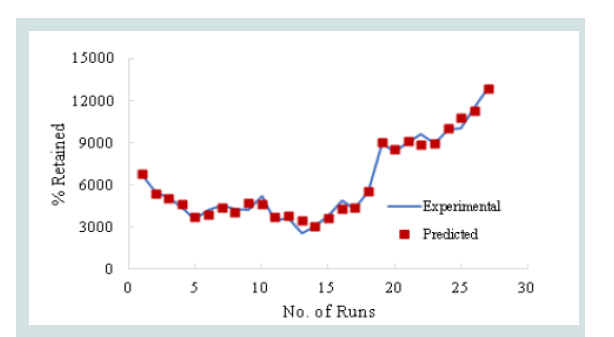 Figure 12: Validation of predicted retained used oil with experimental values.
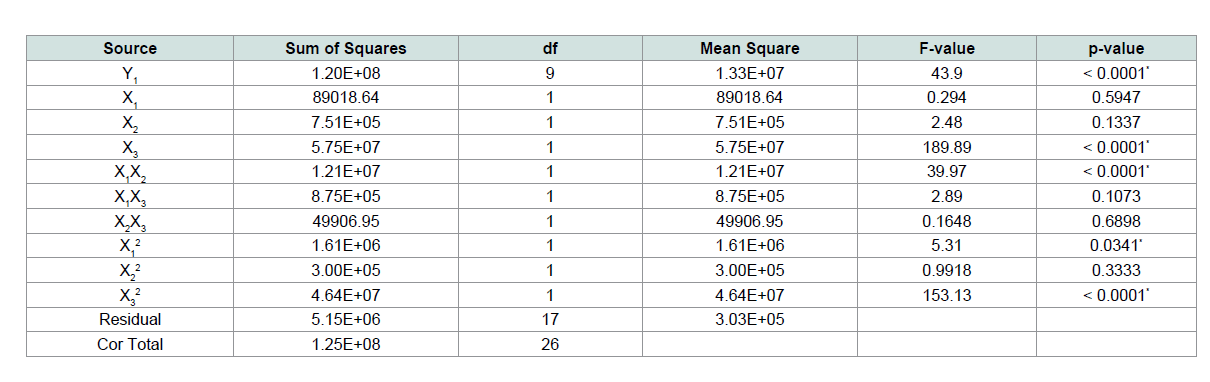 Table 5: Analysis of variance for the amount of spent engine oil leached (R2 = 0.9587).
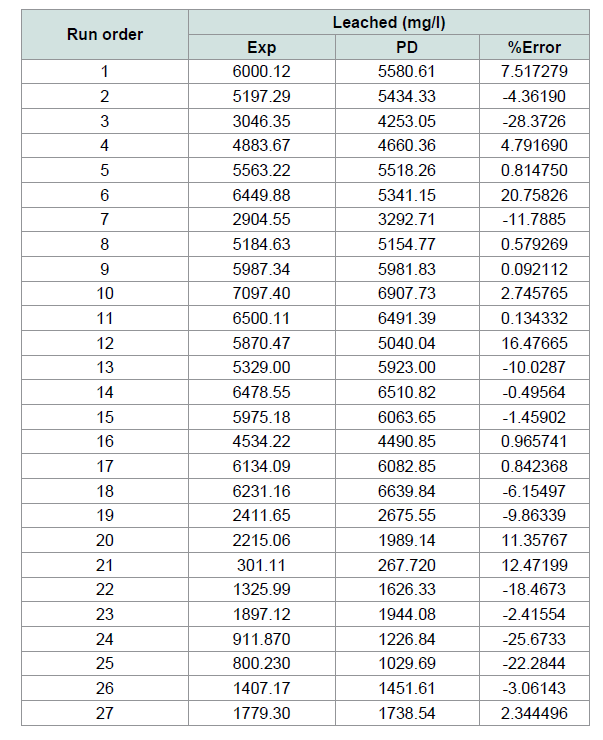 Table 6: Experiment verifi cation under the optimum condition for the amount of
used oil retained.
Table 6: Experiment verifi cation under the optimum condition for the amount of
used oil retained.
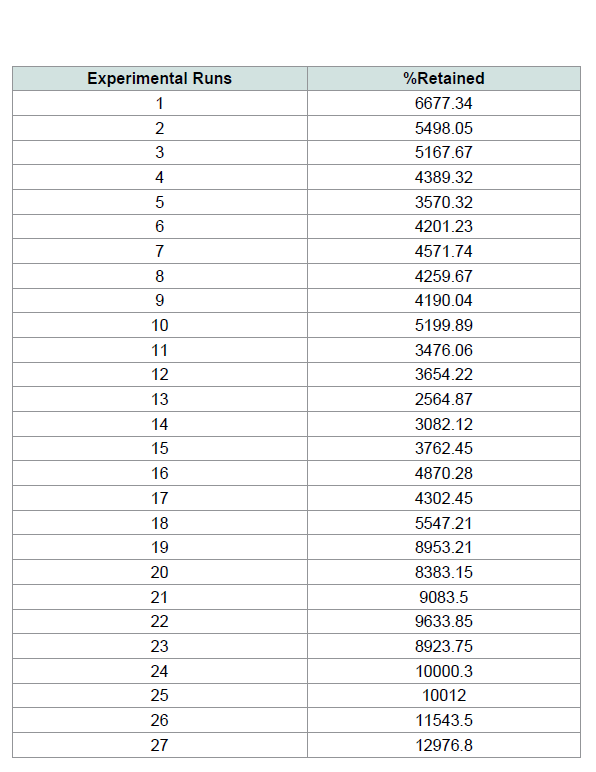 Table 7: Retained TPH concentration.
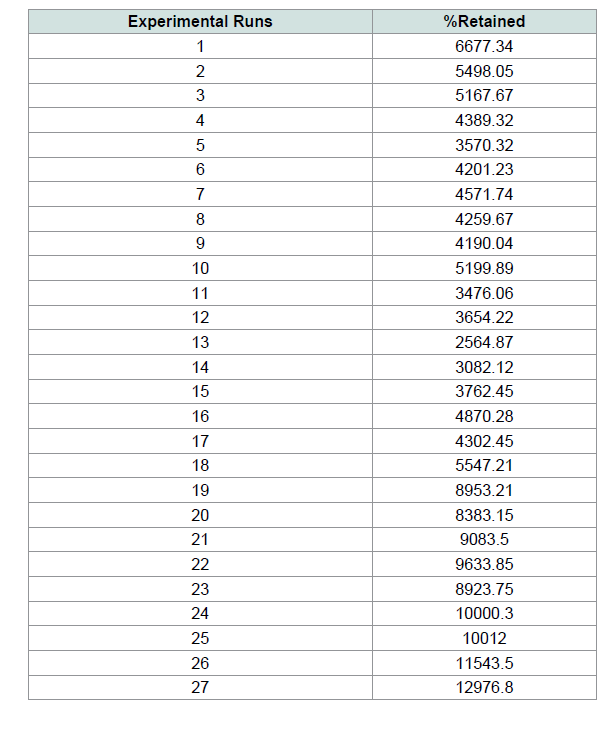 Table 8: Analysis of variance for the amount of spent engine oil retained (R2 =
0.9849).
Table 8: Analysis of variance for the amount of spent engine oil retained (R2 =
0.9849).
![]()


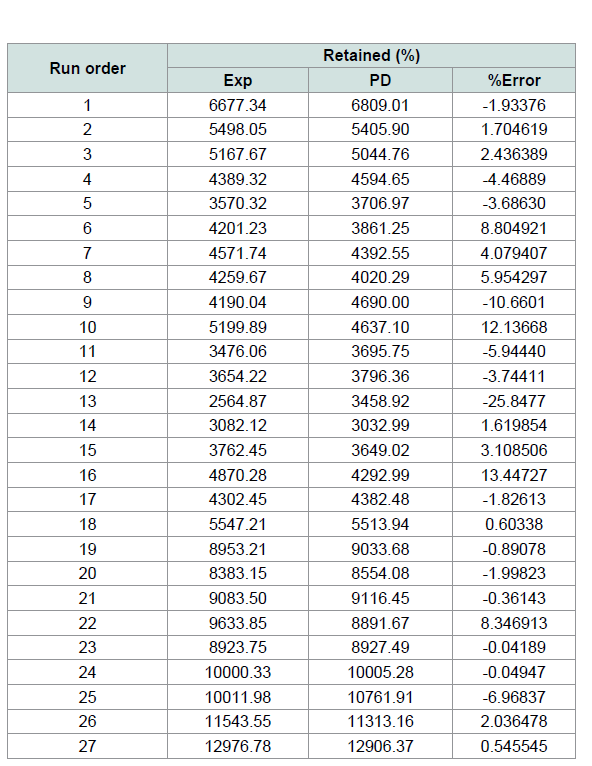 Table 9: Experiment verifi cation under the optimum condition for the amount of
used oil retained.
Table 9: Experiment verifi cation under the optimum condition for the amount of
used oil retained.
Research Article
Prediction of the Fate of Spent Engine Oil Spill from a Base Transceiver Station in the Unsaturated Zone
Theophilus N1*, Akaranta O2 and Ugwoha E3
1Centre for Occupational Health Safety and Environment, University of Port Harcourt, Nigeria
2Department of Pure and Industrial Chemistry, Faculty of Science, University of Port Harcourt, Nigeria
3Department of Civil & Environmental Engineering, Faculty of Engineering, University of Port Harcourt, Nigeria
*Address for Correspondence: Theophilus N, Centre for Occupational Health Safety and Environment, University of Port Harcourt, Nigeria, E-mail: titotheo@gmail.com
Submission: 07 May, 2020;
Accepted: 12 June, 2020;
Published: 16 June, 2020
Copyright: © 2020 Theophilus N et al. This is an open access article
distributed under the Creative Commons Attribution License, which
permits unrestricted use, distribution, and reproduction in any medium,
provided the original work is properly cited.
Abstract
In this study, Response Surface Methodology (RSM) was employed
to predict the amount of spent engine oil leached/retained in the soil
after spilling from generators in a telecommunication base station.
The experiment was performed at 27 runs based on RSM design
with three independent variables, i.e., soil depth, rainfall intensity
and contaminant volume. The ANOVA results show that at the 95%
confi dence level, the interactions of contaminant volume with soil
depth and rainfall intensity signifi cantly affect the amount of spent
engine oil leached/retained. Additionally, a second-order polynomial
equation was developed to relate the leached/retained used oil
and the independent variables. An optimization carried out showed
that the contaminant volume decreases with the amount of spent oil
leached. At 50 ml contaminant volume, the amount of oil leached
gave 2675.55 mg/l while soil depth is 90cm at a rainfall intensity of
5mm/hr, while 9033.68% of oil is retained in the soil. Minimizing the
amount of spent engine oil retained at 4550.4%, the contaminant
volume is given as 50ml, and soil depth shows 53.5cm while 7092.1mg/l
was leached. The model was validated by comparing experimental
data and predicted values, which showed a good agreement as well
as %error computation. The fi tted model shows a good agreement
between predicted and experimental data at R2 of 0.9587 and 0.9849
for used oil leached/retained. The analysis shows there is a good
relationship between the actual and predicted lached and retained
concentrations producing a line of best fi t with high correlation
coeffi cient and predictive relevance. This implies that the developed
model can adequately predict the transport of spent engine oil in the
unsaturated zone.
Keywords
RSM optimization; Spent engine oil; BTS; Leached; Retained
Introduction
Th e use of Diesel Generators (DGs) in powering
telecommunication Base Transceiver Stations (BTS) has its drawbacks
when compared to alternative energy, which includes but not limited
to diesel and oil spillage especially during maintenance cycles [1].
Th e process of utilizing these products associated with human
mismanagement leads to a spill of these products in the environment
in and around many BTS sites. Unfortunately, most of the BTS sites
are close to human habitation/infrastructure. Th ese products tend
to impact negatively on the surroundings aff ecting water, soil and
atmospheric air [2]. Th e increasing litigation by individuals and
sealing of some BTS sites by the regulator (National environmental
standards regulations and enforcement agency, NESREA) over the
indiscriminate disposition of diesel and waste engine oil by Telecom
BTS sites operators is a major cause of concern to the Telecoms
operators and infrastructure providers today. However, the use of
diesel and engine oil for maintenance and power of DGs has been
established to impact negatively on the environment once they are mismanaged. Groundwater contamination, disease conditions,
soil deterioration, and air quality alterations are possible problems
that are likely to be associated with the mismanagement of the
products at BTS sites [3]. Th ese liquids that are generated during DG
maintenance, site diesel transportation and refueling [4], have been
proven to contain harmful and toxic compounds or substances such
as Polychlorinated Biphenyls (PCBs), benzene, arsenic, Polycyclic
Aromatic Hydrocarbons (PAHs), lead, zinc, cadmium and other
substances that adversely impact soil, groundwater and environment
[5]. To protect and ensure the sustainability of the environment, there
is a need to ascertain the impact of the leaching of spent engine oil at
these BTS sites. Th is is required as spilled petroleum products have an
adverse eff ect on the environment according to [6]. Th ere are limited
existing information on spent engine oil spill at base transceiver
stations on analysis of the impact of spent engine oil at BTS sites
on soils. Studies have shown that adverse eff ects of oil spills when
one comes in contact with it could be hemotoxic and hepatotoxic,
and could cause infertility and cancer [7]. Th e negative impact of
oil spill include pollution of air and water, loss of soil fertility, and
environmental damage of host communities [8]. Response Surface
Methodology (RSM), as a statistical analysis approach, is an effi cient
and widely used methodology to analyze the simultaneous application
of diff erent factors or treatment technologies in the oil spill process
[9,10]. However, the present study is aimed at predicting the leaching
of spent engine oil in polluted soil at base transceiver station sites.
Understanding the fate of spent oil at base transceiver station sites
will provide insight into predicting contamination risks and extent
of contamination. Th is will provide telecommunications companies
broader view and understanding into the problem, will guide their
decisions on investments in better management of energy equipment
for BTS power, and other possible decisions on environmentally
friendly alternatives.
Materials and Methods
Study area:
Soil samples around base transceiver station sites in Akwa-
Ibom state were collected using a fabricated auger rig. However,
the geographical coordinates of the BTS site where the inherent soil
samples were collected are between latitude 4.9057° N and longitude
7.8537° E. Th is location was selected based on the occurrence of oil
spill from diesel generators at the BTS and accessibility to the spilled
sites (see map of the BTS in Figure1).
Collection of soil samples and grain size analysis:
A galvanized steel mesocosm was constructed to collect soil
undisturbed. Th ree sets of 300 mm, 600 mm and 900mm height
diameter galvanized steel pipes were constructed to produce the
mesocosm used in this study. Before the collection of soil samples at
the base transceiver station sites, the topsoil was cleared to a depth of
20 cm [11]. Th e galvanized steel mesocosm, hammered with the aid
of a fabricated auger rig, was used to directly collect undisturbed soil
samples, as seen in (Figure 2). Five (5) samples were obtained from the study location. Th e collected soil samples were further analyzed
in the laboratory to determine the predominant soil type at the BTS
in each site where the samples were obtained. Th e soil samples were
analyzed and predominant soil types obtained utilizing grain size
analysis using the hydrometer method. Th e laboratory analysis was
carried out at the Civil and Environmental Engineering Laboratory,
University of Port Harcourt.
Th e soil was characterized and classifi ed into clay, silt, sand, and gravel as shown in (Table 1).
For every randomly selected BTS within the study location, the
soil samples were extracted at various depths of 30, 60 and 90 cm, as is
consistent with the design of the experiment. For every 30 cm depth,
9 samples of undisturbed soil were collected. Similarly, for each of 60
cm and 90 cm depth, 9 samples of undisturbed soil were collected.
Th e collected soil samples were transported for contamination,
rainfall simulation and other relevant experiments.
https://www.avensonline.org/fulltextarticles/wp-content/uploads/2020/11/JES-2471-4879-06-0028-fig5.png:
Figure 5: Eff ect of rainfall intensity and contaminant volume on leached (A) 3D surface plot (B) 2D contour plot.
Design of experiment:
A 33 full factorial design of experiment was applied to investigate
the infl uence of the independent variables on leached and retained
amount of spent engine oil in the soil. Factor levels were chosen
by considering the operational limits of the experimental setup.
Response Surface Methodology (RSM) was employed in the design
of experiment. Th e experimental design was carried out in XLSTAT
2019 while the response surface analysis was computed using design
expert version 11 by stat-ease.
Th e independent parameters which include the contaminant
volume, rainfall intensity and soil depth were selected using a 33
experimental design in XLSTAT 2019 soft ware. Th e selected rainfall
intensity values were chosen to replicate rainfall patterns recorded in
each of the considered sites within the study location, as was obtained
from the Nigerian Meteorological Agency (NIMET).
Collection of spent engine oil:
Th e spent engine oil was collected during the frequent maintenance
of the diesel generators used to power the Base Transceiver Station
sites (BTS). Th e spent engine oil sample was collected using plastic
bottles. Th e bottles were initially rinsed with the waste engine oil
before the actual collection as shown in (Figure 3). Th e spent engine
oil was the contaminant utilized in the experiment.
Experimental set-up and procedures:
Th e experimental set-up consists of 2 major aspects (1) Rainfall
simulator set-up, and (2) Mesocosm set-up.
Rainfall simulator set-up:
Th e rain simulator was made of a rubber tank of 1000L capacity constructed to imitate the rainfall
pattern of the study location using the data obtained from NIMET.
Th e obtained rainfall data were used in calibrating the rainfall
simulator to produce 5 mm/hr, 7.5 mm/hr and 10 mm/hr rainfall
intensities, for diff erent volumes of the spent engine oil. Also, a 37.5
mm horsepower surface water pump was utilized for continuous
refi lling of the tank using 37.5 inches PVC pipe, in conjunction with
some plumbing fi ttings like union, valves, adaptors, pipes and elbows.
Th ree shower heads were also connected using 37.5 to 12.5 inches
reducers, 12.5 inches PVC pipes, union, valves, elbow, adaptors
and plug and cap. Th e showerheads were mounted on a 25 mm
diameter galvanized steel pipe welded to a 20 mm steel base plate
to ensure the stability of the shower headstands. Also, 3 transparent
5L plastic calibrated buckets were used to collect the water during
the simulation. Two measuring plastic cylinders (1000L and 2000L)
were used to measure the amount of rainfall. A stopwatch was used to measure the duration of rainfall when the valves were opened for
water infl ow. Simulated rainfall at various intensities (5 mm/hr, 7.5
mm/hr, 10 mm/hr) and volume of contaminants (50 ml, 200 ml,
350 ml) were introduced to the undisturbed soil in the mesocosm.
Th erefore, the intensity of the simulated rainfall was obtained as the
height of rainfall collected within a 150 mm diameter pipe per hour
of rainfall (Figure 4a).
Mesocosm set-up:
Some galvanized steel mesocosms were
constructed to collect soil samples in an undisturbed condition.
Th ree sets of galvanized steel pipes of 300mm, 600mm and 900mm
diameters were constructed for use as mesocosm. Th e waste engine oil
was collected using plastic bottles during the frequent maintenance of
the diesel generators used to power the Base Transceiver Station sites
(BTS) and added separately in the diff erent containers as stated in the
experimental design and thoroughly mixed and left undisturbed for
48 hours to allow the volatilization of toxic compounds of the oil [12].
Following the rainfall simulation explained in the previous subsection.
Clips were employed to hold the mesocosms in place on a table while
being contaminated and rainfall patterns simulated. Th e 600 mm
diameter holes were constructed to install the 600 mm and 900 mm
high mesocosms that have the same diameter as the constructed hole.
Th e base of the mesocosm was protected with a net to prevent erosion
and sieve the washout with the aid of a fabricated galvanized steel
clips. Leachates were collected using plastic containers placed at the
base of the elevated steel mesocosms following the 27 experimental
runs (Figure 4b).
Determination soil hydrocarbon extraction water content:
Th is test was used to determine the weight of a wet sample along with the container for 24 hours in an oven and then determine the weight of a dry soil sample. A clean dry non-corrodible container was gotten
and the weight was determined, using a balance (with minimum
sensitivity to weight the samples to an accuracy of 0.04% of the
weight of soil taken. Th is comes to a sensitivity of 0.01 g. Th e required
quantity of a representative undisturbed soil sample was taken and
placed on the container. Th e container with wet soil was placed in
the oven with its lid removed for 24 hours maintaining a temperature
of 105oC (slightly above the boiling point of water). Th e container
containing the dry soil was then cooled in a desecrator with the lid
closed. However, the oven drying temperature of 105oC is suitable for
most of the soils.
Determination of Total Petroleum Hydrocarbon (TPH):
Th e TPH test was used to determine the rate of penetration of
the contaminants into the soil at BTS sites and also, the rate of
pollution of petroleum products in the at BTS sites in the study area.
Gas chromatography was used to determine the total petroleum hydrocarbon content that are in their straight chain, and also the polyaromatic
hydrocarbon content which are heavier class of hydrocarbon
starting from Benzene which have a double like chemical structure.
Results and Discussion
Experimental result:
Th e experimental result for the response parameters as well as the
independent variables as shown in (Table 2), follows the 27 runs from
the experimental design.
Baseline concentrations of total petroleum hydrocarbons (TPH):
Th e baseline concentration of TPH aft er 27 experimental runs at
a retention time of 20mins is shown in (Table 3).
Leached TPH concentrations:
(Table 4).
Relationship between leached TPH concentrations and independent variables:
Th e relationship between the TPH leached and the independent
variables has been described using second order polynomial or a
quadratic equation which predicts the leached concentration at
diff erent soil depth, rainfall intensity and the volume of contaminant
present in the soil. Th e following graphs from Figure 5-7 shows
the interaction between independent variables on the leached
TPH concentration. Th e eff ects of the factors on the response were
measured using a 3D surface plot and contour plots which indicates
the interaction between the variables. It shows the factors (soil depth
and rainfall intensity, contaminant volume) signifi cantly aff ects the response variables, leached TPH concentration.
As contaminant decreases there is a corresponding decrease in
leached while rainfall intensity increases (Figure 4).
Th e factor interactions in Figure 5, as the leached increases,
contaminant volume decreases while the rainfall intensity increases.
Again, it was shown in Figure 6 that leached decreases as soil depth
increases, the contaminant volume also decreases gradually as seen
on the 3D plot.
Figure 6. It shows that as the soil depth increases the amount
of used oil leached decreases signifi cantly with a slight decrease in
rainfall intensity as shown in the 3D plot of Figure 7A. Although, the
ANOVA result showed that soil depth is the most signifi cant variable
aff ecting the leached. Th erefore, the 3D plot confi rms that soil depth
aff ected the leached signifi cantly.
Th e model F-value of 43.90 implies the model is signifi cant. Th ere
is only a 0.01% chance that an F-value this large could occur due to
noise. P-values < 0.05 indicate model terms are signifi cant. In this case
X3, X1 X2, X12, X32 are signifi cant model terms. Values greater than
0.1000 indicate the model terms are not signifi cant (Table 5). Here,
it appears that soil depth is the most signifi cant variable aff ecting
the leached as indicated by the p-value in (Table 3). However, the coeffi cient of correlation between model and experiment shows a
strong positive relationship (R2=0.9587), this is an agreement with
the works of [13,14].
Leached TPH model validation:
Th e model was validated by comparing experimental and
predicted Vvalues, the error between model and experiment was
determined (Table 5). Th e percentage error was calculated using the
following formula:
From the Table 6 above it shows that the error between predicted
and experimental values for retained and leached amount of used oil
in the soil is minimal which ranges from -28.4% to 20.8% for leached
and -25.8% to 13.4% respectively as shown in the table above.
Th e graphs in Figure 7 show that the model is valid when
compared with the experimental data for leached parameters.
Retained TPH concentrations:
(Table 7).
Relationship between retained TPH concentrations and independent variables:
Th e following graphs from Figure 9-11 shows the relationship
between independent variables on the leached TPH concentration.
Th e eff ects of the factors on the response were measured using a 3D
surface plot and contour plots which indicates the interaction between
the variables. It shows the factors (soil depth and rainfall intensity, contaminant volume) signifi cantly aff ects the response variables, the
TPH concentration retained in the soil.
Th e 3D surface and contour plots in indicate that the eff ect of
Contaminant volume Figures 9, Rainfall intensity and Soil depth on
retained (%) and leached (mg/l). It was observed study that a lower
rate of %retained was attained with lower rainfall intensity.
In the 3D surface and contour plots in Figures 10 indicates that
the eff ect of Contaminant volume, and Soil depth on retained (%). It
was observed that a higher rate of %retained was attained with higher
soil depth. It shows that as rainfall intensity increases, the retained
also increases at lower soil depth. However, the interaction between soil depth and rainfall intensity on retained shows that, retained
increases as rainfall intensity while soil depth reduces (Figure 11).
Retained TPH model:
Th e model F-value of 123.42 implies the model is signifi cant.
Th ere is only a 0.01% chance that an F-value this large could occur
due to noise. P-values < 0.05 indicate model terms are signifi cant. In
this case X2, X3, X1X2, X1 X3, X2 X3, X12, X22, X32 are signifi cant model
terms. Values greater than 0.1000 indicate the model terms are not
signifi cant (Table 8). However, the p-values suggest that rainfall
intensity and soil depth are the most signifi cant variables aff ecting the
retained. Th e coeffi cient of correlation shows a strong and positive
relationship between the experiment and the model (R2=0.9849).
Th e equation in terms of actual factors can be used to make predictions about the response for given levels of each factor.
However, these results conform with that of who used RSM to
optimize Bambara nut kernel yield with 3 factors (independent
variables) [14].
Th is work is in agreement with the report of, applied response
surface methodology to oil spill remediation.
Retained TPH model validation:
Th e model was validated by comparing experimental and
predicted values, the error between model and experiment was
determined (Table 9). Th e percentage error was calculated using the
following formula [15].
Th e graphs in Figure 12 show that the model is valid when
compared with the experimental data for retained parameters.
Conclusion
In this study, three sets of galvanized steel pipes of 300mm,
600mm and 900mm diameters were constructed for use as mesocosm.
Th e waste engine oil was collected using plastic bottles during the
frequent maintenance of the diesel generators used to power the Base
Transceiver Station sites (BTS) and added separately in the diff erent
containers as stated in the experimental design and left undisturbed
for 48 hours to allow the volatilization of toxic compounds of the oil [12]. A replica lysimeter was constructed to hold the 300mm,
600mm and 900mm high mesocosms that have the same diameter
as the constructed hole. Th e base of the mesocosm was protected
with a net to prevent erosion and sieve the washout with the aid of
a fabricated galvanized steel clips. Leachates were collected using
plastic containers placed at the base of the elevated steel mesocosms
following the 27 experimental runs (Figure 4b). Th e experiment
followed a 33 full factorial design. RSM was employed to study the
infl uence of the contaminant volume, rainfall intensity and soil depth
on the amount of oil leached/retained, which showed there is a strong
and positive correlation between predicted and experimental values,
0.9587 and 0.9849 for leached and retained respectively. However,
the interaction between the diff erent independent variables and
their respective eff ects on the response was studied by analyzing
the response surface contour plots [16]. According to [17], RSM
procedure has some benefi ts like higher percentage yield, reduced
process variability, closer confi rmation for output response in target
achievement. Consequently, it was observed that several factors
such as soil depth, rainfall intensity and contaminant volume can
signifi cantly aff ect the amount of spent engine oil leached/retained in
the unsaturated zone.
Th e analysis shows there is a good relationship between the actual
and predicted lached and retained concentrations with the predicted
value clustered around the experimenttal line as depicted in Figure
8 and 12 producing a line of best fi t with high correlation coeffi cient
and predictive relevance of 0.9587 and 0.9849 respectively. This therefore implies that the developed model can adequately predict the
transport of spent engine oil in the unsaturated zone.
References
Citation
Theophilus N, Akaranta O, Ugwoha E. Prediction of the Fate of Spent Engine Oil Spill from a Base Transceiver Station in the Unsaturated Zone. J Environ Stud. 2020;6(1): 9.