
Research Article
Assessment of Particulate Matter Concentrations in a University Campus in Nigeria
Osimobi OJ and Nwankwo CA*
- Department of Civil and Environmental Engineering, University of Port Harcourt, Nigeria
*Address for Correspondence: Nwankwo CA, Department of Civil and Environmental Engineering, Faculty of Engineering, University of Port Harcourt, Nigeria, E-mail: chindo.nwankwo@uniport.edu.ng
Citation: Osimobi OJ, Nwankwo CA. Assessment of Particulate Matter Concentrations in a University Campus in Nigeria. J Environ Stud. 2018;4(1): 4.
Copyright © 2018 Osimobi OJ. et al. This is an open access article distributed under the Creative Commons Attribution License, which permits unrestricted use, distribution, and reproduction in any medium, provided the original work is properly cited.
Journal of Environmental Studies | ISSN: 2471-4879 | Volume: 4, Issue: 1
Submission: 07 August, 2018 | Accepted: 06 September, 2018 | Published: 13 September, 2018
Abstract
A study on the assessment of particulate matter concentrations in Choba campus of the University of Port Harcourt and its implications on public health based on set limits were evaluated. The concentrations of particulate matter and meteorological data were measured for a period of four weeks at two locations within the Choba campus. Daily hourly data monitoring was conducted over a period of eight hours (7.15 am to 3.15 pm). The choice of averaging time in air quality studies could be based on 1-hr, 8-hr or 24-hr. Based on 8-hour averaging time, the following mean concentrations were obtained; total suspended particulate (TSP) varied from 25.25 μg/m3 to 154.0 μg/m3; particulate matter (PM10) varied from 27.63 μg/m3 to 142.75 μg/m3; PM2.5 varied from 13.63 μg/m3 to 67.25 μg/m3. The study revealed two sources of particulate pollution in Choba campus; one locally emanating from use of power generating sets and vehicular emissions and the second externally emanating from regional black carbon (soot). The results of trend analysis showed that daily particulate concentrations in the study area were higher through the early hours of morning from 7.00 am until about 9.00 am. The study revealed the presence of PM2.5 above the set limits, which could pose risks to human health on Choba campus. Persons with respiratory diseases are at greater risk on exposure. Prolonged exposure may aggravate cases of asthma and cardiovascular problems among the exposed public.
Keywords
Choba campus; Particulate matter; Wind speed; Wind direction; Air pollution
Introduction
Air is important for existence and so the quality of air for life has become a global concern. Airborne particles are released directly or indirectly into the atmosphere through natural or anthropogenic sources [1-3]. In many urban and semi-urban cities of the world, concentrations of air pollutants are on the increase mainly due to anthropogenic activities such as burning of fossil fuels for energy, automobiles, industry and domestic fuel combustion [4]. Studies have shown that many cities in China and India are polluted with particulate matter [5,6]. Particulate pollution is a major concern in most cities all over the world due to it negative effects on human health and climate. Studies have associated particulate pollution with increased risk of respiratory illness such as asthma and cardiopulmonary disease [7-9]. The size of particles is proportionally related to their potential for causing health problems for example particles less than 10 μm can penetrate deep into lungs even as far as the blood stream. Fine particles originating from gases emitted from automobiles, power plants can react in the air and accumulation of such gases resulted in enhanced greenhouse effect causing global warming, and change in rainfall pattern [8].
Particulate matter contributes significantly to haze and reduction of visibility in urban cities [10]. PM10 refers to particles of size 10 microns or less in diameter; while, PM2.5 refers to particles of size 2.5 microns or less in diameter, which are, described as inhalable particles. These particles are suspended in the air and consist of a mixture of inorganic and organic substances such as sulphate, carbon nitrate, acids and metals [11]. Exposure to fine particulate (PM10 and PM2.5) at concentrations exceeding air quality permissible limit can result to increased risk of lung and heart-related respiratory illness [7,8]. Rather et al. carried out air quality assessment in a university campus and they identified roadside dust, commercial activities and vehicular density as some of the sources of air pollutants on the university campus [12]. Studies on particulate pollution and particulate matterbased air quality index in Port Harcourt metropolis have been carried out [13,14], however there is paucity of literature on inclusive locations such as the university campus. In a similar development, Akinfolarin et al. studied air quality characteristics of emerging industrial areas in Port Harcourt [15]. The study reported high levels of total suspended particulate that exceeded permissible limits.
The dispersion of particulate matter within a University campus in Nigeria should be an issue of increasing concern due to its potential health risks to thousands of students and other occupants. In spite of its potential health hazards, little is known about the concentrations of particulate matter in many University campuses in Nigeria. University campuses in Nigeria have motor parks and established business centres that use either diesel or petrol run generating sets. Generating sets and automobiles are major sources of particulate matters. This study focused on measurement and statistical analysis of particulate matter in Choba campus of the University of Port Harcourt. Particulate matter was chosen because of its high potential risk to human health, particularly PM less than 2.5 micron (PM2.5). The Federal Ministry of Environment (FMEnv) is the regulatory agency in Nigeria overseeing matters relating to the environment and has set a limit of 250 μg/m3 daily average for particulates [16], while, the National Ambient Air Quality Standards sets limits of 200 μg/m3, 150 μg/m3 and 35 μg/m3 for TSP, PM10 and PM2.5 respectively [17].
Materials and Methods
The study area is the Choba campus of the University of Port Harcourt Rivers State, Nigeria. It is situated between latitudes 4.896 0N and 4.895 0N, and longitudes 6.908 0E and 6.909 0E. The University has three major campuses namely: Choba campus, Delta campus and Abuja campus. The choice of Choba campus is because of its proximity to the popular Choba Junction (a road intercession to Lagos-the commercial hub of Nigeria). Two sampling locations were identified namely the Car Park (CP) and Classroom Areas (CA). Insitu measurement of particulate matter (TSP, PM10 and PM2.5) was carried out at CP and CA within the Choba campus. A CW-HAT200 particulate instrument capable of detecting concentrations of particulate matter in micrograms per cubic meter (μg/m3) was used to measure particulate matter and a multi-purpose digital Kestrel 4500 weather tracker was used to measure meteorological parameters. CWHAT200 is light scattering device and as such is sensitive to relative humidity, however the model used has external digital temperature and humility sensors to assure accurate measurement. The particulate sensors are in the circuitry of the instrument. This ensures accuracy of measurement without any need for correction factor, as there is no interference with the particulate sensors. Measurement of particulate concentrations and meteorological parameters was conducted within one month (1st to 26th) of May 2017) and data were collected thrice (Monday, Wednesday and Friday) in a week. To accurately capture reliable data the instruments were placed at 1.5 m above ground level and data were collected within one-hour interval between 700 hours to 1500 hours, on daily basis during the period.
Results and Discussion
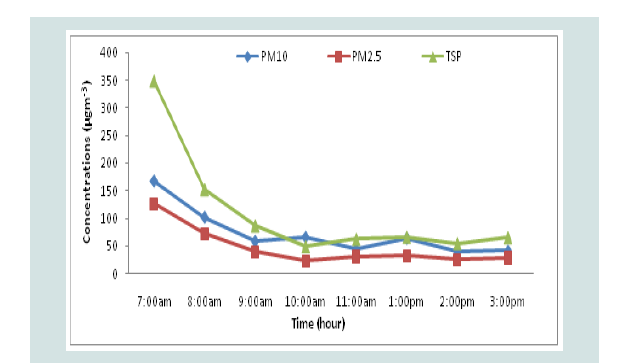
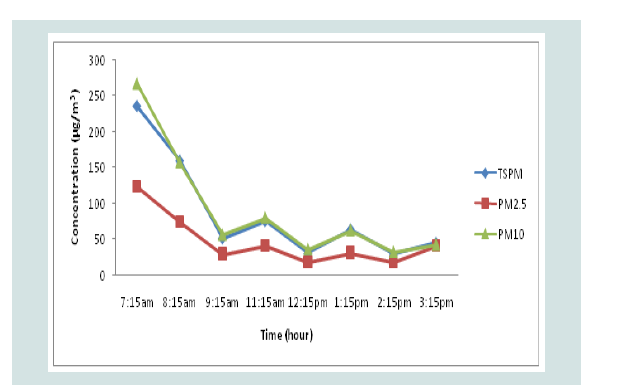
The results from this study are represented in (Figure 1-6). The hourly mean concentrations of particulate matter (PM10, PM2.5 and TSP obtained at the two monitoring stations are shown in (Figure 1 and 2).The cumulative mean concentrations of each parameter in the two monitoring points in Choba campus are shown in (Figure 3-5). The hourly mean concentration levels of total suspended particulate matter varied from 49.0 μg/m3 to 347.3 μg/m3 (Figure 1). The highest value exceeded the Federal Ministry of Environment’s limit of 250 μg/m3 by 38.9% and the National Ambient Air Quality Standards limit of 200 μg/m3) by 76.3%. Also, hourly mean concentrations of PM10 varied from 39.0 μg/m3 to 166.3 μg/m3 (Figure 1); the maximum value exceeded the NAAQS limit by 10.9%. Similarly, PM2.5 hourly mean concentration varied between 23.7 μg/m3 and 126.0 μg/m3 (Figure 1); the highest value exceeded the limit by 260.0%. Abali et al. in their study obtained a PM2.5 concentration up to 170.0 μg/m3 in Port Harcourt [14]. A Mann-Kendall trend statistic indicated that hourly mean concentrations of particulate matter in the Choba campus decreased with time of day. Highest concentrations were obtained in the morning hours (between 7:00 am and 8:00 am) as shown in (Figure 1 and 2). The occurrence of high concentration of particulate matter during the morning hours could be attributed to high vehicular traffic due to the rush hour when both students and the university staff are struggling to get to classrooms and offices. This may significantly affect sensitive groups, particularly students preparing for early morning (8:00 am) lectures.
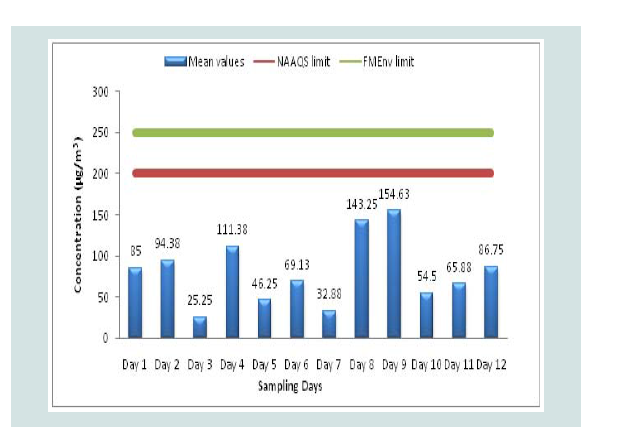
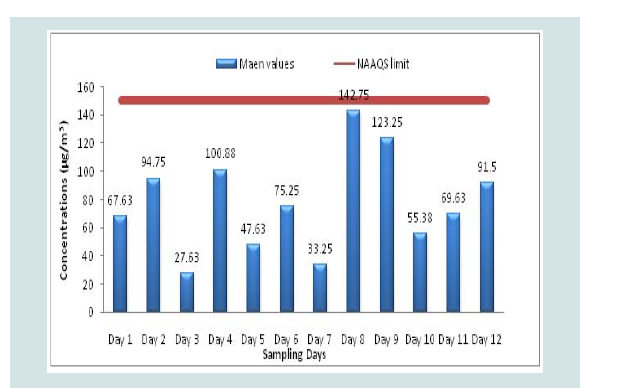
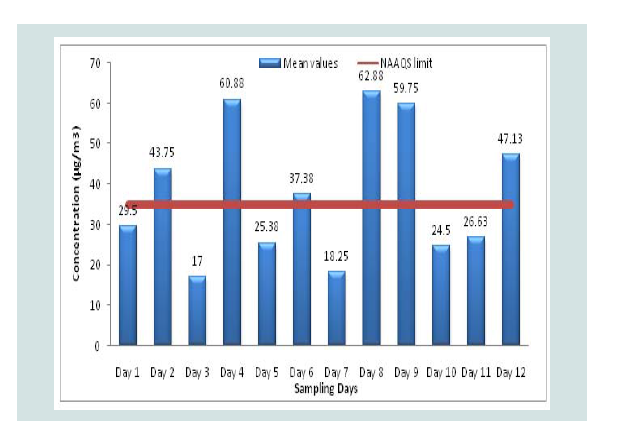
Cumulative mean concentrations of total suspended particulate matter varied from 25.25 μ/m3 to 154.3 μg/m3 (Figure 3). The meanvalues are below both the Federal Ministry of Environment (FMEnv) limit of 250 μ/m3 and the National Ambient Air Quality (NAAQS) limit of 200 μ/m3. The low values of TSP indicated that most of the particulate matters measured in the campus are either PM10 or PM2.5. Cumulative mean concentrations of PM10 varied from 27.63 μ/m3 to 142.75 μ/m3 (Figure 4). The mean values are below NAAQS permissible limit of 150 μ/m3, however, the highest value of 142.75 μ/m3 is close to the limit and may pose moderate long-term risk to human health. Similarly, cumulative mean concentrations of PM2.5 varied from 17.0 μ/m3 to 62.88 μ/m3 (Figure 5). Levels of PM2.5 obtained in the campus were 50% of the times higher than NAAQS stipulated limit of 35 μ/m3, thus may significantly affect public health. A study by Akinfolarin et al. reported high concentrations of PM2.5 and PM10 in Port Harcourt and concluded that these levels could be detrimental to public health and the environment [13]. The high concentration levels of inhalable particle in the campus may pose risk to people with respiratory diseases. Prolong exposure may also result in aggravation of asthma and cardiovascular problems among the exposed population. These airborne fine particles can also get deposited on exposed food items by food vendors operating within the campus. Often, some food vendors on the campus do not practice good hygiene and there is no proper monitoring on the side of the government. Staff and students on the campus may be affected through the ingestion of these exposed food items. In addition, the deposition of PM2.5 may coat plant leaves and block the pores thereby affecting exchange of gases on the leaves as well as reducing the penetration of sun light required for photosynthesis [11]. Such deposit of fine particles may also affect the aesthetics of buildings, and other materials.
The influences of meteorological condition such as wind speed on particulate matter dispersion and distribution in the area are shown in (Figure 6). The mean temperature was 31.4 °C, while the mean relative humidity was 77.0%. High concentration of particulate matter was obtained in the morning hours. A mean wind speed of 1.3 ms-1 was obtained in the area, while prevailing wind directions were northwest and southwest. Particulate matter was observed to increase with wind speed along the prevailing wind directions. This implies that wind speed and direction exert great influence on the distribution of particulate matter in the Choba campus. This result compliments the findings by Yorkor et al. on the role of meteorology on seasonal variation in air quality [18].
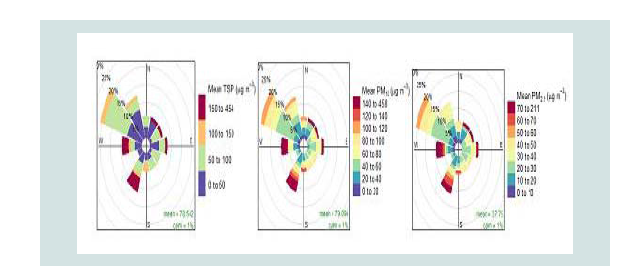
The plots also suggest that particulate concentrations in Choba campus are highly correlated to southwest wind speed. It is evident that particulate concentrations were more distributed as the wind speed increases from the south-west with more concentrations at the center, indicating local sources. This implies that sources of particulate matters in Choba campus are both local and external. This finding suggests that vehicular exhaust emissions, construction activities and the use of generating sets within the Choba campus are local sources of the particulate matter on the campus, while the transportation of black carbon and other particles to the area by the southwest winds are from the external sources.
Conclusion
The air quality within Choba campus of the University of Port Harcourt is poor due to high level of PM2.5. This high level of PM2.5 may significantly affect exposed sensitive groups. The students and public at large should be informed of daily air quality so they can take precautionary measures and reduce exposure times. There is epidemiologic evidence that short-term exposure to PM2.5 is positively correlated with mortality of exposed group, therefore PM pollution is of public health concern. The management of the University should respond rapidly by setting up environmental investigation into other sources of particulate pollution and ways of mitigation using multiagency kind of intervention.
References
- Ali-Mohamed AY, Jaffar AH (2000) Estimation of atmospheric inorganic water-soluble aerosols in the western region of Bahrain by ion chromatography. Chemosphere - Global Change Science 2: 85-94.
- Bhaskar BV, Mehta VM (2010) Atmospheric particulate pollutants and their relationship with meteorology in Ahmedabad. Aerosol Air Qual Res 10: 301-315.
- Habeebullah TM (2014) Modeling particulate matter (PM10) in makkah, saudi arabia - a view point of health impact. J Clean Energy Technol 2: 196-200.
- Rao MN, Rao HV (2005) Air Pollution. Tata McGraw-Hill Publishing Company Limited, 22nd reprint, New Delhi, India.
- Menon S, Hansen J, Nazarenko L, Luo Y (2002) Climate effects of black carbon aerosols in China and India. Science 297: 2250-2253.
- Yadav AK, Sahoo SK, Kumar AV, Pandey G (2013) Spatial and temporal variation of particulate matter with height in residential and sand mining areas in Ganjam district of Odisha, India. Int Res J Environ Scie 2: 19-24.
- Davis ML, Masten SJ (2004) Principles of environmental engineering and science. McGraw Hill Higher Education, USA, pp. 704.
- (2013) Air pollution fact sheet 2013 - Netherlands. European Environment Agency. pp. 22.
- Yakubu OH (2017) Particle (soot) pollution in Port Harcourt Rivers State, Nigeria-double air pollution burden? Understanding and tackling potential environmental public health impacts. Environments 5: 2.
- Akindejoye F (2018) The impact of soot to human health: an environmental analysis of the Niger Delta. CSR In Action, Nigeria.
- Mohapatra K, Biswal SK (2014) Effect of particulate matter (PM) on plants, climate, ecosystem and human Health. Int J Adv Tech Engg Sci 02: 118-129.
- Rather PA, Mushtaq B, Wanganeo A, Bhat BA, Wani MA (2014) Air quality of university campus and national highway no.12 at Hoshangabad Road, Bhopal, India. Int J Marine Atmos Earth Sci 2: 52-57.
- Akinfolarin OM, Boisa N, Obunwo CC (2017) Assessment of particulate matter-based air quality index in port harcourt Nigeria. J Environ Anal Chem 4: 224.
- Abali HW, Etebu OM, Leton TG (2018) seasonal particulate pollution in port harcourt Nigeria. J Environ Pollu Hum Health 6: 20-25.
- Akinfolarin OM, Obunwo CC, Boisa N (2018) Air quality characteristics of emerging industrial areas In port harcourt, Nigeria. J Chem Soc Nigeria 43: 7-14.
- (1991) Guidelines and standards for environmental pollution control in Nigeria. Federal Environmental Protection Agency. pp. 238.
- (2010) National Ambient Air Quality Standard (NAAQS) revised edition. Environmental Protection Agency.
- Yorkor B, Leton TG, Ugbebor JN (2017) The role of meteorology for seasonal variation in air pollution level in Eleme, Rivers State, Nigeria. J Scientific Res Rep 17: 1-17.