
Journal of Environmental Studies
Download PDF
Research Article
*Address for Correspondence: Ram B. Jain, Private Consultant, 2959 Estate View Court, Dacula, Georgia 30019, USA, Tel: 1-910-729-1049; E-mail: jain.ram.b@gmail.com
Citation: Jain RB. Impact of Pregnancy on the Levels of the Sunscreen Agent Benzophenone-3: Data from NHANES 2005-2010. J Environ Stud. 2016;2(1): 5.
Copyright © 2016 Jain RB. This is an open access article distributed under the Creative Commons Attribution License, which permits unrestricted use, distribution, and reproduction in any medium, provided the original work is properly cited.
Journal of Environmental Studies | ISSN: 2471-4879| Volume: 2, Issue: 1
Submission: 22 February, 2016 | Accepted: 25 March, 2016 | Published: 31 March, 2016
Reviewed & Approved by: Dr. Junichi Iwata, Department of Diagnostic & Biomedical Sciences, University of Texas Health Science Center, USA
Multivariate regression analysis
Impact of Pregnancy on the Levels of the Sunscreen Agent Benzophenone-3: Data from NHANES 2005-2010
Ram B. Jain*
- Private Consultant, 2959 Estate View Court, Dacula, Georgia 30019, USA
*Address for Correspondence: Ram B. Jain, Private Consultant, 2959 Estate View Court, Dacula, Georgia 30019, USA, Tel: 1-910-729-1049; E-mail: jain.ram.b@gmail.com
Citation: Jain RB. Impact of Pregnancy on the Levels of the Sunscreen Agent Benzophenone-3: Data from NHANES 2005-2010. J Environ Stud. 2016;2(1): 5.
Copyright © 2016 Jain RB. This is an open access article distributed under the Creative Commons Attribution License, which permits unrestricted use, distribution, and reproduction in any medium, provided the original work is properly cited.
Journal of Environmental Studies | ISSN: 2471-4879| Volume: 2, Issue: 1
Submission: 22 February, 2016 | Accepted: 25 March, 2016 | Published: 31 March, 2016
Reviewed & Approved by: Dr. Junichi Iwata, Department of Diagnostic & Biomedical Sciences, University of Texas Health Science Center, USA
Abstract
Data from National Health and Nutrition Examination Survey were used to evaluate the impact of pregnancy on the levels of the sunscreen agent benzophenone-3. Regression models were fitted to evaluate this association with adjustment for other factors that affect the levels of these chemicals. There was a suggestion that pregnant females had higher levels of benzophenone-3 but the differences were not statistically significant. Even though statistically significant trends were not detected, levels of benzophenone-3 decreased over pregnancy trimesters. Smoking was associated with statistically significantly lower levels of benzophenone-3. Inability to store iron was associated with lower levels of benzophenone-3. Non-Hispanic blacks had the lowest levels of benzophenone-3 as compared with other race/ethnicities. Body mass index was inversely associated with the levels of benzophenone-3.Keywords
Regression models; Smoking; NHANES; PregnancyIntroduction
Benzophenones (BP) are a class of compounds used to protect the skin and hair from ultraviolet radiation. Specifically, benzophenone-3 (2-hydroxy-4-methxy-benzophenone, BP-3) absorbs and dissipates ultraviolet radiation which facilitates its use as a sunscreen agent. It is also used in many other consumer products, for example, as fragrance and flavor enhancer, photoinitiator, ultraviolet curing agent, and polymerization inhibitor [1]. BP-3 has also been detected in both raw and water treated by water filtration plants [2] in California, in waste water in Slovenia and in Switzerland [3,4]. BP-3 has been detected in urine of pregnant females and more than half of the amniotic fluid samples [5] with a high correlation of 0.53 between their concentrations in maternal urine and amniotic fluid. In a study of 105 pregnant females in Northern Puerto Rico [6], BP-3 was detected in 100% the urine samples and the levels of BP-3 among Puerto Rican pregnant females were found to be higher than females of reproductive age in general US population (52.2 ng/mL vs. 38.6 ng/mL for NHANES 2007-2008 and 36.3 ng/mL for NHANES 2009-2010). BP-3 concentrations were found to be positively associated with birth weight and head circumference at birth [7]. Higher maternal BP-3 concentrations were associated with a similar decrease in birth weight among girls but with greater birth weight in boys in a study done in New York City [8]. Higher concentrations of BP-3 were found to be associated with reduced gestation [9]. Using data from 2003-2004 cycle of National Health and Nutrition Examination Survey (NHANES), Calafat et al. found adjusted concentrations of BP-3 to be higher among females than males, and higher in non-Hispanic whites than non-Hispanic blacks [1].The adverse health effects associated with the exposures to BP-3 should of particular concern for the developing fetus. To the best of our knowledge, we do not know of a study done in the general population to delineate the differences in the concentrations of BP-3 in pregnant and non-pregnant females. Consequently, this study was undertaken to evaluate the impact of pregnancy on the concentrations of BP-3 among females aged 20-44 years. The data from NHANES (www.cdc.gov/nchs/nhanes.htm) for the period 2005-2010 were used for this purpose.
Materials and Methods
Data were downloaded from demographic (http://www.cdc.gov/nchs/nhanes/nhanes2005-2006/DEMO_D.htm ), BP-3 (http://www.cdc.gov/nchs/nhanes/nhanes2005-2006/EPH_D.htm), serum cotinine, body measures, and pregnancy files (http://www.cdc.gov/nchs/nhanes/nhanes2005-2006/UCPREG_D.htm) from NHANES for the survey years 2005-2010 and match merged. NHANES uses a complex, stratified, multistage, probability sampling designed as representative of the civilian, non-institutionalized U.S. population based on age, gender, and race/ethnicity (http://www.cdc.gov/nchs/nhanes.htm). Sampling weights are created in NHANES to account for the complex survey design, including oversampling, survey nonresponse, and post-stratification. This study was limited to those females who were aged 20-44 years. Non-smokers were defined as those who had serum cotinine levels below 10 ng/mL and smokers were defined as those who had serum cotinine levels ≥ 10 ng/mL. Laboratory methods to measure BP-3 are provided elsewhere (http://www.cdc.gov/nchs/nhanes/nhanes2005-2006/EPH_D.htm#Description_of_Laboratory_Methodology). Laboratory methodology to test for pregnancy is also provided elsewhere (http://www.cdc.gov/nchs/nhanes/nhanes2005-2006/UCPREG_D.htm#Description_of_Laboratory_Methodology). Percent of urine samples for which BP-3 had concentrations ≥ the limit of detection (LOD) was 91.1%. All observations below the LOD were imputed as LOD ÷ √2 before proceeding to analyze data.All analyses were done using SAS version 9.2 (www.sas.com, SAS, Cary, North Carolina, USA) and SUDAAN version 11.0 (www.rti.org/SUDAAN, Rsearch Triangle Institute International, Research Triangle Park, North Carolina, USA). All analyses used appropriate weights as provided in the data files. SUDAAN Proc DESCRIPT was used to compute unadjusted geometric means and percent participants ≥ LOD. SUDAAN Proc REGRESS was used to fit linear regression models. The dependent variable used in regression models was the log10 transformed values of BP-3. The independent variables were: age, race/ethnicity (non-Hispanic white (NHW), non-Hispanic black (NHB), Mexican American (MA), and other unclassified race/ethnicities (OTH)), pregnancy status (pregnant, non-pregnant), smoking status (nonsmoker, smoker), iron storage status (absent, deficient, replete), body mass index, and NHANES study year to adjust for any changes over time, urine albumin, and urine creatinine. Iron storage status was defined as being absent if the values of serum ferritin were < 16.5 ng/mL. Those with serum ferritin values between 16.5 and 26.5 ng/mL were defined as being iron deficient and those with > 26.5 ng/mL as iron replete. This classification has previously been used by Jain [10]. Number of live births was also considered as one of the independent variables but, in a preliminary analysis, this was not found to have statistically significant association with BP-3. First order interaction terms between race/ethnicity, smoking status, iron storage status, and pregnancy status were considered for all models but were retained in the final models only if they were statistically significant at α=0.05. In addition, univariate analyses using SUDAAN Proc DESCRIPT were also done to compare BP-3 concentrations across the three pregnancy trimesters. All pairwise comparisons were tested for significant differences by using t-test.
After removing 70 females from the data set for whom either the smoking status and/or the iron storage status were missing, a total of 1147 participants (149 pregnant and 998 non-pregnant females) were available for analysis. The sample size details are given in Table 1. However, actual sample sizes used for regression models were slightly smaller because of missing values for other independent variables like body mass index etc.
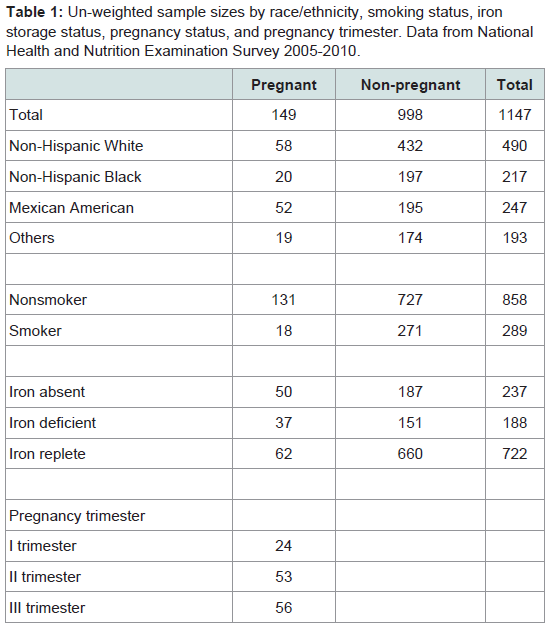
Table 1: Un-weighted sample sizes by race/ethnicity, smoking status, iron storage status, pregnancy status, and pregnancy trimester. Data from National Health and Nutrition Examination Survey 2005-2010.
Results
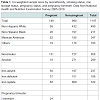
Univariate analysisNHW had statistically significantly higher unadjusted geometric mean (UGM) for BP-3 concentrations than NHB (p< 0.01, Table 2). In fact, UGM for NHW was more than three times of what it was for NHB (44.2 vs. 13.6 ng/mg creatinine, Table 2). In addition, NHB had statistically significantly lower levels than MA and OTH (p < 0.01). UGM for BP-3 concentrations was statistically significantly higher when iron was replete as compared to when iron was absent (p< 0.01, Table 2). Nonsmokers had statistically significantly higher levels of BP-3 than smokers (p< 0.01, Table 2). Pregnancy status did not (statistically significantly) affect the concentrations of BP-3 even though pregnant females did have higher BP-3 concentrations than non-pregnant females (p=0.2, Table 2). UGM for BP-3 concentrations for pregnant females declined from 107.1 (28.3- 405.5) ng/mg creatinine during first trimester to 37.8 (11.0-97.5) ng/mg creatinine during second trimester and rose somewhat to 52.1 (23.3-116.2) ng/mg creatinine during third trimester (data not shown in Tables). However, none of the differences were statistically significant.
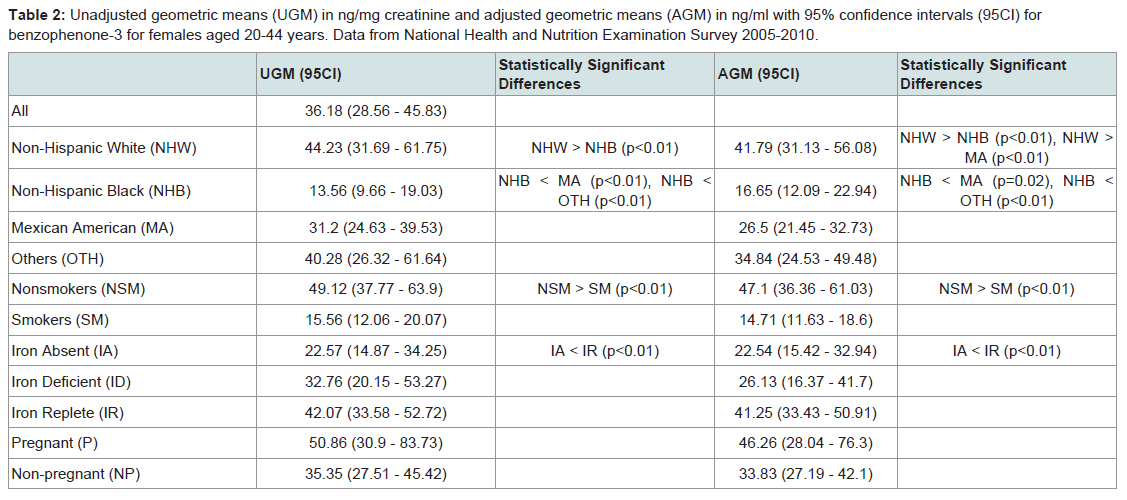
Table 2: Unadjusted geometric means (UGM) in ng/mg creatinine and adjusted geometric means (AGM) in ng/ml with 95% confidence intervals (95CI) for benzophenone-3 for females aged 20-44 years. Data from National Health and Nutrition Examination Survey 2005-2010.
None of the interaction terms were found to be statistically significant at α=0.05 for any of the data analyzed in this study. The actual sample size used in the analysis was 1035. R2 for the model for BP-3 was 14.1%.
The order in which adjusted geometric means (AGM) for BP-3 concentrations were observed was NHW > OTH > MA > NHB and NHW had statistically significantly higher AGM than NHB and MA (p< 0.01, Table 2). In addition, NHB had statistically significantly lower levels than both MA and OTH (Table 2). AGM for BP-3 concentrations for nonsmokers was more than three time of what it was for smokers (47.1 vs. 14.7 ng/mL, p< 0.01, Table 2). AGM for BP-3 concentrations was statistically significantly higher when iron was replete as compared to when iron was absent (p< 0.01, Table 2). AGM for pregnant females was higher than non-pregnant females but differences were not statistically significant (Table 2).
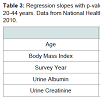
Age did not affect the concentrations of BP-3 (Table 3). Concentrations of BP-3 decreased (p< 0.001, Table 3) with increase in BMI. Urine albumin had a negative association with BP-3 (p=0.04) and a positive association urine creatinine (p< 0.001, Table 3).
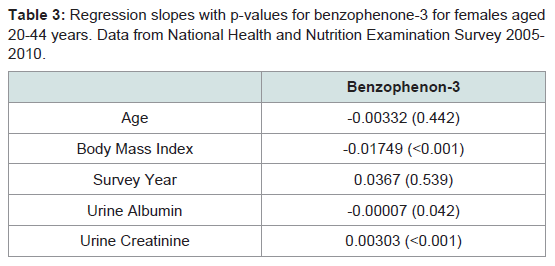
Table 3: Regression slopes with p-values for benzophenone-3 for females aged 20-44 years. Data from National Health and Nutrition Examination Survey 2005-2010.
Discussion
In spite of the fact that pregnant females had 36.7% higher AGM for BP-3 concentrations than non-pregnant females, the differences were not found to be statistically significant. These results are somewhat surprising. It looks like larger variability for pregnant females as compared to non-pregnant females in the values of BP-3 may be the reason for non-significant differences observed between pregnant and non-pregnant females since standard errors of AGMs for pregnant females 2.3 times greater than those for non-pregnant females (0.11 vs. 0.05, data not shown). The reason for relatively larger changes in concentrations of these chemicals among pregnant females is obviously because of ongoing physiological changes and associated processes as pregnancy progresses from the first to third trimesters. These changes as pregnancy progresses are reflected in the trimester wise chemical concentration provided before.There was more than 50% decrease in UGM for BP-3 concentrations from first trimester to third trimester (107.1 vs. 52.1 ng/mg creatinine) for pregnant females but no statistically significant differences were observed. Consequently, we went back and looked at the relative standard errors of unadjusted log transformed means over the three trimesters. For BP-3, variability was highest for the first trimester (0.28) with variability declining as pregnancy progressed from first to third trimester (0.23 for second trimester, 0.17 for third trimester). The relatively large variability among concentrations of BP-3 during the first trimester is probably because of variable exposure levels females’ have to these chemicals, and therefore different chemical burdens females have when entering pregnancy, along with the effects of physiological changes and associated processes initiated during pregnancy. Over time as the pregnancy progresses, the chemical burdens may be modified by the effect of ongoing hormonal changes upon metabolic processes. Or, it may be due to the effect of possibly, varying half-life of these chemicals. At this point in time, this is just a conjecture and there are no available trimester wise data to confirm or refute this conjecture. This is an area which requires future scientific investigations. The decreasing concentrations of BP-3seen in urine during pregnancy probably reflect transfer of BP-3 to the developing fetus since BP-3 has previously been detected in amniotic fluid [5]. The observed decreases in concentrations of BP-3 during pregnancy could potentially be due to modification of drug half-life. Although there is no specific evidence that BP-3 has altered half-life during pregnancy, there is evidence that similar processes occur with human pharmaceuticals. Changes in physiology during pregnancy which begin during the first trimester and are most marked during the third trimester alter the pharmacokinetics of many drugs leading to changes in how drugs are absorbed, distributed, and finally eliminated from the body [11]. For example, clearance of anti-convulsive drugs like carbamazepine during pregnancy is accelerated while those of drugs like theophylline are impaired [11]. Elimination half-life of caffeine in healthy adults is about 4.9 hours; among women taking oral contraceptives about 5-10 hours, among pregnant women about 9-11 hours, and as much as 96 hours among individuals with severe liver disease (http://www. news-medical.net/health/Caffeine-Pharmacology.aspx). Behavioral changes during pregnancy may also affect exposure to chemicals, and therefore chemical burden. However, caution must be exercised to understand and interpret these results. Toxicant concentrations are dynamic and can dramatically change with various metabolic states within the body. In this study, data from only single urine samples were available and as such may not be reflective of the true toxicant concentrations in the body. Observed toxicant concentrations may be affected by activity concentration, time of the day, dietary intake, and many other variables.
Further, these results were generated using cross-sectional data. As such, the trimester wise data analyzed were from different pregnant females. In addition, while NHANES data do provide representative samples for certain combinations of age, gender, and racial/ethnicity, the data may not represent a representative sample of pregnant and non-pregnant females. Also, there was an imbalance in the size of data for pregnant and non-pregnant females over the study period. The number of pregnant females in the data for the years 2005- 2006, 2007-2008, and 2009-2010 were 106, 20, and 23 respectively. The number of non-pregnant females in the data for the years 2005-2006, 2007-2008, and 2009-2010 were 266, 336, and 396 respectively. This is because while pregnant females were oversampled until the NHANES cycle 2005-2006, oversampling of pregnant females was discontinued starting the NHANES cycle 2007-2008 (http://www.cdc.gov/nchs/data/nhanes/analyticnote_2007-2010.pdf). However, total sample size of 203 for pregnant females and 998 for nonpregnant females is still large enough by any statistical standards. In addition to the data quality, the outcome of any statistical analysis also depends up on natural characteristics of the data. In this case, non-representative and non-longitudinal nature of the data did affect the data quality. Relatively larger variability in the data for pregnant females is probably natural but it did affect the outcome of statistical analysis and the power of statistical tests. If the sample size for pregnant females was 5 or 10 times larger than it was, it is unknown but certainly possible that the power of statistical test could have increased. Finally, in order to truly understand the differences in how these chemicals are metabolized over the pregnancy period, longitudinal data on same females from pre-pregnancy to beyond the lactational period are required. However, a longitudinal study of the size of NHANES may be prohibitively expensive.
Calafat et al. found adjusted concentrations of BP-3 to be higher among NHW than NHB [1]. In spite of the differences in population covered between the study by Calafat et al. and this study, we found the same results (Table 2) [1]. Higher concentrations of BP-3 among NHW as compared to NHB and MA as noted by Calafat et al. may be because of people with light skin pigmentation may feel a greater need to protect themselves from sun burn and thus use sun screen products containing BP-3 with a larger frequency [1]. This has been confirmed in some of the survey studies [12-14]. Thus, higher concentrations of BP-3 observed among NHW as compared to NHB and MA (Table 2) does reflect higher concentrations of exposure to BP-3.
Smokers were found to have statistically significantly lower concentrations of both BP-3 than nonsmokers (Table 2). In a study, Jain and Wang found smoking to be associated with statistically significantly lower concentrations of total polychlorinated dibenzop-dioxins and polychlorinated dibenzofurans than nonsmokers presumably because exposure to mainstream smoke may induce CYP1A2 which accelerates metabolism and elimination of these chemicals from serum [15]. While it not known if the same mechanism may be involved in accelerated metabolism and elimination of BP-3, this may be a possibility that needs to be further explored.
Inability to store adequate iron has been associated with higher concentrations of toxic metals like cadmium and lead in blood among pregnant and non-pregnant females [10]. However, what was surprising was that, in this study, for BP-3, the effect of inadequate iron storage upon chemical burden was opposing, with lower concentrations associated with iron deficiency. The reason for this is unknown. To the best of our knowledge, we do not know if anyone has studied the effect of inadequate iron storage on the concentrations of BP-3.
Since this research was based on data obtained from spot urine samples, adjustments were made to account for this by including urine creatinine concentrations in all regression models and not surprisingly, statistically significant positive correlation between the concentrations of urine creatinine and BP-3 was observed. Similarly urine albumin concentrations were used in all regression models to adjust for changes in albumin concentrations because of any disease or disorder and BP-3 concentrations were found to be negatively associated with urine albumin concentrations.
Based on the analysis of 2003-2004 NHANES data, age was not found to affect the concentrations of BP-3 though an inverse association with age2 was observed (p=0.04) for adults aged ≥ 20 years [1]. We too did not find the age to affect the concentrations of BP-3 (Table 3). However, age2 was not one of the variables analyzed in this study. Concentrations of BP-3 did not change over the study period of 2005-2010 (Table 3) meaning there was, possibly, no change in exposure to BP-3 over this period. We could not find a study that has evaluated trends in BP-3 concentrations over time and as such, the results of this study could not be verified. The inverse association between the concentrations of BP-3 and body mass index (Table 3) will need explanation. Calafat et al. did not study the effect of body mass index on the concentrations of BP-3 [1].
In summary, (i) pregnant females, possibly, had higher concentrations of BP-3 than non-pregnant females though this study did not provide any confirmation of this, (ii) smoking was associated with statistically significantly lower concentrations of BP-3, (iii) as compared to other racial/ethnic groups, non-Hispanic blacks had the lowest concentrations of BP-3, and (iv) females in second and third trimester of their pregnancy, possibly, had lower concentrations of BP-3 than females in first trimester of their pregnancy but we could not confirm this.
References
- Calafat AM, Wong LY, Ye X, Reidy JA, Needham LL (2008) Concentrations of the sunscreen agent benzophenone-3 in residents of the United States: National Health and Nutrition Examination Survey 2003--2004. Environ Health Perspect 116: 893-897.
- Loraine GA, Pettigrove ME (2006) Seasonal variations in concentrations of pharmaceuticals and personal care products in drinking water and reclaimed wastewater in southern California. Environ Sci Technol 40: 687-695.
- Cuderman P, Heath E (2007) Determination of UV filters and antimicrobial agents in environmental water samples. Anal Bioanal Chem 387: 1343-1350.
- Balmer ME, Buser HR, Müller MD, Poiger T (2005) Occurrence of some organic UV filters in wastewater, in surface waters, and in fish from Swiss Lakes. Environ Sci Technol 39: 953-962.
- Philippat C, Wolff MS, Calafat AM, Ye X, Bausell R, et al. (2013) Prenatal exposure to environmental phenols: concentrations in amniotic fluid and variability in urinary concentrations during pregnancy. Environ Health Perspect 121: 1225-1231.
- Meeker JD, Cantonwine DE, Rivera-Gonzalez LO, Ferguson KK, Mukherjee B, et al. (2013) Distribution, variability and predictors of urinary concentrations of phenols and parabens among pregnant women in Puerto Rico. Environ Sci Technol 47: 3439-3447.
- Philippat C, Mortamais M, Chevrier C, Petit C, Calafat AM, et al. (2012) Exposure to phthalates and phenols during pregnancy and offspring size at birth. Environ Health Perspect 120: 464-470.
- Wolff MS, Engel SM, Berkowitz GS, Ye X, Silva MJ, et al. (2008) Prenatal phenol and phthalate exposures and birth outcomes. Environ Health Perspect 116: 1092-1097.
- Tang R, Chen MJ, Ding GD, Chen XJ, Han XM, et al. (2013) Associations of prenatal exposure to phenols with birth outcomes. Environ Pollut 178: 115-120.
- Jain RB (2013) Effect of pregnancy on the levels of blood cadmium, lead, and mercury for females aged 17-39 years old: data from National Health and Nutrition Examination Survey 2003-2010. J Toxicol Environ Health A 76: 58-69.
- Dawes M, Chowienczyk PJ (2001) Pharmacokinetics in pregnancy. Clin Obstet Gynacol 15: 819-826.
- Briley JJ Jr, Lynfield YL, Chavda K (2007) Sunscreen use and usefulness in African-Americans. J Drugs Dermatol 6: 19-22.
- Pichon LC, Mayer JA, Slymen DJ, Elder JP, Lewis EC, et al. (2005) Ethnoracial differences among outdoor workers in key sun-safety behaviors. Am J Prev Med 28: 374-378.
- Jones SE, Saraiya M, Miyamoto J, Berkowitz Z (2012) Trends in sunscreen use among US high school students: 1999-2009. J Adolesc Health 50: 304-307.
- Jain RB, Wang RY (2011) Association of caffeine consumption and smoking status with the serum concentrations of polychlorinated biphenyls, dioxins, and furans in the general U.S. population: NHANES 2003-2004. J Toxicol Environ Health A 74: 1225-1239.