
Journal of Epidemiology & Health Care
Download PDF
Research Article
*Address for Correspondence: Jose Eduardo Corrente, Biostatistics Department, Bioscience Institute, University of Sao Paulo State, Botucatu, São Paulo, Brazil, E-mail: jecorren@ibb.unesp.br
Citation: Arruda Silveira de LV, Ruiz T, Corrente JE. Parametric Models in Survival Analysis: Application in a Cohort of Older People in a Medium Size City of São Paulo – Brazil. J Epidemiol Health Care 2016;1(1): 6.
Copyright © 2016 Silveira, et al. This is an open access article distributed under the Creative Commons Attribution License, which permits unrestricted use, distribution, and reproduction in any medium, provided the original work is properly cited.
Journal of Epidemiology & Health Care | Volume: 1, Issue: 1
Submission: 14 June, 2016 | Accepted: 10 August, 2016 | Published: 15 August, 2016
 Where pi(xl) is the probability of the lth individual failure until ai given it survives until ai-1 in the presence of the regressor variables xal.The function (1) matches with the likelihood function for variable with Bernoulli distribution once Δli is binary (that is, failure occurred or not in the interval Ii).The probability pi(xal) can be modelled considering a hazard proportional Cox model, logistic and generalized log-normal and Weibull models.Cox proportional hazard model: Adopting the Cox proportional hazard model for the lifetime, the hazard function for T given xl is:
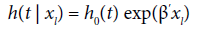 and the survival function is:
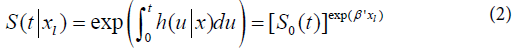 being S0(t) the baseline survival function. Modelling pi(xl) by (2), we have:
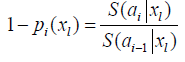 or
or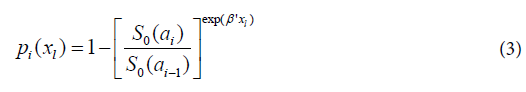 Replacing pi(xl), obtained from (3) in (1), the likelihood function for life table data with regressor variables (xl) will be given by:
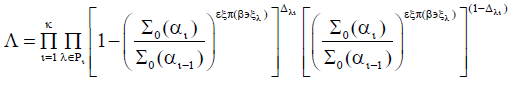 Parameters are estimated using a maximum likelihood method, maximizing the function:
 Where γ=log(-log(Qi)) is a reparametrized form and
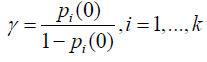
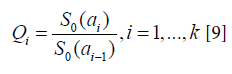 Logistic model: Adopting the Logistic model, we have:
 whereThen, the log-likehood can be written:
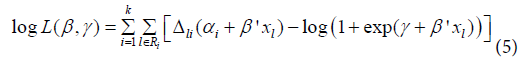 where αi = ln(γl) is a reparametrization to improve the normal approximation [10]. Parameters are estimated maximizing (5) using an iterative process.Generalized log-normal model: The Generalized Log-Normal Family (GLN) is a family of distribution with three parameters [11].It includes the log-normal distribution as a special case. Essentially, the GLN distribution is associated to the Box-Cox transformation. The general definition is the result of how to include the tails of the probability distribution that are generally neglected in the major studies about Box-Cox transformation Box-Cox [12].Let Φ be a standard normal distribution function. For t > 0 and for any λ, we define:
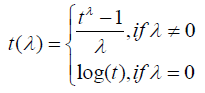 Let be Θ = {θt = (λ,μ,σ2)|λ ∈R,σ > 0} . Then, for some θ ∈Θ, and for t > 0 the Generalized Lognormal probability density function is defined as:
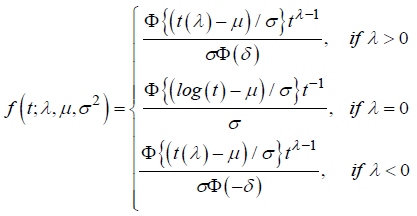 where
where 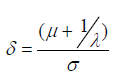 When λ = 0, this family of distributions is a particular case of the Log-Normal distribution. Also, if T ∼f(t;λ,μ,σ2), the cumulative distribution for T is given by:
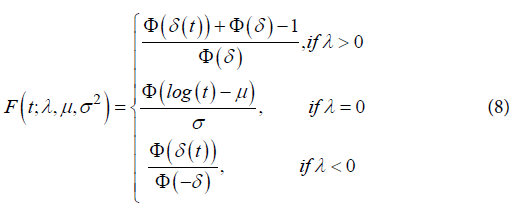 Adopting the model based on the generalized log-normal distribution for λ>0 [12], we have that pi(xl) is given by:
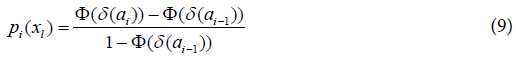 where Φ is the cumulative function of the standard normal distribution, λ the Box-Cox transformation parameter,
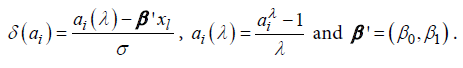 The parameter estimation is made using a maximum likelihood method and the likelihood function, the first and second order derivatives and the routine developed in SAS language [12].Generalized Weibull model (GW): Let T be a random variable with Weibull distribution. The probability density function is given by:
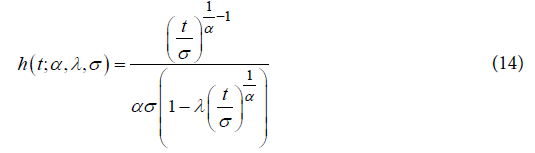
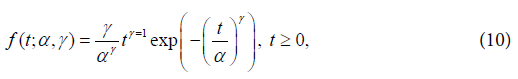 where γ is the shape and α is the scale parameters, both positives.The failure rate function h(t) of the Weibull distribution is strictly increasing for γ > 1, strictly decreasing for γ < 1 and constant for γ = 1. When γ = 1, we have the failure rate of the exponential distribution which is a particular case of the Weibull distribution. The Generalized Weibull family distribution is given, using quantile function, by:
 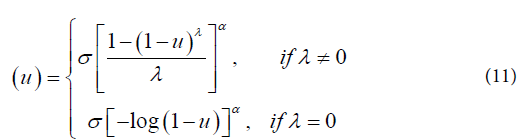 where α, σ > 0 and λ are real number.Inverting the quantile function given by (11), the cumulative distribution function of the Generalized Weibull is:
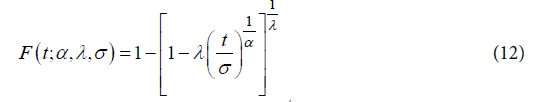
 The family given by (11) is Weibull for λ = 0, exponential for α = 1, λ = 0 and log-logistic when λ = -1, which are frequently used in survival studies. The most important is that, for λ ≤ 0 and α > 0, the quantile function given by (11) coincides with a Burr XII.The survival function and failure rate are, respectively:
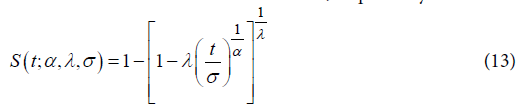
 An interesting characteristic of the Generalized Weibull family is the hazard function assumes four different forms in the four regions of the plane [13], divided by the lines α = 1 and λ = 0.Adopting a model based on the Generalized Weibull [13] and the likelihood function given by (1), we have:
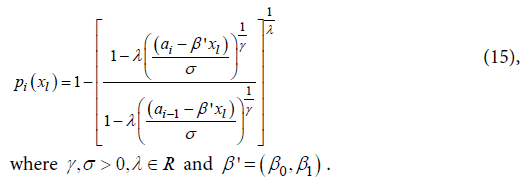 The implementation of the presented functions was made in SAS language [12].Therefore, the aim of this paper was to apply these more general distribution families to a survival data for a cohort of older people from Botucatu city, Sao Paulo, Brazil, considering the mortality for all causes as the outcome. These models can be an interesting alternative to the Cox proportional hazard model and may result in better fittings.
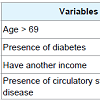
Comparing the AIC values, the generalized Weibull model was better considering each gender. Cox model has an assumption of proportional hazards and, it was observed in this data set that the major part of the covariates did not present proportional hazard, being this the motive of the worst fit.The significant covariates in the generalized Weibull model were: age greater than 69 years old (p < 0.0001), presence of diabetes (p = 0.0029) and have circulatory system disease (p < 0.0001) for female. For male, we found significance in age greater than 69 years old (p < 0.0001), presence of diabetes (p = 0.0029) and have circulatory system disease (p < 0.0001) and have another source of income (p = 0.0259) (Tables 2 and 3).
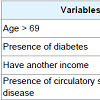
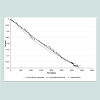
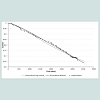
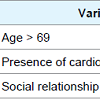
Next, variables referred about quality of life were included in the model using the domains of the FQOLS. In this case generalized lognormal model fitted better than others (AIC = 550.56). Results are showed in Table 4.Table 4 shows the variable age > 69 years old and the presence of cardiovascular disease are risk factor for survival. Social relations domain was a protection factor for survival, meaning that people who have good social relations have more chance to survival for more time.Figures 1 and 2 present the adjusted models for male and female, respectively.
Parametric Models in Survival Analysis: Application in a Cohort of Older People in a Medium Size City of São Paulo – Brazil
Liciana Vaz de Arruda Silveira1, Tania Ruiz2 and Jose Eduardo Corrente1*
- 1Biostatistics Department, Bioscience Institute, University of Sao Paulo State, Botucatu, São Paulo, Brazil
- 2Public Health Department, Botucatu Medicine School, University of Sao Paulo State, Botucatu, São Paulo, Brazil
- 3Department of Epidemiology, Harvard School of Public Health, Boston, USA
*Address for Correspondence: Jose Eduardo Corrente, Biostatistics Department, Bioscience Institute, University of Sao Paulo State, Botucatu, São Paulo, Brazil, E-mail: jecorren@ibb.unesp.br
Citation: Arruda Silveira de LV, Ruiz T, Corrente JE. Parametric Models in Survival Analysis: Application in a Cohort of Older People in a Medium Size City of São Paulo – Brazil. J Epidemiol Health Care 2016;1(1): 6.
Copyright © 2016 Silveira, et al. This is an open access article distributed under the Creative Commons Attribution License, which permits unrestricted use, distribution, and reproduction in any medium, provided the original work is properly cited.
Journal of Epidemiology & Health Care | Volume: 1, Issue: 1
Submission: 14 June, 2016 | Accepted: 10 August, 2016 | Published: 15 August, 2016
Abstract
Population ageing, Brazilian demographic facts in recent decades, became of the utmost importance for the social planning that emerges in this century with this new profile. Differences in survival in observed cohorts of older people according to some variables are referred in the literature. Then, the aim of this work was to develop more general parametric models to estimate survival time for grouped and censored data including covariates and apply them to data from the cohort of older people, considering as outcomes the death fromall causes and some specific. A population survey was carried out in Botucatu, SãoPaulo, Brazil, in the years of 2003, 2006 and 2010, in order to evaluate the survival time of these people. The sample size was calculated in 365 older people considering the quality of life as unknown (50%), 5% of margin error and 95% of reliability. It was observed the risks were not proportional. Then these new models (Generalized Log-Normal and Generalized Weibull) were used to estimate the survival time rather than Cox model that could not be appropriate for these data. Including covariates, it was found the age more than 60 years, diabetes mellitus, another income and cardiovascular disease were risk factor for survival. Already, social relationship was protective factor for survival, when including some aspects of quality of life. As a conclusion, the use of these models has become an interesting alternative to the Cox proportional hazard model and they seem more realistic with the factors involving survival time for older people.Keywords
Older people; Survival time; CohortIntroduction
The global demographic transition, which began in the late 19th century and characterized by increasing the proportion of older people in the population [1,2], brought with it the concern with greater survival associated with quality of life in this stage of life in which non communicable chronic diseases and disabilities are morefrequent [3]. Considering these aspects, studying survival related to the quality of life in this segment has been established as an important area of research.Regarding the known mortality risk among the elderly, once removed the influence of age on survival time, gender is the first characteristic to be remembered, once females have greatest chance to survival as seen in almost all the American, Asian and European countries [4]. Before the genre itself is a risk factor, what happensto this present generation it is that mortality differs between the two genres and so it is always better analyze them in separate [5]. Cardiovascular and malignant neoplasia are the most prevalent causes of death among older people [5].The literature also refers to differences in survival observed cohort of older people according to their lifestyle itself, confirming the association between lifestyle and cardiovascular mortality and cancer [6].Models for survival data analysis has often been used as the known Kaplan-Meier method [7] and the Cox proportional hazard model [8]. Kaplan-Meier method estimates the survival function but does not allow the inclusion of covariates and provides only comparison between curves according to the outcomes of interest. Already, Coxproportional hazards model allow including covariates and provides the risks of them in the model, but these risks must be proportional hypothesis, which is not always verified.Models for grouped and censored data
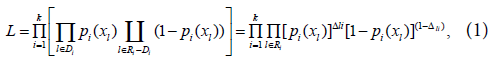
When we have data for survival time, it has been for grouped and censored data techniques.Let the lifetime be T1,l=1,..., n where n is the sample size, grouped in k intervalsIi = [ai-1],1,...,k with 0=a0 < a1 < ... < ak = ∞ and suppose all the censors occur at the end of the intervals. Let Di be a set of individuals that failure in the interval; Ii;Ri the set of individuals under risk at the beginning of Ii and Δli, the indicator function of failure of lth individual in Ii that is zero when the lth observation is censored in the ith interval and one otherwise, for i=1,...,k,l=1,...,n. Then, the likelihood function can be constructed for the life table with the regressor variable (x), given by: Where pi(xl) is the probability of the lth individual failure until ai given it survives until ai-1 in the presence of the regressor variables xal.The function (1) matches with the likelihood function for variable with Bernoulli distribution once Δli is binary (that is, failure occurred or not in the interval Ii).The probability pi(xal) can be modelled considering a hazard proportional Cox model, logistic and generalized log-normal and Weibull models.Cox proportional hazard model: Adopting the Cox proportional hazard model for the lifetime, the hazard function for T given xl is: and the survival function is: being S0(t) the baseline survival function. Modelling pi(xl) by (2), we have: or Replacing pi(xl), obtained from (3) in (1), the likelihood function for life table data with regressor variables (xl) will be given by: Parameters are estimated using a maximum likelihood method, maximizing the function: Where γ=log(-log(Qi)) is a reparametrized form and Logistic model: Adopting the Logistic model, we have: whereThen, the log-likehood can be written: where αi = ln(γl) is a reparametrization to improve the normal approximation [10]. Parameters are estimated maximizing (5) using an iterative process.Generalized log-normal model: The Generalized Log-Normal Family (GLN) is a family of distribution with three parameters [11].It includes the log-normal distribution as a special case. Essentially, the GLN distribution is associated to the Box-Cox transformation. The general definition is the result of how to include the tails of the probability distribution that are generally neglected in the major studies about Box-Cox transformation Box-Cox [12].Let Φ be a standard normal distribution function. For t > 0 and for any λ, we define: Let be Θ = {θt = (λ,μ,σ2)|λ ∈R,σ > 0} . Then, for some θ ∈Θ, and for t > 0 the Generalized Lognormal probability density function is defined as: where When λ = 0, this family of distributions is a particular case of the Log-Normal distribution. Also, if T ∼f(t;λ,μ,σ2), the cumulative distribution for T is given by: Adopting the model based on the generalized log-normal distribution for λ>0 [12], we have that pi(xl) is given by: where Φ is the cumulative function of the standard normal distribution, λ the Box-Cox transformation parameter, The parameter estimation is made using a maximum likelihood method and the likelihood function, the first and second order derivatives and the routine developed in SAS language [12].Generalized Weibull model (GW): Let T be a random variable with Weibull distribution. The probability density function is given by: where γ is the shape and α is the scale parameters, both positives.The failure rate function h(t) of the Weibull distribution is strictly increasing for γ > 1, strictly decreasing for γ < 1 and constant for γ = 1. When γ = 1, we have the failure rate of the exponential distribution which is a particular case of the Weibull distribution. The Generalized Weibull family distribution is given, using quantile function, by: where α, σ > 0 and λ are real number.Inverting the quantile function given by (11), the cumulative distribution function of the Generalized Weibull is: The family given by (11) is Weibull for λ = 0, exponential for α = 1, λ = 0 and log-logistic when λ = -1, which are frequently used in survival studies. The most important is that, for λ ≤ 0 and α > 0, the quantile function given by (11) coincides with a Burr XII.The survival function and failure rate are, respectively: An interesting characteristic of the Generalized Weibull family is the hazard function assumes four different forms in the four regions of the plane [13], divided by the lines α = 1 and λ = 0.Adopting a model based on the Generalized Weibull [13] and the likelihood function given by (1), we have: The implementation of the presented functions was made in SAS language [12].Therefore, the aim of this paper was to apply these more general distribution families to a survival data for a cohort of older people from Botucatu city, Sao Paulo, Brazil, considering the mortality for all causes as the outcome. These models can be an interesting alternative to the Cox proportional hazard model and may result in better fittings.Methodology
A survey was carried out in the Botucatu city, Sao Paulo, Brazil, firstly at the year of 2003, considered the baseline of the cohort and the main objective was evaluate the quality of life of the older people. At that time, the population of the city was estimated in 110000 nhabitants where 12141 were older people with 60 years and over [14], representing 11% of the population.For the baseline, the sample size was estimated considering 5% of error margin, 95% of reliability and the prevalence of quality of life in 50% (unknown), totalizing 384 people.It was a systematic sample in double stage after an update of the city map registered at the Census 2000. Nine thousands families were randomly selected using a 4:1 scale (26% of the households considering 1% of adjust) [14]. Next, 384 older people were randomly selected from these families. The inclusion criteria was to be capable to answer the questionnaire and excluded the ones that refused to articipate, the ones with some cognitive impairment, dementia or any factor that could interfere in the interview.The questionnaire was a fusion of several validated ones but the base was the Flanagan Quality of Life Scale (FQOLS) [15]. Adaptations were made in a pilot study in 2003, once some of elderly were illiterate, some presented difficulties to interpret the questions and problems with decreased visual acuity. Then, according to the pilot study, it was decided to use the “Motivation Scale” [16]. This scale consists of seven faces designed with the following expressions:a neutral face three motivated and three unmotivated. The size of the figure was adequate to the visual acuity of respondents to include all randomly selected.Seven years later (2010), the survival of the older people sample was studied considering the death of these people and their causes using a Mortality Information System (MIS) from Ministry of Health by means the municipal health secretary. One by one were searched in the system and, next, all households were revisited asking about the elder that lived there e had took part in the survey. All the deathwere confirmed by the death certificate from the system and from the family, in case of a not notified case. Elders not located were tracked using information from the neighborhood or from the closed trade next the old residence.Data obtained in 2010 were analyzed using the survival techniques presented here considering time of death for any cause as an outcome.The explanatory variables, obtained in 2003, were: sex, age and the score of quality of life measured by the FQOLS (transformed in binary variable using a median score as a cut off), cardiovascular disease, hypertension, lung disease and diabetes mellitus.With the survival data, firstly the survival curve was estimated using a Kaplan-Meier method and tested for each explanatory variable using a log-rank test. Next, Cox model was used to evaluate the risk of death. The model was tested including hierarchical blocksof variables, beginning with the demographic, comorbidities and quality of life (binary) and another model including the five domains of the FQOLS: welfare: material comfort, familial relationship, social relationship, develop new abilities. The generalized log-normal and generalized Weibull models were also fitted with these variables. It were used Statistical Package of the Social Sciences (SPSS) for windows, v, 10.0, and Statistical Analysis System (SAS) for windows, v.9.2 softwares to analyze the data.The use of this data set was authorized for the Ethical Committee for Research from the Botucatu Medical School (Process no. CAAE 14348113.0.0000.5411).Results
From the 365 older people interviewed in 2003, 28 (8%) were not found after seven years and 71% were alive. Related to the sociodemographic data, in the year of 2003 there were a prevalence of female in the population (60%), most of them with more than 70 years old (61.8%). Quality of life self-reported measured by theFQOLS, the median was 75 points varying from 31 to 97 (maximum =105 points), 25% referred cardiovascular disease, 45% hypertension, 15% diabetes mellitus and 7% lung disease.Cox, Generalized Weibull and Generalized Log-normal models were applied to the survival data set and the comparisons were made using a Akaike Information Criteria (AIC). The analysis were made separately for gender, where the behaviour are different related to the survival (Table 1).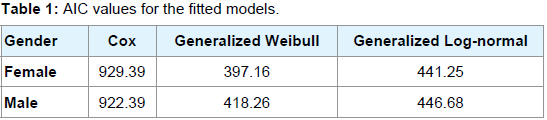
Table 1: AIC values for the fitted models.
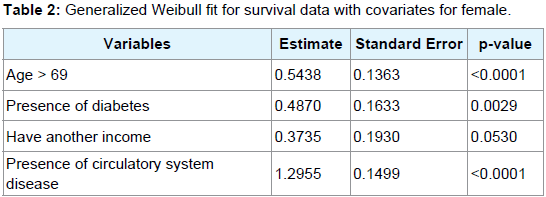
Table 2: Generalized Weibull fit for survival data with covariates for female
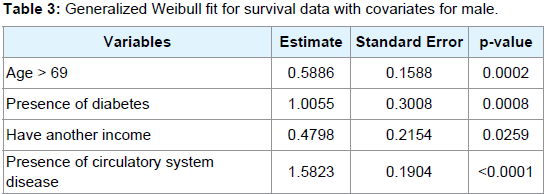
Table 3: Generalized Weibull fit for survival data with covariates for male.
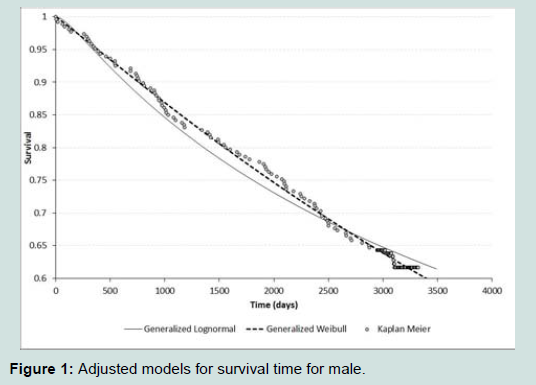
Figure 1: Adjusted models for survival time for male.
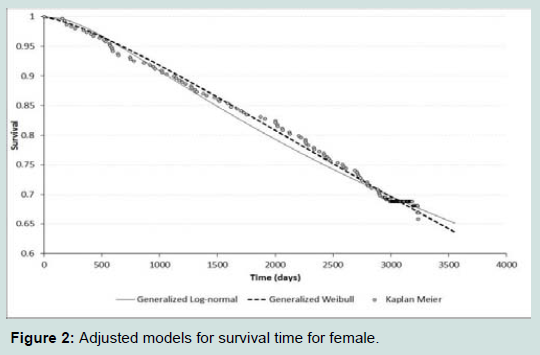
Figure 2: Adjusted models for survival time for female.
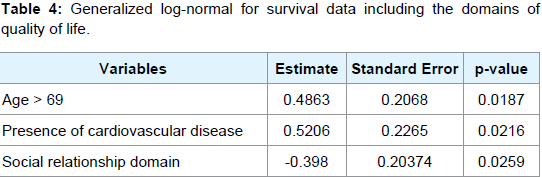
Table 4: Generalized log-normal for survival data including the domains of quality of life
Discussion
This study proposed to evaluate grouped and censored survival time for older people taking account some aspects of quality of life measured by the FQOLS and some morbidities more prevalent in this age using different approaches and fitting more general distributions comparing with the Cox model. As we can observe, the importance of develop new approaches in order to analyze grouped and censored survival data relay in the assumptions, once the considered data do not present proportional hazard. In this way, Cox model could be not appropriate for this sort of data.The most significant for maintaining quality of life self reported for the older people from Botucatu, Sao Paulo, Brazil, as a protector factor of mortality was the domain of social relations. However, differently from cross-sectional studies, it is difficult to define the direction of causality. The prospective follow-up of the elderly could examine the relationship between baseline characteristics and its subsequent amendments, determining the precision and the magnitude of the influence of the variables in the outcome, which shows a very high score and therefore very positive for the quality of life of the elderly in this study.The results of this study indicate that the lower survival of the population was related to older age and have age greater than 70 years old, presence of diabetes mellitus, have another income and cardiovascular disease both for men as for women. A study on the main causes of death in Sao Paulo showed that the largest proportion of preventable deaths was between heart disease (29.7%), which also had the highest mortality rate, 81.0 and 47.4 deaths per 10,000 olders male and female, respectively [71]. Therefore, it is important to reflect on prevention to minimize comorbidity of heart disease in this population.Unlike of these findings, it was found that cognitive impairment (HR = 4.30), stroke (HR = 3.49), and dependence for basic activities of daily living (HR = 3.17) were the main risk factors for survival in older adults with functional limitations [18]. Also, diagnosis of dementia (p = 0.018) and depression (p = 0.007) as a statistically significant reduced in survival when the elderly suffer a hip fracture [19].It was found with the fitted models that women had higher survival rate from men. Although women live longer, they do not enjoy better health, they tend to mention greater functional difficulties than men (in 2003, in Brazil, the prevalence of difficulty walking 100 m was 17.6% for older men and 26.6% for women) [20].Related to the quality of life, a survey data from Avaré, São Paulo, Brazil, claim that the quality of life of the older adults was considered good, although they presented limitations [21]. The main factors associated with life satisfaction in general were the financial situation, comfort with the place where they live and even the lack of opportunity for leisure activities. Another study carried out in Botucatu city showed that the sequence of the domains for quality of life was the same the one proposed by the FQOLS, that is, physical and material well-being, relation with others, social activities,personal development and recreation [22]. As we can observe, social relationship is a protector factor for survival according to our findings.Also in Botucatu, an analysis of quality of life of older people according to their own opinion, revealed, among other findings, a group who valued pleasure and material comfort [23]. In this same group, it was found factors associated with quality of life for theelderly were: age, marital status and the reference heart problems and that the high degree of satisfaction indicated that this step life where they have the opportunity to live according to their own values [24].Quality of life self reported was assessed positively by the older people in this study and may be considered a predictor of survival time. The well-being and material comfort is the domain of Flanagan instrument that better explain this last result This study may help to propose actions for the older people within the municipal health policy. It is suggested initiatives to developthe welfare and comfort by providing incentives in the municipal infrastructure as well as the practice of physical activities.This would benefit the development of the psychological, social and cognitive aspects in addition to improve performance in activities of daily living and enthusiasm for life, important indicators of quality of life and health promotion that reflects in an independent and successful ageing.Conclusions
We can conclude that the proposed models could reveal important aspects for the survival time for older people considering covariates as demographic information, quality of life and more prevalent morbidities. It was found the risk factors for survival were age, diabetes mellitus, another income and cardiovascular disease. Already, social relationships were a protector factor for survival.Also, the proposed models can be an alternative suggestion for Cox model in case on non proportional risks. Another study can be proposed in order to make some simulation study and more comparisons among them.Acknowledgements
The authors would like to thank to FAPESP (Process no. 2012/03599-8) for the financial support to develop this research.References
- Lima-Costa MF, Barreto SM, Giatti L (2003) Health status, physical functioning, health services utilization, and expenditures on medicines among Brazilian elderly: a descriptive study using data from the National Household Survey. Cad Saude Publica 19: 735-743.
- Barreto, Teixeira ML, Neto MG, Duarte OL, Carmen E (2009) The birth, life, illness, death and health care of the population over 20 years of the Unified Health System: a summary. Ministry of Health.
- Campolina AG, Adami F, Santos, JL, Lebrao ML (2013) The health transition and changes in healthy life expectancy in the elderly population: possible impacts of chronic disease prevention. Cad Saude Publica 29: 1217-1229.
- Ham Chor D, Duchaide MP, Jourdan AM (1992) The sex differential in mortality in a city Southeastern Brazil - 1960, 1970, 1980. J Public Health 26: 246-255.
- Ruiz T, Chalita LV, Barros, MB (2003) Survival study of a sixty year-old and older cohort in Botucatu (SP) - Brazil. Rev Bras Epidemiol 6: 227-236.
- Wihelmson K, Allebeck P, Berg S, Steen B (2002) Mortality in three different cohorts of 70-year olds: the impact of social factors and health. Aging Clin Exp Res 14: 143-151.
- Kaplan EL, Meier P (1958) Nonparametric estimation from incomplete observations. J Am Stat Assoc 53: 457-481.
- Cox DR (1972) Regression models and life-tables. J R Stat Soc Series B 34: 187-220.
- Prentice RL, Gloeckler LA (1978) Regression analysis of grouped survival data with application to breast cancer data. Biometrics 34: 57-67.
- Lawless JF (1982) Statistical models and methods for lifetime data. John Wiley & Sons, New York.
- Chen G (1995) Generalized log-normal distributions with reliability application. Comput Stat Data Anal 19: 300-319.
- Silveira LV, Colosimo EA, Passos JR (2010) Generalized log-normal model for grouped survival data. Commun Stat Theory Methods 39: 2659-2666.
- Mudholkar GS, Srivastava DK, Freimer M (1985) The exponentiated Weibull family: a reanalysis of the bus-motor-failure data. Technometrics 37: 436-445.
- Cordeiro R, Sakate M, Clemente AP, Diniz CS, Donalisio MR (2005) Underreporting of non-fatal work-related injuries in Brazil. Rev Saude Publica 39: 254-260.
- Flanagan JC (1982) Measurement of quality of life: current state of the art. Arch Phys Med Rehabil 63: 56-59.
- Burckhardt CS, Anderson KL, Archenholtz B, Hagg O (2003) The flanagan quality of life scale: evidence of construct validity. Health Qual Life Outcomes 1: 59.
- Kanso S, Romero DE, Leite lda IC, Marques A (2013) Avoidability of deaths from chronic illnesses in elderly individuals in Sao Paulo, Brazil. Cad Saude Publica 29: 735-748.
- Maciel AC, Guerra RO (2008) Functional limitation and survival of community dwelling elderly. Rev Assoc Med Bras 54: 347-352.
- Ricci G, Longaray MP, Goncalves RZ, Neto Ada S, Manente M, et al. (2012) Evaluation of the mortality rate one year after hip fracture and factors relating to diminished survival among elderly people. Rev Bras Ortop 47: 304-309.
- Parahyba MI, Simoes CC (2006) Disability prevalence among the elderly in Brazil. Cienc Saude Coletiva 11: 967-974
- Current JE, Machado AB (2010) Quality of life assessment of an elderly population of a resort in the state of Sao Paulo: application of the Flanagan’s scale. J APS 13: 156-163.
- de Souza LB, Corrente JE (2013) Evaluation of the Flanagan quality of life scale for older adults. Int J Sci Commer Humanit 1: 10-20.
- Vecchia RD, Ruiz T, Bocchi SC, Corrente JE (2005) Quality of life in the elderly: a subjective concept. Rev Bras Epidemiol 8: 246-252.
- Ruiz T, Corrente JE, Bocchi SC, Donalísio MR, Cordeiro RC (2008) Correlation between quality of life of vision and aspects of lifestyle in the elderly Botucatu-sp municipality. J APS 11: 145-151.