
Journal of Cancer Sciences
Download PDF
Review Article
*Address for Correspondence: Dr. Livy Alex, SLS Cell Cure Technologies Private Limited, 103, Prabhat Apartments. Street No-11, East Marredpally, Secunderabad-500026,Telangana, India, Tel: (91)-40-27734415, Fax: (91)-40-27734415, E-mail: drlivys@yahoo.com*
Address for Correspondence: Dr. Shivraj Dasari, SLS Cell Cure Technologies Private Limited, 103, Prabhat Apartments. Street No-11, East Marredpally, Secunderabad-500026, Telangana, India, Tel: (91)-40-27734415, Fax: (91)-40-27734415; E-mail: shivraj23@yahoo.com
Citation: Dasari S, Alex L. Microarray Based Genotyping: A Review. J Cancer Sci. 2014;1(1): 11.
Copyright © 2014 Dasari and Alex. This is an open access article distributed under the Creative Commons Attribution License, which permits unrestricted use, distribution, and reproduction in any medium, provided the original work is properly cited.
Journal of Cancer Sciences | ISSN: 2377-9292 | Volume: 1, Issue: 1
Submission: 24 August 2014 | Accepted: 31 October 2014 | Published: 1 November 2014

The 5’ hydroxyl group of the sugar molecule of the last nucleotide will be attached to the phosphate group of the next nucleotide by a covalent reaction.
It is very obvious that the fabrication of microarrays technology has evolved and matured from one assay to another. It has evolved based on microarray density (spot size and pin configuration), reproducibility, sensitivity and specificity, printing quality, andcontaminations. The first microarray fabrication method, the printing method, functions by synthesizing the probes separately then printing them onto the microarray. The probes used in the printing method are in fluidic form and known as low-density microarray. Printed method has an intermediate level of sensitivity but is low in specificity. This method is also very poor in terms of cross-contamination and printing quality.
Microarray Based Genotyping: A Review
Shivraj Dasari and Livy Alex*
- SLS Cell Cure Technologies Private Limited, Telangana, India
*Address for Correspondence: Dr. Livy Alex, SLS Cell Cure Technologies Private Limited, 103, Prabhat Apartments. Street No-11, East Marredpally, Secunderabad-500026,Telangana, India, Tel: (91)-40-27734415, Fax: (91)-40-27734415, E-mail: drlivys@yahoo.com*
Address for Correspondence: Dr. Shivraj Dasari, SLS Cell Cure Technologies Private Limited, 103, Prabhat Apartments. Street No-11, East Marredpally, Secunderabad-500026, Telangana, India, Tel: (91)-40-27734415, Fax: (91)-40-27734415; E-mail: shivraj23@yahoo.com
Citation: Dasari S, Alex L. Microarray Based Genotyping: A Review. J Cancer Sci. 2014;1(1): 11.
Copyright © 2014 Dasari and Alex. This is an open access article distributed under the Creative Commons Attribution License, which permits unrestricted use, distribution, and reproduction in any medium, provided the original work is properly cited.
Journal of Cancer Sciences | ISSN: 2377-9292 | Volume: 1, Issue: 1
Submission: 24 August 2014 | Accepted: 31 October 2014 | Published: 1 November 2014
Abstract
Microarray technology has become a very popular tool in the realm of current molecular biology tools, and combined with the increasing knowledge and accuracy gained by advances in human genome sequencing, this technique is an ideal candidate for performing multiplex high-throughput genetic analysis at a relatively low cost. DNA microarrays are widely used for genotyping and gene expression thus aiding molecular diagnosis. As with any evolving technique, one needs to be careful while interpreting the data so as not to overestimate or underestimate the signals. In this review we discuss the evolution of microarray as a molecular biology tool, the strengths and limitations of most commonly used microarray techniques, and finally we hope to provide the reader with a look into the future of microarray in clinical diagnosis.Keywords
Microarray, DNA, RNA, Protein, Software, AlgorithmIntroduction
Microarray technology has already become a common technology used in modern research laboratories all over the world. It was derived from Southern blotting and as the name suggests, microarray is an array (collection) of microscopic elements such as DNA, RNA, or proteins which can be probed with target molecules to generate data based on the gene expression in the cell milieu which could have far-reaching implications for medical diagnosis [1]. This technology also allows scientists to study the genome sequence and analyze the structure and function of thousands of genes at a time to help understand gene expression at any given developmental/pathological stage [2].Although Microarray technology was introduced almost 20 years ago, to analyze the expression levels of thousands of genes in a single experiment and is well established now, the analyses of known sequence variants on microarray have been very limited [3]. Although there are numerous articles available on microarray gene expression technology, studies describing the analysis of predefined human single nucleotide polymorphisms (SNPs) or disease-causing mutations on microarrays are very less. For instance, a quick search on PubMed Central (PMC) database with “microarray” keyword had hit about 94000 articles of which 2200 papers were review articles discussing more or less the same concepts and designs and not many on disease-associations.
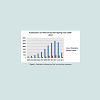
A search for papers that contain the words “microarray genotyping” from PubMed yielded a total of 786 papers from 2004-2014. The diagram below shows the number of published papers using microarray technology and the review articles for the decade since 2003.
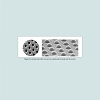
The human genome is expected to have more than 10 million nucleotide positions that have common (defined as >1%) variations between individuals in a population [4]. Genotyping is a prevailing innovative method used to identify the associations between genetic variations and normal/abnormal phenotypes, especially in clinical and basic research laboratories. Allele frequencies and risk nature of the alleles differ from population to population and genotyping by microarray proves a cost-effective method to determine such differences [5,6]. For many years, multiplex PCR has been the method of choice. The same concept was applied to microarray for genotyping at the resolution of single nucleotides on a genome-wide scale. The genotyping microarray displays hundreds, or even thousands of specific oligonucleotide probes accurately located on a small-format solid support to detect SNP loci in target DNA (Figure 1). It generally uses linear single-stranded probes for capturing targets in hybridization reactions. The first genotyping system was developed using allele-specific oligonucleotides placed as arrays as templates for primer extension-based genotyping [7]. This is the most common method used in microarray format [8].
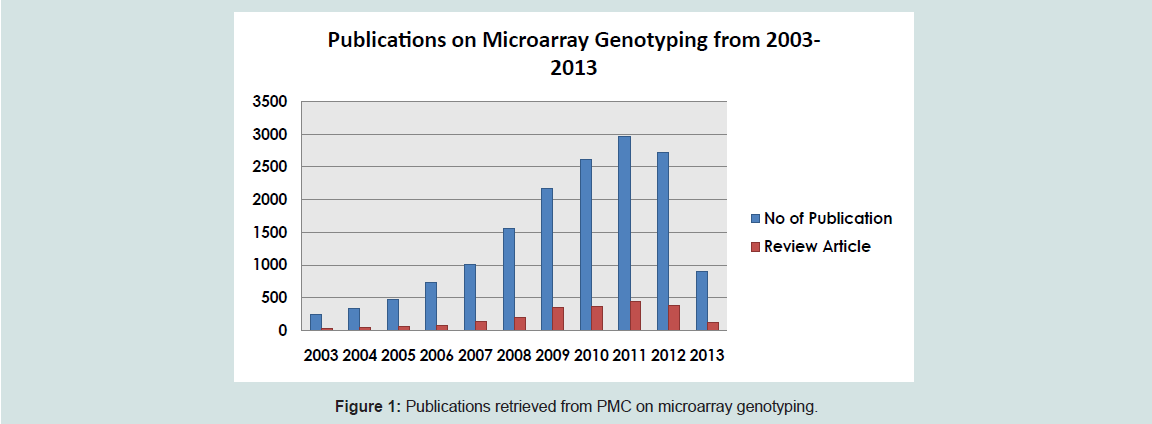
Figure 1: Publications retrieved from PMC on microarray genotyping.
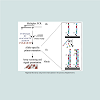
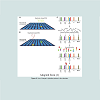
Another approach by Pastinen et al. is called the enzyme assisted method which utilizes allele-specific primers with reverse transcriptase (RT) enzyme. The diagram below illustrates how this method works.
Although many articles on microarray talk of design strategies and algorithms used to analyze the data, very few speak of the problems that could bias the results coming from this sophisticated technology, ranging from manufacturing level problems, dye incorporation problems, variability in image processing, error in genotype calls, etc.
In this review we have tried to list out a few problems we have faced and that we anticipate, from a research perspective.
Fabrication Technologies
Microarray fabrication technologies differ from one another depending on the efficiency of uniformed deposition, dense arrays of small droplets of probe molecules, costs, and customization requirements.Printed microarrayThe first microarrays were printed arrays in which the probes are printed or spotted onto the microarray surface, usually a glassmicroscope slide [1]. It is further classified into noncontact and contact printing depending on spot formation technique (Figure 2).
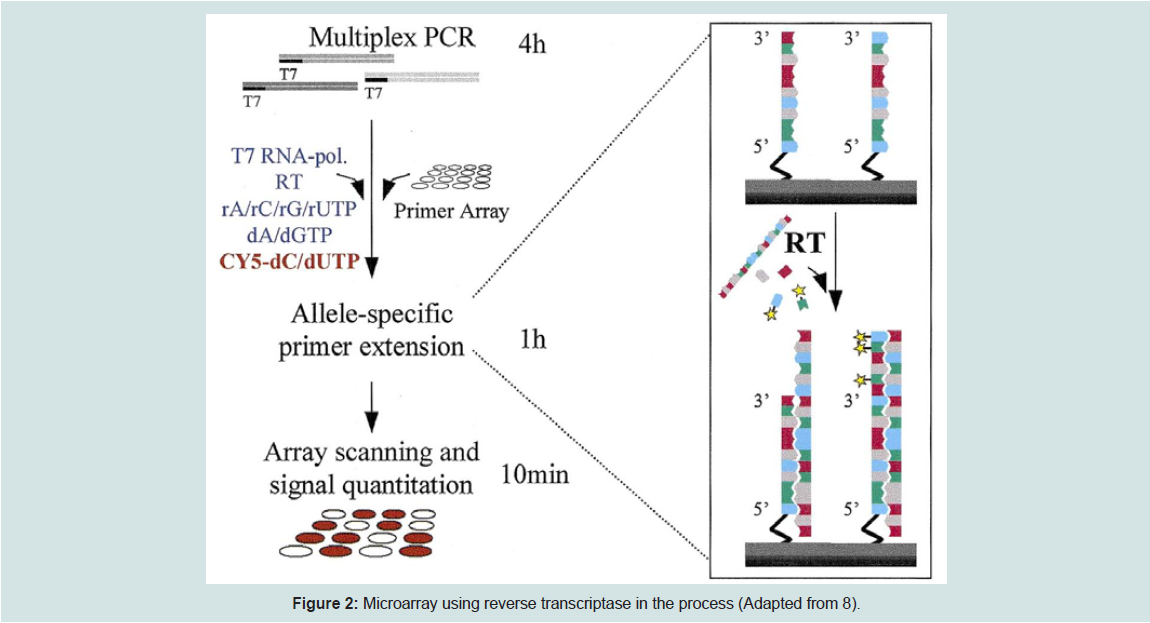
Figure 2: Microarray using reverse transcriptase in the process (Adapted from 8)
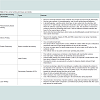
a) Contact Printing: Solid pins, capillary tubes, split-pins, and micro-spotting pins or “ink stamps” are known contact printing devices to deliver sample spots onto the solid surface [9]. Contact printing functions by dipping each print pin into the concentrated DNA solution and the droplet is subsequently deposited on the microarray surface or substrate. The table below explains all the contact printing techniques and devices in detail [10] (Table 1).
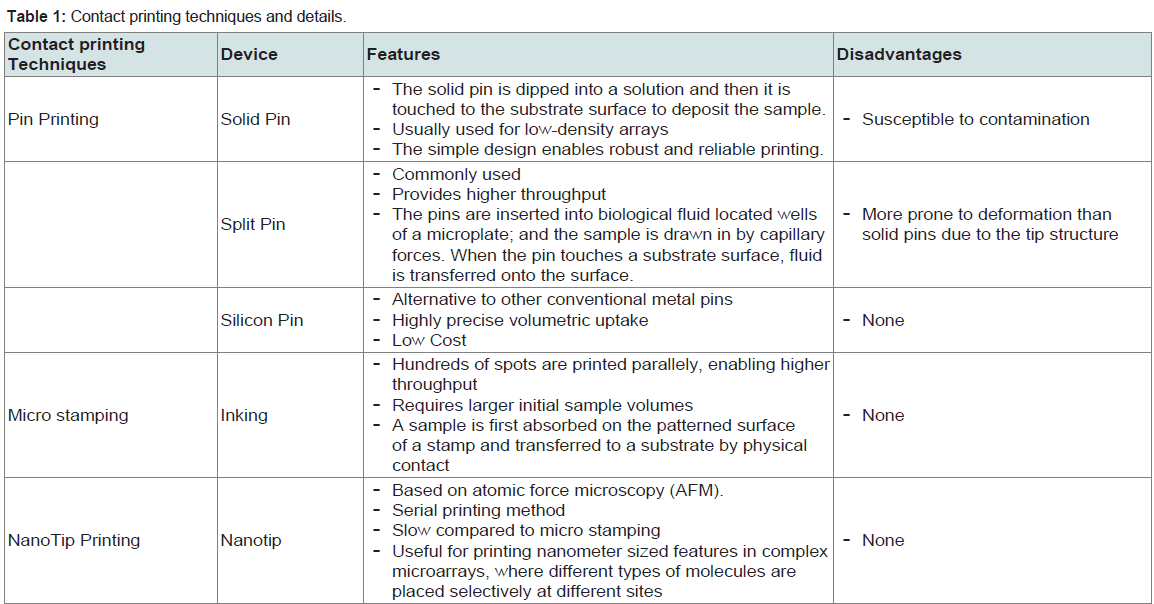
Table 1: Contact printing techniques and details
b) Non-Contact Printing: Non-contact printing involves no physical contact between the device and the substrate. The table briefly explains each technique [8]. The non-contact printing is a better choice compared to contact printing because it reduces contamination and has higher throughput (Table 2).
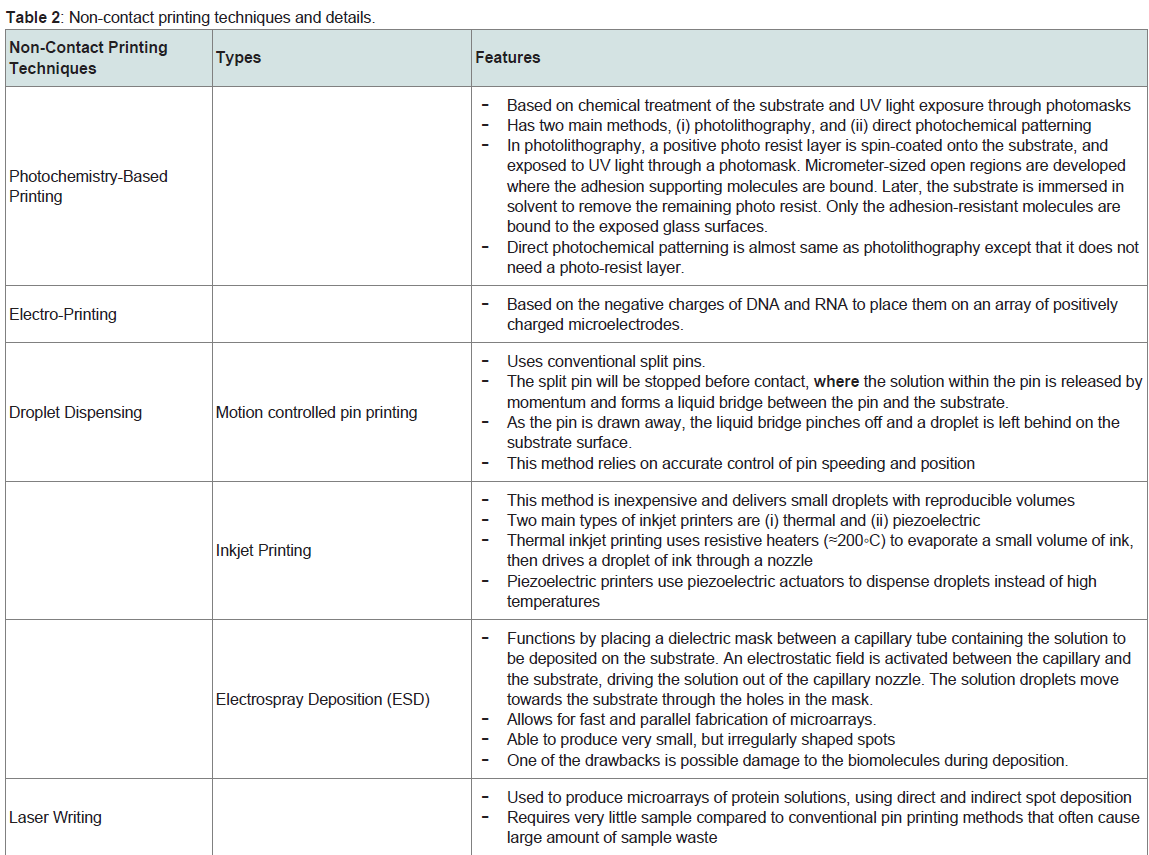
Table 2: Non-contact printing techniques and details
In-situ synthesis
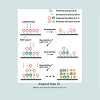
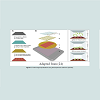
For in situ synthesis methods, the oligonucleotides are built up base-by-base on the surface of the array. Generally in situ-synthesized probes are short (20 to 25 bp), thus multiple probes are added to one target to improve sensitivity, specificity, and statistical accuracy [1]. The concept of in-situ synthesized microarray is explained below [11] (Figure 3).
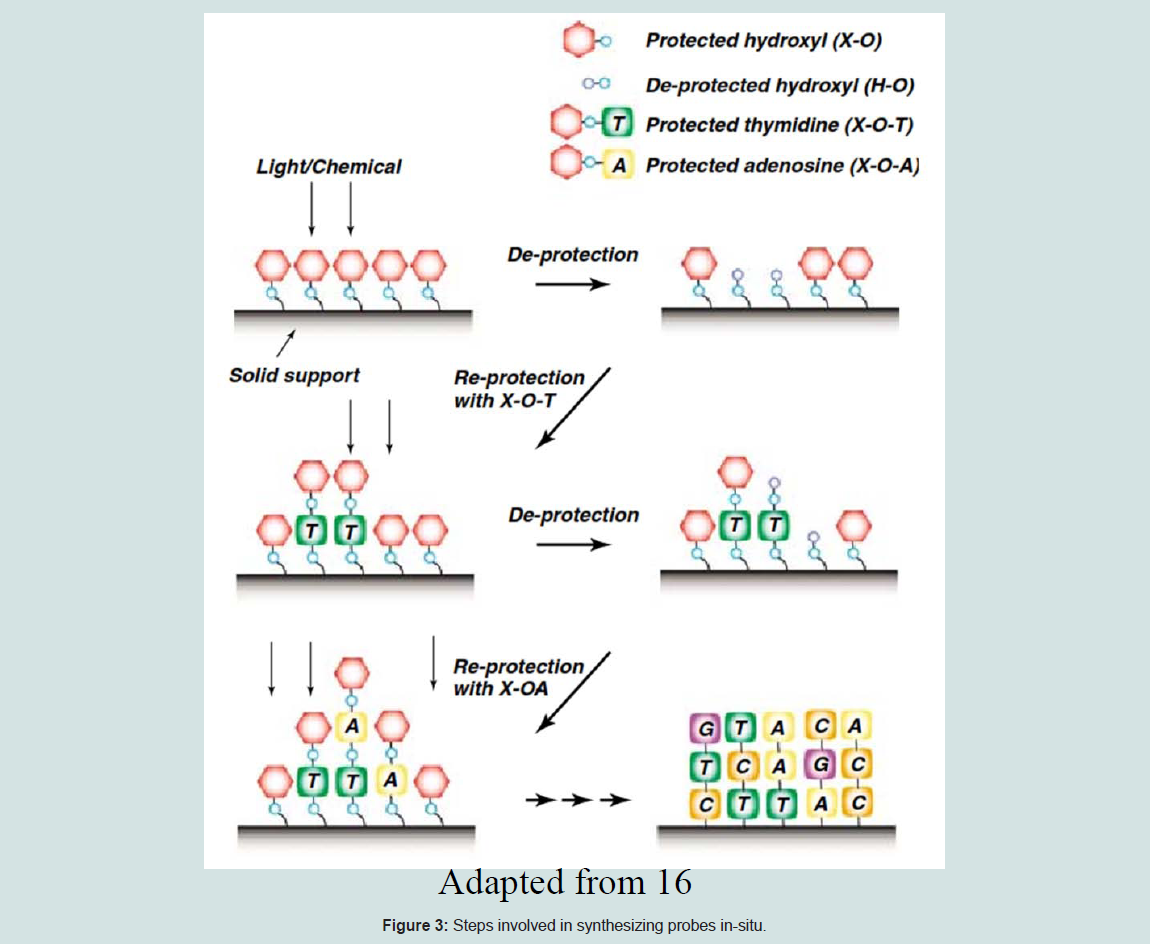
Figure 3: Steps involved in synthesizing probes in-situ
The 5’ hydroxyl group of the sugar molecule of the last nucleotide will be attached to the phosphate group of the next nucleotide by a covalent reaction.
i) To prevent the addition of more than one base during each round of synthesis, each nucleotide will be added to the oligonucleotide on the glass with a protective group on 5’ position. [ α-methyl-2-nitropiperonyl) oxy] carbonyl (MeNPOC; 8,9) or dimethoxybenzoincarbonate (DMBOC; 10]
ii) The protective group will then be converted to a hydroxyl group either by acid or UV light before the subsequent round of synthesis.
iii) The deprotected hydroxyl is protected again with the 50 other protected derivative of the nucleotide of interests.
iv) The protection and deprotection process will be repeated until the preferred oligonucleotides are produced. The figure below depicts the concept of in-situ synthesized microarray as explained above. There are three main technologies for making in-situ synthesized arrays based on the protective group conversion method. (a) Photolithographic synthesis used by Affymetrix, suitable for making high density microarrays [12], (b) Maskless Array Synthesis Technology used by Nimblegen and Febit [11] and (c) inkjet technology used by Rosetta, Agilent, and Oxford Gene Technology [11].
a) Photolithographic synthesis: Here, oligonucleotides are synthesized onto a glass surface due to its optical features and inactivity towards solvents which may be used during the assay [13]. This method of photolithography is adapted from the semiconductor industry for manufacturing silicon chips [14]. The Affymetrix platform uses a combination of photolithography and combinatorial chemistry technology to directly synthesize 25 mer oligonucleotides on a glass surface. It uses the exposure of light patterns to physically mask the synthesis surface. Affymetrix technology is very suitable for manufacturing large numbers of “standard” arrays that can be commercially used [10].
b) Maskless Array Synthesis Technology: Maskless technology uses a digital micro mirror array to form virtual masks to synthesize light-directed high-resolution oligonucleotide microarrays. Each virtual computer-created mask will send the image to a device called the Digital Micro mirror Device (DMD). The Maskless Array Synthesizer (MAS) creates a UV image of the virtual mask on the active surface of the glass substrate, which is mounted in a flow cell reaction chamber, connected to a DNA synthesizer. A Kohler illumination system is used to illuminate the digital micro mirror array with UV light. The image pattern is produced on the digital micro mirror array on the active surface of the glass substrate using a reflective offner relay 1:1 imaging system with a numerical aperture of 0.08 [15]. NimbleGen uses a similar maskless technology as described above. This technology combines photo-deposition chemistry with digital light projection to shorten the array fabrication. It can be costly, especially when the oligos are long and involves large number of features per array [16].
c) Inkjet technology: Instead of using light to convert the protective group, inkjet array sequences are synthesized chemically in situ on the surface of the chip. In 1996, the first proof-of-principle oligonucleotide synthesis using the inkjet mechanism was demonstrated with micro fabricated piezoelectric inkjet pumps. This method seems to be less efficient in making large numbers of identical arrays compared to other methods [17].
High-density bead arrays
High-density bead arrays work in a similar way as printed and in-situ hybridized microarrays. The only defined differences between the high-density bead arrays and previously discussed fabrication technology are that, the individual probes for printed and in-situ hybridized microarrays are placed at known locations on the substratewhereas the probes for high-density microarray are placed randomly. The idea of high-density bead array technology was tailored from randomly assembled arrays of beads in wells [18]. This approach uses the optical imaging fiber and rapid signal processing technology. They are very popular for many high-throughput biological assays, such as genotyping and DNA sequencing. These arrays function by attaching specific nucleic acid sequences to microspheres that fill each well. Initially, a high-density array of wells is created by using the optical fiber substrate to build wells to be loaded with individual beads. The optical fiber array is made of thousands of individual glass or plastics fibers. These individual fibers are bundled, melted, and pulled to form one whole substrate. All the individual fibers in the array remain in their relative position during this process. Later, the fiber cores are selectively fixed when a polished array is placed into an acid solution. This process creates an array of micro wells at one end of the fiber [19].
Each bead will contain the oligonucleotide probes and is stably coupled with the wells under standard hybridization conditions. Shows the sample of imprinted fiber cores and imprinted fiber cores with the coupled beads.
Electronic microarrays
Similar to high-density bead arrays, electronic microarrays are a unique platform for genomic and proteomic expression assays. It is the best-suited method for gene expression profiling of a preferred set of target genes from multiple sample sources. An electronic microarray is made of about 100 microelectrode test sites, where a large volume sample solution with concentrated nucleic acids is transported to the defined test sites within the array using the electronic field control. This process will promote the hybridizationof targets with the complementary probes [20]. An electric field is created at the test site, so the hybridization process only occurs at the electronically activated sites. This method is based on the concept that generally most biological molecules have a natural positive or negative charge and will move to the oppositely charged sites when electricity is applied [21]. Sequential electronic hybridizations are used to observe the same set of target genes from different sample resources. This method is very fast and hybridization assays can be completed in minutes [20]. The figure below shows how the electronic microarray functions.
Suspension microarrays
Suspension arrays are widely used in nucleic acid detection and genotyping. It is the alternative method to planar DNA microarrays where the DNA probes are fixed to the encoded microsphere beads instead of glass microarray slides. This technology is developed based on three important concepts; 1) direct DNA hybridization, 2) competitive DNA hybridization, and 3) solution-based chemistry with microsphere capture [22]. They are made of a detection platform and microscopic polystyrene spheres or microspheres beads [23]. This method is different from high-density bead array because the wells here are created on a silicon wafer covered with a gold film that acts as the primary electrode and a counter electrode made of a glass coverslip covered with indium-tin oxide (ITO). A flow cell is formed by stacking a thin adhesive silicone gasket that contains a cutout of a flow channel in between the silicon wafer and the glass coverslip. A series of low voltage electrical currents are applied to the electrodes and the negatively charged, streptavidin-coated microbeads are pushed into the wells via electrophoresis. Through electrochemically induced binding between the gold and streptavidin, the microbeads will be permanently detained within the wells. This method is very fast and more efficient compared to the optical fiber method [24]. Suspension microarray is the most suitable fabrication technology for multiplexing of multiple gene polymorphisms or antibodies using different microsphere sets based on color, like red (658 nm emission) and infrared (712 nm emission) fluorochromes at different concentrations. The difference in the red-to-infrared ratio between every bead provides a unique spectral address. All the coupled individual microspheres will be separated from specific probes and the mixture of microspheres will be used to examine the extracted and amplified nucleic acids. Next, the probe-target DNA hybridization will be completed using bench-top flow cytometry and the fluorescent reporter will be used to identify the probe and target DNA. Both the red and infrared fluorochromes will be saturated in the microspheres when a 635 nm laser is released on a single-file microsphere suspension to categorize the beads so that the identity of the probe-target can be easily analyzed [1].The (Figures 4,5,6,7) below depict the overall process of the suspension microarray fabrication method and its assembly.
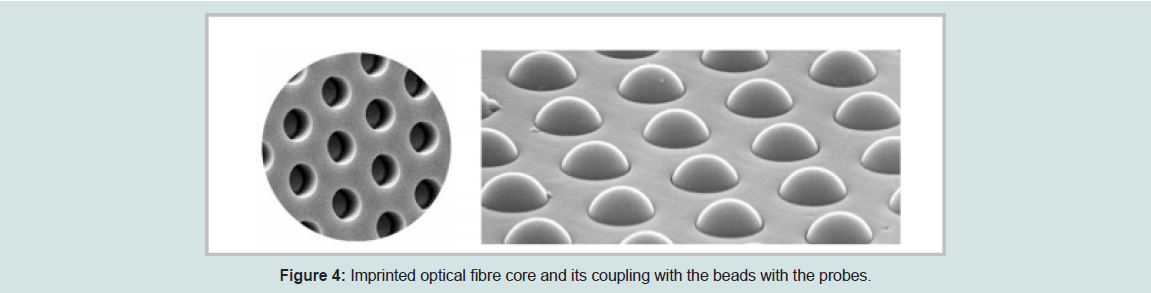
Figure 4: Imprinted optical fibre core and its coupling with the beads with the probes
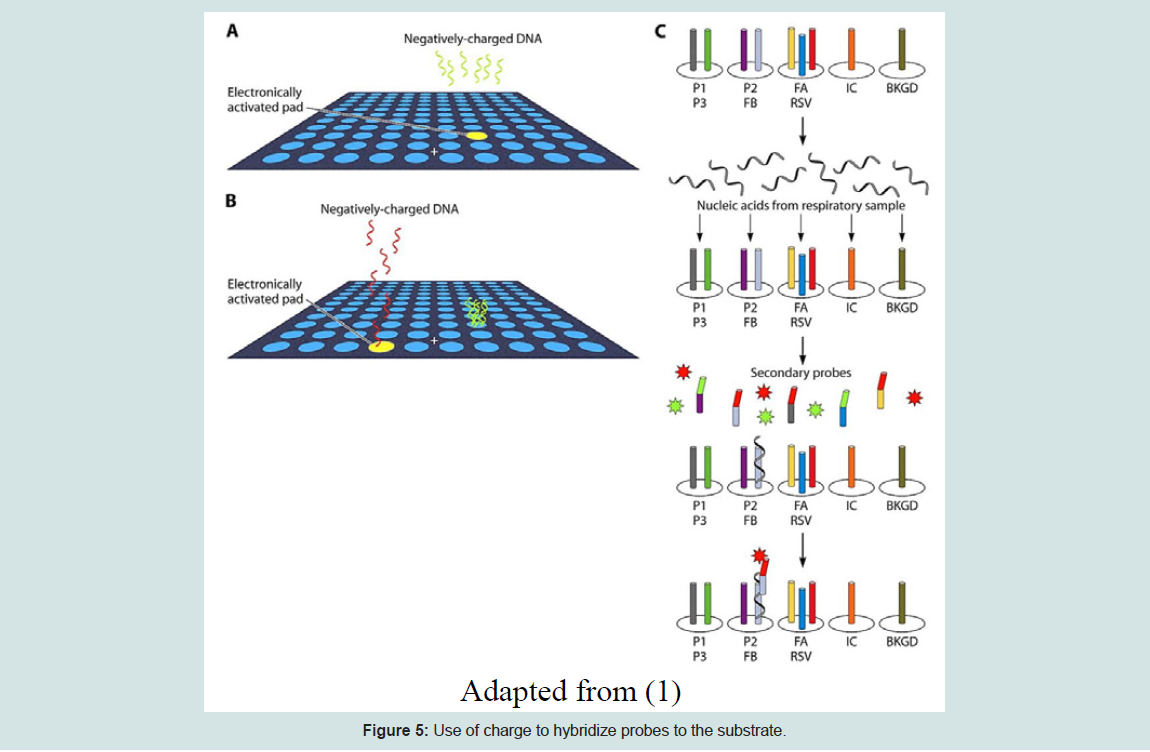
Figure 5: Use of charge to hybridize probes to the substrate
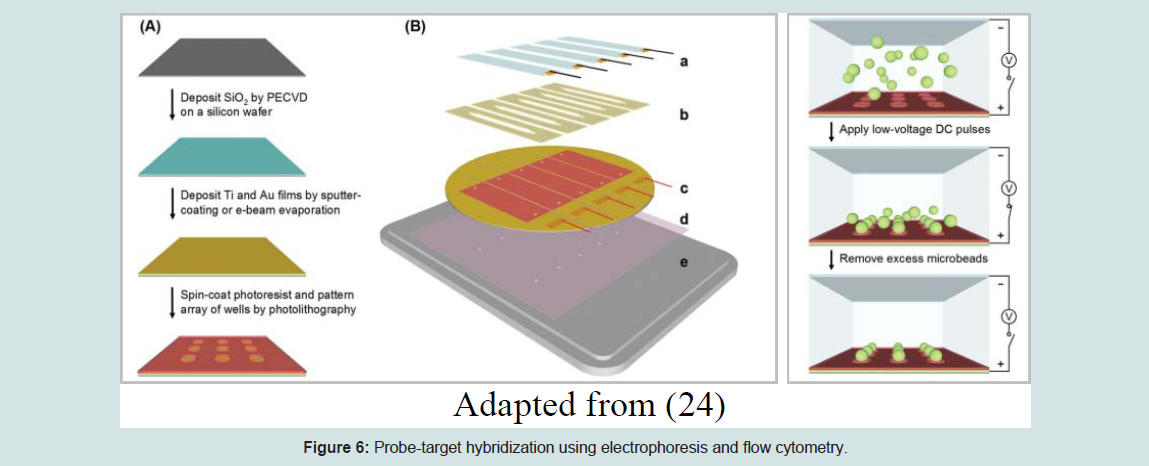
Figure 6: Probe-target hybridization using electrophoresis and flow cytometry
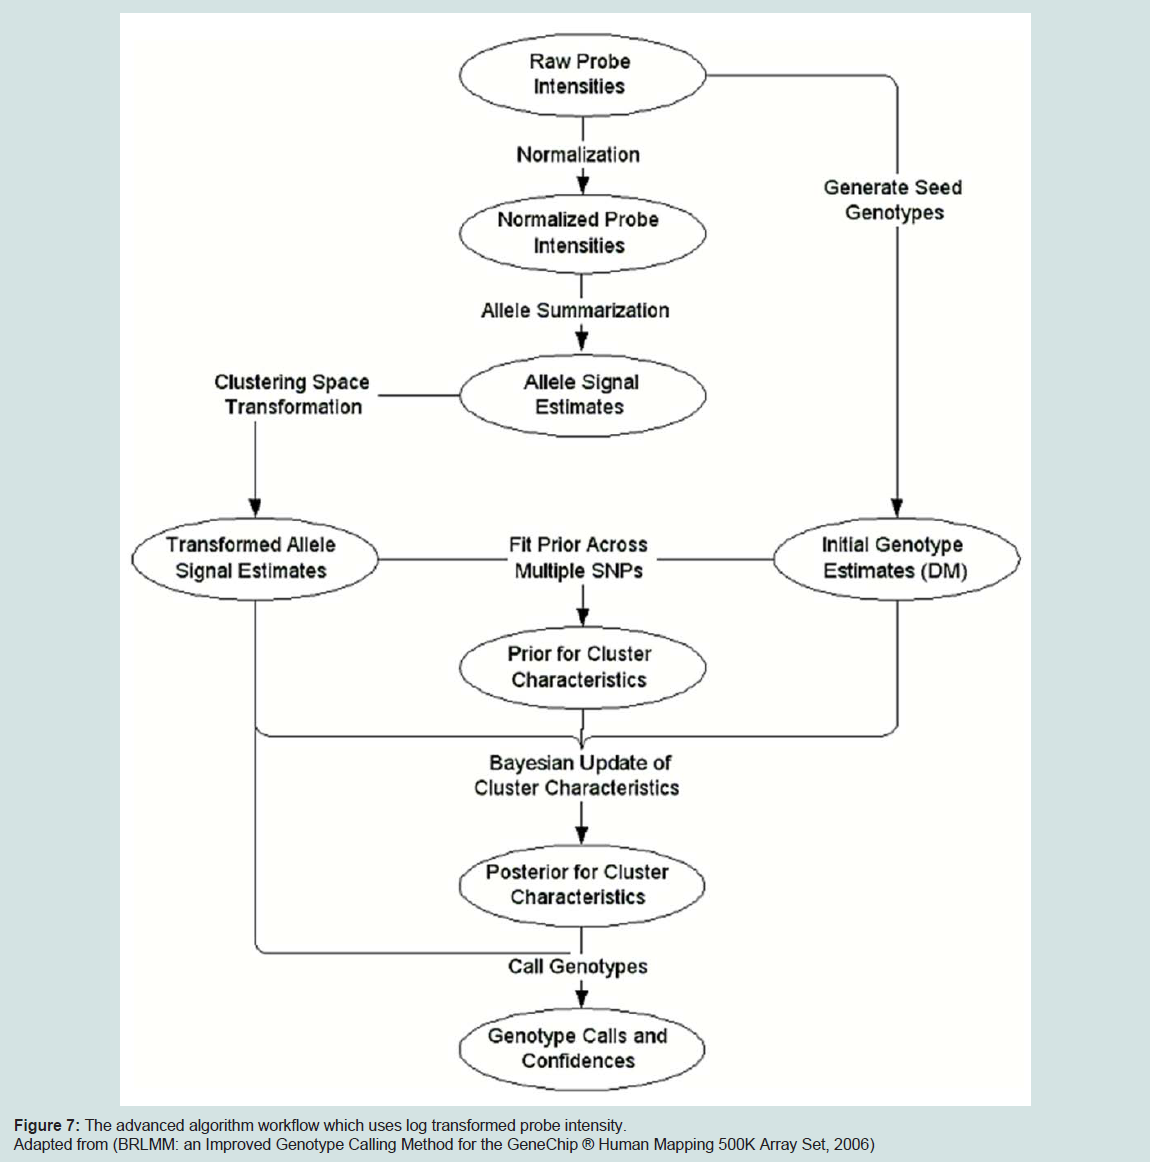
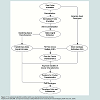
Figure 7: The advanced algorithm workflow which uses log transformed probe intensity
In-situ synthesized microarray technology uses a different approach compared to printed microarray, in such that the probes are synthesized directly on the microarray. The probes are covalently attached either by using light or chemical. This technology is extremely high-density and the first to be used commercially. As this technology uses short probes compared to printed microarray, both specificity and sensitivity is very high. The contamination level using this fabrication technology is low. Compared to printed microarray, in-situ synthesized microarray is more expensive. It has been upgraded to fit different purposes for different types of probes. On top of that, improvements in speed, sample, preparation, and systems integration were the also considered and modified from one to another. As more improvements took place, the technology became more advanced with lower cost. Considering all the different fabrication technologies, the best approaches are classified depending on the study type.
Data Analysis
Genotyping microarrays help the biologists to identify the functions of different genes and/or construct complex gene interaction networks. A vast amount of data is produced through these experiments and advanced algorithms with integrated software tools are needed to perform reliable and efficient data analysis.There are many softwares and tools used in microarray genotyping data analysis. In this paper, we focused on well-known microarray platforms like Affymetrix and Illumina. Although the Affymetrix and Illumina SNP arrays function using different methodologies, they have several aspects in common. Both these platforms are based on the biochemical principle that nucleotide bases bind to their complementary partners specifically, such that adenine binds to thymine and cytosine binds to guanine. Each probe in the array is designed to bind to a target DNA and its hybridization is measured by the signal intensity. The signal intensity differs based on the amountof target DNA in the sample and the affinity between the target and probe. Detailed processing and analysis of these raw intensity measures yield the SNP genotype inferences [25].
Affymetrix Platform
Affymetrix was the first to commercially produce SNP arrays, starting with 10,000 to 100,000 to 500,000, and now, there are arrays to characterize almost one million SNPs. The best computational algorithm is selected based on the number of arrays. For 10 k array, a Modified Partitioning Around Medoids (MPAM)- based algorithm was used. MPAM is a statistical methodology used by computational biologists. MPAM relies on examining probe intensities across multiple arrays. Intensity normalization is the most crucial step since it corrects the technological biases in probe intensity by homogenizing. The algorithm is programmed so that it replaces the nth highest probe intensity value of each array with the mean of the nth highest probe intensity values across all arrays toguarantee that an array’s highest intensity probe has the same value across arrays [25]. There were a few problems with this algorithm. Correct calls for SNPs with missing genotype groups or low minor allele frequency may be inaccurate and large sample sizes were needed for clustering purposes [26].For the next version with 100 k array, a different algorithm called the Dynamic Model (DM) algorithm was selected. This algorithm functions by performing a SNP-level statistical aggregation to provide a high-quality genotype call using a probe-level DM-based likelihood [27]. The probes from the quartets are calculated using log likelihood for each model, and then by subtracting the log likelihood associated with the model from the largest log likelihood of the other three models. Finally, four scores for each probe quartet will be computed. A Wilcoxon signed rank test is performed against the null hypothesis of median score (across quartets) equal to zero for each model and p-values are calculated where a significant p-value gives a corresponding genotype call [25]. A limitation of this algorithm is that it displays a higher misclassification rate for heterozygous genotypes than for homozygous genotypes. To overcome this issue, the multichip genotype calling algorithm RLMM was developed. It was found that RLMM achieved a higher call rate compared to DM [28].
With the 500 k array version, Affymetrix decided to use another approach called the Bayesian Robust Linear Model with Mahalanobis distance classifier (BRLMM) which was derived from RLMM. This model uses the log-transformed probe intensity. BRLMM uses DM calls as initial guesses on genotyping calls and uses these to define distribution of genotype regions. The genotype regions are then recalibrated using a Bayesian approach. The main problem using BRLMM algorithm is that it can only be run in multiple-chip mode where the instant performance metric provided by the DM call rate is needed to be applied on each chip to decide in real-time if a sample needs to be rehybridized. The diagram below depicts the BRLMM algorithm workflow.
Since, BRLMM has some limitations; another algorithm was proposed called the Corrected Robust Linear Model with Maximum Likelihood Distance (CRLMM). This algorithm corrects the batch effects from BRLMM and shows high genotyping accuracy and stability. CRLMM requires the required HapMap training data and previous information on genotype calls. CRLMM is able to genotypes all the calls. The CRLMM algorithm can be used to identify poor quality and low rates chips. This method functions both between and within-samples method for modeling. A major problem using CRLMM is that this algorithm cannot be utilized when HapMap training data is not available.
Illumina
Illumina has developed its own software to genotype SNPs on the Bead Chip array called GenCall and is implemented within the Genome Studio software. This algorithm automatically clusters, calls genotypes, and assigns confidence scores for input data sets. In this genotyping analysis, the data from each array is normalized by using clustering algorithm.A GenCall score, or the given confidence level, is assigned to each call. A GenCall only has three clusters with three genotypes: AA, AB, and BB. Artificial Neural Networks (ANN) approach is used in the clustering and scoring processes. ANN is an application which requires training sets. The GenCall uses the ANN model to predict the location and shape of the undefined clusters when clusters of less than three well-defined genotypes are observed.
Another commonly used genotype-calling algorithm for Illumina is known as Illuminus. Unlike GenCall, Illuminus does not require training sets. This algorithm uses an unsupervised clustering method based on a mixture model of Student’s t-distributions to remove the need for a called training set [29]. This algorithm is not suitable for low frequency SNPs and/or small sample sizes, which result in poorly defined clusters because this can create inaccurate genotype calls due to the small number of rare allele observations. A study by Teo et al. explained the most suitable genotype calling algorithms in Illumina Bead Array platform are dependent on the approach [30]. For example; Illuminus is more suitable for larger sample sizes (≥50).
The most recent approach by Illumina uses CRLMM, the same algorithm as Affymetrix. As discussed above, this algorithm provides genotype calls and quality scores for all polymorphic markers through a hierarchical model [31]. But the problem with this algorithm is that the dependency on training data sets to be calibrated with model parameters is not applicable for customized genotyping or genotyping in non-model organisms [32]. The above discussed algorithms have different advantages and disadvantages. The algorithm used by Affymetrix changes to fulfill the limitations from one version to the next. The gene calls are improved and the accuracy level has also increased throughout the different version of arrays. By comparing the performance of Illuminus against GenCall it is found that Illuminus made more concordant calls and resulted in a smaller number of SNPs which are excluded on the basis of per- SNP call rates.
Current Limitations with Microarray Technology
Although this technology offers tremendous advantages in terms of efficient genetic testing, it still has its flaws.1) Cost: The cost of the basic instrument and reagents needed to carry out microarray still remains prohibitive. Although the cost of reagents has come down to some extent, it is still not affordable by major labs across the globe.
2) Reliability of data: There are many data analysis issues commonly encountered during microarray experiments which are handled differently by different users depending on his or her computing experience which might bring in bias between results generated from experiments of the same nature. Microarray measurements strive to strike a balance among many competing processes. However, many factors can shift these processes noticeably; for example, the ratio of off-target hybridization to true signal from each probe depends on the relation between the hybridization temperature, ionic strength, and the thermodynamic characteristics of the probe. Gardener et al have used optimal probe design strategies and algorithms to get better call and concordance rates higher than reported by Affymetrix SNP arrays [33]. Quality control measures may be carried out very diligently by the user but technical faults or differences in technique peculiar to one array can give varying results, such as particles of dust or scratches on a chip, air bubbles in the hybridization, or wipe marks (or even fingerprints !) on the glass cover slip may not be visible to the naked eye but can make a big difference to data quality. Different scanner settings can produce different results which may be overlooked by the user. Furthermore, there is a great deal of open-source and commercial software for microarrays, which puts a researcher in a big dilemma as to which one is the optimal one to use [34].
3) Cumbersome data processing: Computing knowledge is an essential prerequisite if sense is to be made out of the large quantity of data generated by microarray experiments. Normalization is a fundamental step in data analysis and should be considered carefully amongst several methods that have been developed and are commonly reviewed in the primary literature. The purpose of normalization is to remove any biases within a slide or between slides. Such biases can be due to the unequal incorporation of dye between samples, variation in the amount of DNA printed on the array, the washing process, or variation in the ability of the scanner to detect each dye.
All normalization procedures inevitably change data and can introduce artifacts, whereas over-fitting the data can remove true biological signals. There is not one correct approach to normalization and it may be appropriate to compare the results of different approaches. Between-array normalization adjusts for differences in the intensity level of each slide averaged across all spots. Array intensities vary due to biological and technical factors (especially laser settings during scanning) so it is always important to ensure that the mean transcript abundance for each array and channel is approximately the same.
In labs where an experienced bioinformatician is not available, the lab technician or researcher usually handles image quantification using the default settings of the machine, which can have noticeable impact on the noise level of the subsequent estimates. A study performed in California showed significant differences among results from different quantification programs applied to eight arrays that compared the same two samples. Several different settings were used on most programs. Since ratios should be identical the standard deviation is an inverse measure of quality.
The first algorithms for analyzing genotyping data were created keeping the Affymetrix method in mind due to its very high degree of accuracy. However, the Affymetrix platform uses match and mismatch probes which are not used by other microarray platform manufacturers. This limits the universal use of these algorithms. Affymetrix arrays use only a small number of SNPs which may not necessarily match those used by other study groups. Universal algorithms that can be used for all platforms irrespective of the technology inherent to that machine are needed.
4) Legal and ethical issues: Microarray technology has the capacity to detect absence of heterozygosity. Possible incest cases are easily identified by an absence of heterozygosity. “In most instances, an infant receives roughly half of his or her genes from the mother and half from the father. This is called heterozygosity. In the case of incest, family members, who already share much of their genetic code, each contribute to the genetic material of a child. This will result in absence of heterozygosity in the genes of that child. In other words, children conceived through incest have large blocks of DNA in which genes inherited from the mother and the father are identical.” In some cases, these regions can account for as much as one-fourth of the genome. (http://www.sciencedaily.com/releases/2011/02/110210202052.htm) These findings have social implications as well. Law enforcement requires a doctor to reveal if a loss of heterozygosity is present if the pregnancy is suspected to be the result of abuse.
Widespread genetic screening could be used for other discriminatory purposes against individuals at work place or during matrimony. Similar concern arises for health or life insurance, or employment, based on information about them discovered through genetic testing. Health information is normally considered confidential between healthcare providers and patients, though other parties such as insurance companies and even employers may obtain some of an individual’s health information in the course of processing payments, insurance, and job applications.
On one hand, an employer may have an interest in certain types of genetic tests for employees if the employees with particular genetic traits would likely be harmed by workplace exposure to certain conditions. If the employee has a genetic predisposition to some type of cancer, for instance, the employer might argue that to protect their employees, they should screen individuals to exclude him or her from certain chemicals or radiation, which may lead them to be at a greater risk for cancer due to their genetics.
New gene-based tests that map out a person’s entire genetic code can help explain why a child has birth defects or developmental delays, but they could also expose some dark family secrets.
5) Triallelic/Tetraallelic issues: Some loci have SNPs that are polymorphic, with three or four different allele combinations existing instead of the normal biallelic loci. In such instances, certain microarray manufacturers are unable to design primers to accurately discriminate the alleles thus limiting its ability in genetic screening on a broad population. In one of our experiments as the manufacturer couldn’t design a third allelic probe, we did sequencing and discovered a new variant in our cohort study [35].
Summary
Microarray technology has evolved over the last ten to twenty years following extensive research and discoveries. It is an excellent tool for screening, diagnosis or prognosis of diseases. However it is not as simple as it sounds. The technology has two main facets-one is the probe and its hybridization principle and second is the genotype calling algorithm. Often times, the normalization of raw data will yield different results by different users.The algorithms too have been swiftly undergoing evolutionary changes, with the end user taking the report in full faith. However each platform has its own pros and cons. Very often the researcher has to use SNPs which are polymorphic and some of the platforms are built in such a way that triallelic or tetra-allelic SNPs cannot be used in the chips.
The cost of the technology also has been soaring making it difficult for most of the labs to acquire this despite the fact that microarray is a technology suitable for discovery mode where many SNPs can be probed simultaneously.
References
- Miller MB, Tang YW (2009) Basic concepts of microarrays and potential applications in clinical microbiology. Clin microbiol Rev 22: 611–633.
- Huang HL, Huang IY, Lin CY, Huang MC (2013) Effective Strategies for Identifying Novel Genetic Markers Based on DNA Polymorphisms. J Mol Biomark Diagn 4: 156.
- Edward R Dougherty (2001) Small sample issues for microarray-based classification. Comp Funct Genom 2: 28–34.
- Syvänen AC (2005) Toward genome-wide SNP genotyping. Nat Genet 37 Suppl: S5–10.
- Livy Alex, Chahil JK, Lye SH, Bagali P, Ler LW (2012) Differences in allele frequencies of familial hypercholesterolemia susceptibility SNPs in the Malaysian population. J Hum Genet 57: 358-362.
- Lye SH, Chahil JK, Bagali P, Alex L,Vadivelu J, et al. (2013) Genetic Polymorphisms in LDLR, APOB, PCSK9 and Other Lipid Related Genes Associated with Familial Hypercholesterolemia in Malaysia. PLoS ONE 8: e60729.
- Ellis MC (2000) “Spot-On” SNP Genotyping. Genome Res 10: 895–897.
- Pastinen T, Raitio M, Lindroos K, Tainola P, Peltonen L, et al. (2000) A system for specific, high-throughput genotyping by allele-specific primer extension on microarrays. Genome Res 10: 1031–1042.
- Weibel C (2002) “The Spotting AcceleratorTM” Customizable Head Assembly For Advanced Microarraying. Journal of the Association for Laboratory Automation 7: 89–94.
- Barbulovic-Nad, Lucente M, Sun Y, Zhang M, Wheeler AR, et al. (2006) Bio-microarray fabrication techniques--a review. Crit rev Biotechnol 26: 237–259.
- Stekel D (2003) Microarrays : Making Them and Using Them. Microarray Bioinformatics,Cambridge University Press 1: 1-10.
- Srivannavit O, Gulari, M Hua Z, Gao X, Zhou X, et al. (2004) Design and fabrication of microwell array chips for a solution-based, photogenerated acid-catalyzed parallel oligonuclotide DNA synthesis. Sens Actuators A Physical 116: 150–160.
- Beier M, Hoheisel JD (2000) Production by quantitative photolithographic synthesis of individually quality checked DNA microarrays. Nucleic acids Res 28: E11.
- Zhou J, Thompson DK (2004) Microarray Technology and applications in environemental 82: 183–270.
- Singh-Gasson, Green RD, Yue Y, Nelson C, BlattnerF, et al. (1999) Maskless fabrication of light-directed oligonucleotide microarrays using a digital micromirror array. Nat biotechnol 17: 974–978.
- Shiu SH, Borevitz JO (2008) The next generation of microarray research: applications in evolutionary and ecological genomics. Heredity 100: 141–149.
- Schena M, Heller RA, Theriault TP, Konrad K, Lachenmeier E, et al. (1998). Microarrays: biotechnology’s discovery platform for functional genomics. Trends Biotechnol 16: 301–306.
- KL Michael, LC Taylor, SL Schultz, DR Walt (1998) Randomly ordered addressable high-density optical sensor arrays. Anal Chem 70: 1242-1248.
- Walt D (2006) Fiber optic array biosensors. Biotechniques 41: 529-531.
- Weidenhammer E M (2002) Multiplexed, targeted gene expression profiling and genetic analysis on electronic microarrays. Clin Chem 48: 1873–1882.
- Huang Y, Hodko D, Smalko D, Lidgard G (2007) Electronic Microarray Technology and Applications in Genomics and Proteomics. BioMEMS and Biomedical Nanotechnology 2: 3-21.
- Dorrell N, Mangan JA, Laing K, Hinds J, Linton D, et al. (2001) Whole genome comparison of Campylobacter jejuni human isolates using a low-cost microarray reveals extensive genetic diversity. Genome Res 11: 1706–1715.
- Wang Y, Zou M, Yao P, Xu Y (2013) Multiplexing-Capable Immunobiosensor Based on Competitive Immunoassay 9: 187-199.
- Barbee KD, Hsiao AP, Heller MJ, Huang (2009) Electric field directed assembly of high-density microbead arrays. Lab chip 9: 3268–3274.
- LaFramboise T (2009) Single nucleotide polymorphism arrays: a decade of biological, computational and technological advances. Nucleic acids Res 37: 4181–4193.
- Rabbee N, Speed TP (2006) A genotype calling algorithm for affymetrix SNP arrays. Bioinformatics 22: 7–12.
- Di X, Matsuzaki H, Webster T, Hubbell E, Liu G, et al. (2005) Dynamic model based algorithms for screening and genotyping over 100 K SNPs on oligonucleotide microarrays. Bioinformatics 21: 1958–1963.
- Hong H, Su Z, Ge W, Shi L, Perkins R, et al. (2008) Assessing batch effects of genotype calling algorithm BRLMM for the Affymetrix GeneChip Human Mapping 500 K array set using 270 HapMap samples. BMC Bioinformatics 9: S17.
- Shah TS, Liu JZ, Floyd JB, Morris J, Wirth N, et al. (2012) optiCall: a robust genotype-calling algorithm for rare, low-frequency and common variants. Bioinformatics 28: 1598–1603.
- Teo YY, Inouye M, Small KS, Gwilliam R, Kwiatkowski, et al. (2009) A genotype calling algorithm for the Illumina BeadArray platform. Europe PMC Funders Group 23: 2741-2746.
- Carvalho BS, Louis TA, Irizarry RA (2010) Quantifying uncertainty in genotype calls. Bioinformatics 26: 242–249.
- Ritchie ME, Liu R, Carvalho BS, Irizarry RA (2011) Comparing genotyping algorithms for Illumina’s Infinium whole-genome SNP BeadChips. BMC bioinformatics 12: 68.
- Gardner SN, Thissen JB, McLoughlin KS, Slezak T, Jaing CJ (2013) Optimizing SNP microarray probe design for high accuracy microbial genotyping. J Microbiol Methods 94: 303-310.
- Reimers M (2010) Making Informed Choices about Microarray Data Analysis. PLoS Comput Biol 6: e1000786.
- Chahil JK, Lye SH, Bagali P, Alex LA (2012) A novel pathogenic variant of the LDLR gene and its clinical correlation with Familial hypercholesterolemia. Mol Biol Rep 39: 7831-7838.