
Journal of Cardiobiology
Download PDF
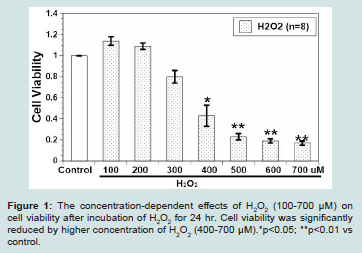 Figure 1: The concentration-dependent effects of H2O2 (100-700 μM) on cell viability after incubation of H2O2 for 24 hr. Cell viability was significantly reduced by higher concentration of H2O2 (400-700 μM).*p<0.05; **p<0.01 vs
control.
Figure 1: The concentration-dependent effects of H2O2 (100-700 μM) on cell viability after incubation of H2O2 for 24 hr. Cell viability was significantly reduced by higher concentration of H2O2 (400-700 μM).*p<0.05; **p<0.01 vs
control.
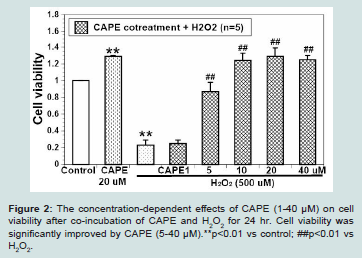 Figure 2: The concentration-dependent effects of CAPE (1-40 μM) on cell viability after co-incubation of CAPE and H2O2 for 24 hr. Cell viability was significantly improved by CAPE (5-40 μM).**p<0.01 vs control; ##p<0.01 vs H2O2.
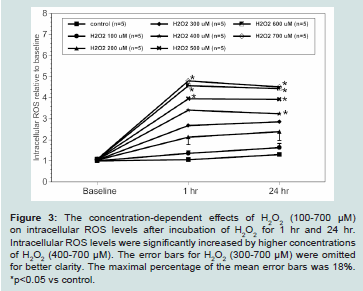 Figure 3: The concentration-dependent effects of H2O2 (100-700 μM)
on intracellular ROS levels after incubation of H2O2 for 1 hr and 24 hr.
Intracellular ROS levels were significantly increased by higher concentrations
of H2O2 (400-700 μM). The error bars for H2O2 (300-700 μM) were omitted
for better clarity. The maximal percentage of the mean error bars was 18%.
*p<0.05 vs control.
Figure 3: The concentration-dependent effects of H2O2 (100-700 μM)
on intracellular ROS levels after incubation of H2O2 for 1 hr and 24 hr.
Intracellular ROS levels were significantly increased by higher concentrations
of H2O2 (400-700 μM). The error bars for H2O2 (300-700 μM) were omitted
for better clarity. The maximal percentage of the mean error bars was 18%.
*p<0.05 vs control.
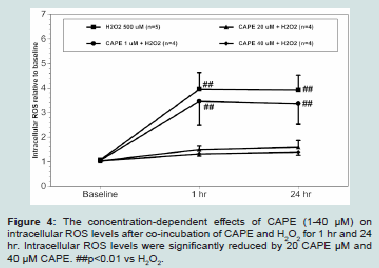 Figure 4: The concentration-dependent effects of CAPE (1-40 μM) on
intracellular ROS levels after co-incubation of CAPE and H2O2 for 1 hr and 24
hr. Intracellular ROS levels were significantly reduced by 20 CAPE μM and
40 μM CAPE. ##p<0.01 vs H2O2.
Figure 4: The concentration-dependent effects of CAPE (1-40 μM) on
intracellular ROS levels after co-incubation of CAPE and H2O2 for 1 hr and 24
hr. Intracellular ROS levels were significantly reduced by 20 CAPE μM and
40 μM CAPE. ##p<0.01 vs H2O2.
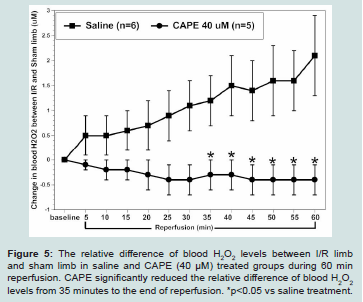 Figure 5: The relative difference of blood H2O2 levels between I/R limb
and sham limb in saline and CAPE (40 μM) treated groups during 60 min
reperfusion. CAPE significantly reduced the relative difference of blood H2O2 levels from 35 minutes to the end of reperfusion. *p<0.05 vs saline treatment.
Figure 5: The relative difference of blood H2O2 levels between I/R limb
and sham limb in saline and CAPE (40 μM) treated groups during 60 min
reperfusion. CAPE significantly reduced the relative difference of blood H2O2 levels from 35 minutes to the end of reperfusion. *p<0.05 vs saline treatment.
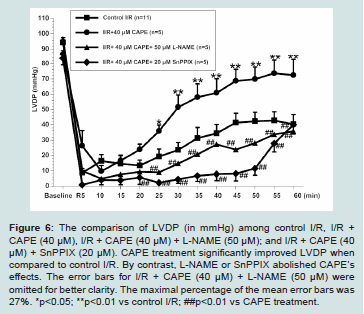 Figure 6: The comparison of LVDP (in mmHg) among control I/R, I/R + CAPE (40 μM), I/R + CAPE (40 μM) + L-NAME (50 μM); and I/R + CAPE (40 μM) + SnPPIX (20 μM). CAPE treatment significantly improved LVDP when compared to control I/R. By contrast, L-NAME or SnPPIX abolished CAPE’s effects. The error bars for I/R + CAPE (40 μM) + L-NAME (50 μM) were omitted for better clarity. The maximal percentage of the mean error bars was 27%. *p<0.05; **p<0.01 vs control I/R; ##p<0.01 vs CAPE treatment.
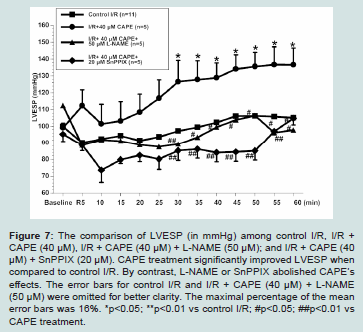 Figure 7: The comparison of LVESP (in mmHg) among control I/R, I/R + CAPE (40 μM), I/R + CAPE (40 μM) + L-NAME (50 μM); and I/R + CAPE (40 μM) + SnPPIX (20 μM). CAPE treatment significantly improved LVESP when
compared to control I/R. By contrast, L-NAME or SnPPIX abolished CAPE’s effects. The error bars for control I/R and I/R + CAPE (40 μM) + L-NAME (50 μM) were omitted for better clarity. The maximal percentage of the mean error bars was 16%. *p<0.05; **p<0.01 vs control I/R; #p<0.05; ##p<0.01 vs CAPE treatment.
Figure 7: The comparison of LVESP (in mmHg) among control I/R, I/R + CAPE (40 μM), I/R + CAPE (40 μM) + L-NAME (50 μM); and I/R + CAPE (40 μM) + SnPPIX (20 μM). CAPE treatment significantly improved LVESP when
compared to control I/R. By contrast, L-NAME or SnPPIX abolished CAPE’s effects. The error bars for control I/R and I/R + CAPE (40 μM) + L-NAME (50 μM) were omitted for better clarity. The maximal percentage of the mean error bars was 16%. *p<0.05; **p<0.01 vs control I/R; #p<0.05; ##p<0.01 vs CAPE treatment.
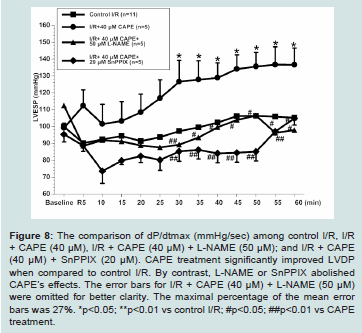 Figure 8: The comparison of dP/dtmax (mmHg/sec) among control I/R, I/R + CAPE (40 μM), I/R + CAPE (40 μM) + L-NAME (50 μM); and I/R + CAPE (40 μM) + SnPPIX (20 μM). CAPE treatment significantly improved LVDP
when compared to control I/R. By contrast, L-NAME or SnPPIX abolished CAPE’s effects. The error bars for I/R + CAPE (40 μM) + L-NAME (50 μM) were omitted for better clarity. The maximal percentage of the mean error bars was 27%. *p<0.05; **p<0.01 vs control I/R; #p<0.05; ##p<0.01 vs CAPE treatment.
Figure 8: The comparison of dP/dtmax (mmHg/sec) among control I/R, I/R + CAPE (40 μM), I/R + CAPE (40 μM) + L-NAME (50 μM); and I/R + CAPE (40 μM) + SnPPIX (20 μM). CAPE treatment significantly improved LVDP
when compared to control I/R. By contrast, L-NAME or SnPPIX abolished CAPE’s effects. The error bars for I/R + CAPE (40 μM) + L-NAME (50 μM) were omitted for better clarity. The maximal percentage of the mean error bars was 27%. *p<0.05; **p<0.01 vs control I/R; #p<0.05; ##p<0.01 vs CAPE treatment.
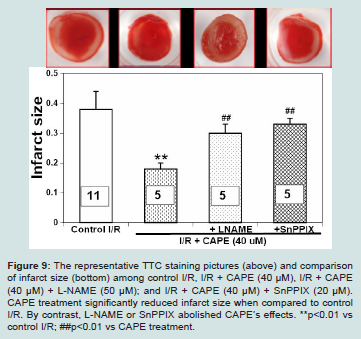 Figure 9: The representative TTC staining pictures (above) and comparison of infarct size (bottom) among control I/R, I/R + CAPE (40 μM), I/R + CAPE (40 μM) + L-NAME (50 μM); and I/R + CAPE (40 μM) + SnPPIX (20 μM).
CAPE treatment significantly reduced infarct size when compared to control I/R. By contrast, L-NAME or SnPPIX abolished CAPE’s effects. **p<0.01 vs control I/R; ##p<0.01 vs CAPE treatment.
Figure 9: The representative TTC staining pictures (above) and comparison of infarct size (bottom) among control I/R, I/R + CAPE (40 μM), I/R + CAPE (40 μM) + L-NAME (50 μM); and I/R + CAPE (40 μM) + SnPPIX (20 μM).
CAPE treatment significantly reduced infarct size when compared to control I/R. By contrast, L-NAME or SnPPIX abolished CAPE’s effects. **p<0.01 vs control I/R; ##p<0.01 vs CAPE treatment.
Research Article
Caffeic Acid Phenethyl Ester Mitigates Oxidative Stress and Restores Vascular and Heart Function
Castellano A, Lefkowitz D, Sandhu R, Kim A, Wieczorek P, Kuhn T, Liu S, Kucharski K, Venditto J, Kuo D, Ibe A, Barsotti R, Young LH and Chen Q*
Department of Bio-Medical Sciences, Philadelphia College of Osteopathic Medicine, USA
*Address for Correspondence: Chen Q, Department of Bio-Medical Sciences, Philadelphia College of Osteopathic Medicine, USA, Tel: 215-871-6153, Fax: 215-871-6869; E-mail: qianch@pcom.edu
Castellano A and Lefkowitz D shared co-first authorship and contributed equally
Submission: 27 October 2020;
Accepted: 29 November, 2020;
Published: 15 December, 2020
Copyright: © 2020 Chen Q and Castellano A et al. This is an open access article distributed under the Creative Commons Attribution License, which permits unrestricted use, distribution, and reproduction in any medium, provided the original work is properly cited.
Abstract
Oxidative stress, such as increased hydrogen peroxide (H2O2) levels, is a major event initiating pathogenesis of various cardiovascular diseases. The effects of Caffeic Acid Phenethyl Ester (CAPE), a natural antioxidant compound, on oxidative stress-induced cardiac cell damage and vascular/heart dysfunction have not been fully elucidated. In this study, the effects of CAPE were tested in H2O2-induced H9c2 cell damage, a hind limb ischemia (I, 30 min)/reperfusion (R, 60 min), and a global heart ischemia (I, 30 min)/reperfusion (R, 60 min) conditions. We found that H2O2 (300 -700 μM; n=8) concentration-dependently decreased H9c2 cell viability accompanied with increased intracellular reactive oxygen species (ROS). H2O2 (500 μM) significantly decreased cell viability to 23 ± 3% with a significantly increased intracellular ROS
levels by 2.95 ± 0.6 fold when compared to the control (both p<0.05). By contrast, co-treatment of CAPE (10 to 40 μM) and 500 μM H2O2 (n=5) significantly improved cell viability associated with reduction of intracellular ROS in a concentration-dependent manner (p<0.05). Similarly, CAPE (0.95 mg/Kg, equivalent to 40 μM in blood, n=5) when given at reperfusion significantly reduced blood H2O2 levels during reperfusion compared to saline treatment in a rat hind limb I (30 min)/R
(60 min) model (all p<0.05). Last, CAPE (40 μM, n=5) given at beginning of reperfusion for 5 minutes significantly salvage heart tissue and cardiac contractile function when compared to untreated I/R hearts (n=11; all p<0.05) during 60 min. reperfusion. The cardio-protective effects of CAPE were significantly abolished by a non-selective nitric oxide synthase inhibitor, NG-nitro-L-arginine methyl ester (50 μM, n=5), or a heme oxygenase-1 inhibitor, SnPPIX (20 μM, n=5) (all p<0.05). These results suggest that CAPE mitigates H2O2 caused cardiac cell damage and I/R induced vascular and heart dysfunction possibly by reducing oxidative stress and/or increasing heme oxygenase-1 and nitric oxide synthase activity.
Introduction
Prevention and treatment of cardiovascular diseases are a major health challenge worldwide. Although disease development involves many factors, oxidative stress has been well recognized as a major contributor [1]. Normally, cellular Reactive Oxygen Species (ROS) are low and play an important physiological role in cellular signaling. Moreover, any excessive ROS will be disposed by endogenous antioxidant mechanisms, such as superoxide dismutase, catalase,
and hemeoxygenase [2]. By contrast, under pathological conditions, ROS are overproduced and overwhelms the antioxidant mechanisms. Subsequently, the excessive ROS would oxidize cellular protein, lipid, and nucleic acid; even cause cell death. Furthermore, oxidative stress can initiate inflammation to recruit leukocytes by disturbing vascular endothelial anti-inflammatory property mainly via reduction of blood nitric oxide bioavailability [3]. A representative intracellular ROS is hydrogen peroxide (H2O2). It is an intermediate product after dismutation of superoxide during superoxide disposal. Also, it has relatively longer half-life, is cell permeable, and can be further converted into hydroxyl radical, which is more harmful than H2O2 itself [2]. Researchers have demonstrated that Ischemia/Reperfusion (I/R) can cause an increase of H2O2 in cardiac cells [4]. Moreover, our lab also shows that blood H2O2 levels are increased accompanied with reduced blood nitric oxide levels during an I/R insult in hind limbs of rats [5]. Lower blood nitric oxide indicates vascular endothelial dysfunction during reperfusion. Subsequently, oxidative stress and vascular dysfunction can further induce inflammation, cell damage, and organ dysfunction [6-8]. Therefore, compounds which can counteract H2O2 may mitigate oxidative stress associated progression in cardiovascular diseases.
Caffeic Acid Phenethyl Ester (CAPE), a naturally compound
in honey bee hives, has been shown to exhibit anti-oxidant effects
[9]. CAPE shows profound H2O2 scavenging effects in Human
Leukemic HL-60 cells [10]. Moreover, CAPE protects retinal
pigment epithelium cells and middle ear epithelial cells against H2O2
induced cell damage [11,12]. Although CAPE is one of the most
important active compounds of propolis, the direct effects of CAPE
on H2O2-induced H9c2 cell damage and oxidative stress related I/R
injury have not been fully evaluated. In this study, we first tested
the concentration-dependent effects of H2O2 on H9c2 cell viability.
Second, we evaluated if CAPE can protect H9c2 cells against an H2O2
insult. Third, the effects of CAPE on intracellular ROS levels in H9c2
cells and blood H2O2 levels under rats’ hind limb I/R condition were
measured. Lastly, we investigated if CAPE given at reperfusion would
protect heart from an I/R insult, and further determine if nitric oxide
bioavailability or heme oxygenase-1 would contribute to CAPE’s
cardioprotective effects.
Materials and Methods
Experimental animals and ethical statement:
All animal procedures complied with the legal and ethical guidelines established by the Institutional Animal Care and Use
Committee at PCOM for care and use of animals. Male Sprague-Dawley (SD) rats (Charles River, Springfield, MA) were housed in polypropylene cages (2 rats in each) on wood shavings and provided free access to food and water. SD rats at 275-325 g (8 -10 weeks) were used for the ex vivo and in vivo experiments in this study.
Chemicals and reagents:
CAPE and 2’,7’-Dichlorofluorescein Diacetate (DCFDA) were purchased from Abcam (Cambridge, MA, USA). H2O2, NG-Nitro-L-arginine methyl ester hydrochloride (L-NAME, a Nitric Oxide Synthase (NOS) inhibitor), and Dimethyl Sulfoxide (DMSO) were obtained from Sigma (St. Louis, MO, USA). Tin Protoporphyrin IX (SnPPIX, a heme oxygenase-1 inhibitor) was purchased from Cayman Chemical (Ann Arbor, MI, USA). Cell Counting Kit-8 assay (CCK-8) was obtained from Dojindo Molecular Technologies (Rockville, MD, USA). Hank’s balanced salt solution (HBSS, 10x) without sodium bicarbonate and phenol red was purchased from Gibco Laboratories (Gaithersburg, MD, USA).
Cell Culture and treatments:
Rat H9c2 myoblasts are derived from embryonic BD1X rat heart tissue and were obtained from American Type Culture Collection (ATCC, CRL-1446). Cells were cultured on 75 cm2 culture flasks and petri dishes in high glucose Dulbecco’s modified Eagle’s medium (DMEM), 1% penicillin/streptomycin, and 10% Fetal Bovine Serum (FBS). The cultures were maintained in a humid incubator (5% CO2 at 37 oC) with medium changes every 2-3 days until 70-80% confluency. Prior to each experiment, cells were de-attached with trypsin/EDTA and cell density was counted using a hemocytometer after trypan blue (0.3%) staining. Subsequently, cells were seeded into a 96-well plate at density of 2 x 10⁴ cells/well. After incubation for 24 hours, a small amount of medium (5 μl) was added to cell wells which were served as the control; whereas H2O2 (100-700 μM), CAPE (1-40 μM), or CAPE (1-40 μM) + H2O2 (500 μM), was added to treat cells. Cell viability was evaluated after treatments for 24 hours (hr).
Cell viability assay:
Cell viability was estimated in H9c2 cells using a CCK-8 assay kit (Dojindo Molecular Technologies, Rockville, MD, USA). At the end of treatments, old medium was removed and replaced with new medium, then 10 μl of CCK-8 solution was administered to each well, and incubated for 4 hr. Absorbance at 450 nm was measured by an iMark Microplate Reader (Bio-Rad Laboratories, Philadelphia, PA, USA). It has been suggested that the amount of absorbance produced after CCK administration is directly proportional to the number of living cells (Dojindo Molecular Technologies). Cell viability was
confirmed by observing cell morphology with microscopy. Cell viability is expressed as the ratio between treatments and the control. The control and treatments were conducted in triplets and at least three individual experiments were performed for analysis.
Cell-based intracellular ROS assay:
Intracellular ROS levels were evaluated by using a DCFDA assay. DCFDA is a cell permeable and fluorogenic dye which can
be deacetylated by cellular esterases first, then further oxidized by intracellular ROS into a highly fluorescent compound, 2’,7’-Dichlorofluorescein (DCF). Cells were washed twice with phosphate buffer solution (Corning Inc.) and incubated with 25 μM DCFDA (dissolved in a 10% FBS HBSS) for 45 mins at 37 oC. Afterwards, H9c2 cells were again washed twice with PBS to remove DCFDA from incubating solution. Thereafter, medium, H2O2 (100-700 μM), or CAPE (1-40 μM) + H2O2 (500 μM) were added to cells. The fluorescence (excited at 480 nm and emission at 520 nm) was measured by using a Fluroskan Ascent CF scanner (Thermo Scientific, San Diego, CA, USA) at baseline, 1 hour and 24 hours posttreatment.
The fluorescent signals were normalized to the baseline at time zero before adding treatments. The relative fluorescence served as an index to the production of ROS. The control and treatments were conducted in triplets and at least three individual experiments were performed for analysis.
Measurement of relative blood H<sub>2</sub>O<sub>2</sub> levels in real-time under I/R conditions:
Male SD rats were anesthetized with an intraperitoneal (i.p.) injection of 60 mg/kg sodium pentobarbital for induction and 30 mg/kg for maintenance as needed. The hindlimb was dissected to expose the femoral veins and arteries bilaterally. The femoral veins were cannulated with a 24-gauge catheter, and then calibrated H2O2 microsensors (100 μm, World Precision Instruments, Inc., Sarasota, FL) inserted into the catheters bilaterally. The microsensors were connected to a free radical gas analyzer (Apollo 4000, WPI, Inc., Sarasota, FL) which allowed for real-time measurements of
blood H2O2 levels as previously described [5,13]. After stabilization of baseline, one limb was subjected to ischemia via clamping of the femoral artery and vein for 30 minutes (min.) followed by reperfusion by removing the clamp for 60 min. Drugs (CAPE, 0.95 mg/Kg, equivalent to 40 μM in blood) or saline (for non-drug control group) was applied through jugular vein catheter at the beginning of reperfusion. We continuously recorded blood H2O2 levels in pA and collect the data at 5 min. intervals during baseline, 30 min. ischemia and 60 min. reperfusion. After experiments, the changes in blood H2O2 levels were calculated as relative H2O2 blood levels (μM) between I/R limb and sham limb after correction to the calibration curve of H2O2 microsensors.
Myocardial I/R injury in isolated rat heart:
Langendorff heart preparation was performed after anesthesia of male SD rats (275-325 g, Charles River, Springfield MA) [5,13]. Hearts were isolated and retrograde perfused with Krebs’ buffer at a constant pressure of 80 mmHg with 37 ºC and pH of 7.35-7.45. After 15 min of baseline perfusion, the heart was put through global ischemia by stopping perfusion for 30 min, followed by reperfusion for 60 min. Krebs’ buffer alone, 40 μM CAPE, 40 μM CAPE + 50 μM L-NAME, or 40 μM CAPE + 20 μM SnPPIX was infused with 1 ml/min during the first 5 min of reperfusion. A pressure transducer (SPR-
524, Millar Instruments, Inc., Houston, TX) was inserted into the left ventricle to record Left Ventricular End Systolic Pressure (LVESP), Left Ventricular End Diastolic Pressure (LVEDP), maximal rate of left ventricular systolic pressure over time (dP/dtmax), minimal rate of left ventricular diastolic pressure over time (dP/dtmin), and heart rate. Moreover, left ventricular developed pressure was calculated by the difference between LVESP and LVESP. Coronary flow was
measured by a flow probe (T106, Transonic Systems, Inc., Ithaca, NY) which was placed in line with perfusion line. Data was recorded using a Powerlab Station acquisition system (AD Instruments, Grand Junction, CO) every 5 min during the baseline and reperfusion phases.
At the end of the experiments, the left ventricle of the hearts was sectioned into 2 mm thick slices that were subjected to 1% Triphenyltetrazolium Chloride (TTC) staining to detect infarcted (unstained) and viable (stained brick red) area. Infarct size was expressed as the percentage of infarcted tissue weight to the total tissue weight [14].
Statistical analysis:
All data were presented as means ± S.E.M. The data was analyzed by ANOVA using post hoc analysis with Student-Newman-Keuls test. p<0.05 are considered to be statistically significant.
Results
CAPE concentration-dependently increased H9c2 cell viability from H<sub>2</sub>O<sub>2</sub> induced cell death:
The effects of various H2O2 concentrations (100-700 μM, n=8) on H9c2 cell viability after incubation for 24 hours is illustrated in (Figure 1). H9c2 cell viability increased slightly at 100 μM and 200 μMH2O2, but decreased in a concentration-dependent manner from 300 μM to 700 μMH2O2. The IC50 of H2O2 on H9c2 cells cell viability was about 369 μM. At a concentration of 500 μM, H2O2 significantly decreased cell viability to 23 ± 3% (p < 0.01 vs control). A 24 hr treatment of
500 μMH2O2 was used as an oxidative stress or to test if CAPE would mitigate oxidative stress.
We found that CAPE (1-40 μM) alone was non-cytotoxic to H9c2 cells after incubation for 24 hr (data not shown). Moreover, the solvent of CAPE DMSO (<1%) did not show any cell death after administration for 24 hr (data not shown). We further evaluated H9c2 cell viability after co-treatment of CAPE (1-40 μM) and 500 μMH2O2 for 24 hr. We found that CAPE (1-40 μM) concentration-dependently increased cell viability when compared to H2O2 alone (Figure 2).
The lower concentration CAPE (1 μM) only slightly increased cell viability. By contrast, the intermediate concentration CAPE (5 μM) began to show the significantly higher cell viability when compared to H2O2 alone (p<0.01). Moreover, the higher concentration CAPE (10-40 μM) completely reversed H2O2 caused cell damage and showed the similar cell viability as CAPE alone (all p<0.01 vs 500 μM H2O2).The EC50 of CAPE on H2O2 induced cell damage is about 2 μM.
CAPE concentration-dependently reduced intracellular ROS in the presence of H<sub>2</sub>O<sub>2</sub>:
H2O2 (100-700 μM) concentration-dependently increased intracellular ROS levels in H9c2 cell when compared to the control baseline (Figure 3). In control cells, the ROS levels slightly increased by 0.06 ± 0.04 and 0.3 ± 0.06 fold at 1 hr. and 24 hr. when compared to the control baseline, respectively. The ROS levels showed a quick increase after H2O2 incubation within an hour. Thereafter, 100-300 μMH2O2 steadily increased ROS production over the 24 hrs, whereas
400-700 μMH2O2 showed a dramatic increase of ROS within 1 hr, then either plateaued or slightly reduced within 24 hr. From 1 hr to 24 hr, 500 μMH2O2 maintained about a 2.95 ± 0.6 fold increases of intracellular ROS levels when compared to the control (p<0.05).
Intracellular ROS levels of H9c2 cells after co-treatment with CAPE (1-40 μM) and 500 μMH2O2 for 24 hr is shown in (Figure 4). We found that CAPE concentration-dependently reduced intracellular ROS levels from 1 hr throughout 24 hr. Lower concentration of CAPE (1 μM) did not significantly reduced intracellular ROS levels when compared to that in 500 μMH2O2. By contrast, higher concentrations of CAPE (20 μM and 40 μM) significantly reduced intracellular ROS to near basal levels (p < 0.05 vs H2O2 500 μM).
CAPE reduced blood H<sub>2</sub>O<sub>2</sub> levels in a hind limb I/R model:
We have demonstrated that oxidative stress could be induced by reperfusion for 45 min following prolonged ischemia (i.e., 30 min) in rat hind limbs. We found that I/R limb had significantly higher blood H2O2 levels than blood H2O2 levels in non-I/R limb [5,13]. In this study, we further confirmed that I (30 min)/R (60 min) in hind limb significantly increased blood H2O2 levels to 2.1 ± 0.8 μM relative to the sham limb at 60 minutes’ reperfusion in non-treated control rats (n=5). By contrast, CAPE (0.95 mg/Kg, equivalent to 40 μM, n=5) when given at reperfusion significantly reduced blood H2O2 levels
from 35 min reperfusion and throughout the rest of experiment. The relative difference of blood H2O2 levels between I/R limb and sham limb was -0.4 ± 0.3 μM at 60 minutes’ reperfusion (Figure 5).
CAPE reduced myocardial infarction size and improved postreperfused cardiac function:
The cardiac functions among experimental groups are shown in (Figures 6-8). We found that untreated I/R hearts (n=11) only recovered LVDP to 45 ± 8%, LVESP to 106 ± 7%, and dP/dtmax to 33 ± 5% of baseline values, respectively at the end of 60 minutes’ reperfusion following 30 minutes ischemia. By contrast, CAPE (40 μM, n=5) when given at reperfusion for 5 minutes significantly restored LVDP to 75 ± 15%, LVESP to 133 ± 13%, and dP/dtmax to 54 ± 12% of baseline values, respectively (all p<0.05 vs control I/R, Figure 6-8). Moreover, CAPE also significantly reduced infarct size to 19 ± 2% when compared to 30 ± 6% in control I/R hearts (p<0.05; Figure 9). There was no significant difference among heart rate and
coronary flow among different groups.
We further evaluated if nitric oxide bioavailability or heme oxygenase-1 are involved in CAPE’s protective effects. We found that a non-selective NOS inhibitor, L-NAME (50 μM, n=5), or a hemeoxygenase inhibitor, SnPPIX (20 μM, n=5), significantly abolished all the cardioprotective effects of CAPE, respectively (all p<0.05 vs CAPE treatment, Figures 6-9).
Discussion
This study showed that H2O2 (400-700 μM) significantly reduced H9c2 cell viability in a concentration-dependent manner. The cell damage was possibly due to the significant increase of intracellular ROS levels. By contrast, co-treatment of CAPE (5-40 μM) provided significant cyto-protection against an H2O2 insult, which may be contributed to the significant reduction of intracellular ROS. We also found that CAPE (40 μM) when given at the beginning of reperfusion significantly decreased blood H2O2 levels during reperfusion when compared to the saline treatment. Moreover, CAPE (40 μM) when given at the beginning of reperfusion significantly restored postreperfused cardiac function accompanied with reduction
of infarct percentage. Inhibition of NOS or heme oxygenase-1 completely abolished CAPE’s cardioprotective effects.
H2O2 is a widely used oxidant to simulate oxidative stress in vitro studies. We found that H2O2 exhibited opposite effects depending on its concentration. Lower concentrations (100-200 μM) of H2O2 slightly increased cell viability, which may be related to redox signaling. By contrast, higher concentrations (300-700 μM) of H2O2 concentration-dependently reduced cell viability. This is consistent with a previous H2O2-induced oxidative stress model in H9c2 cells [15]. Sun. et al. found that H2O2 administration decreased cell viability in time-and concentration-dependent manners. More than 50% cell viability losses were seen after 6 hours incubation of 700 and 900 μM H2O2 [16]. Even in a transient exposure of 400 μMH2O2 to H9c2 cells, it still can trigger time-dependent apoptosis [17]. The damaging effect of H2O2 may be related to the increase of intracellular ROS level. In this study, we showed that H2O2 quickly increased intracellular ROS levels within one hour and the increase lasted for 24 hours. Similarly, Kim et al showed intracellular ROS started to increase after only 5 minutes in H9c2 cells treated with 500 μM H2O2 [18]. Normally, intracellular H2O2 is degraded into H2O and oxygen by catalase or quenched by glutathione peroxidase. However, if H2O2 overwhelms cellular antioxidant capacity, the excessive H2O2 will propagate ROS formation through other mechanisms. One biological reaction critical in free radical generation is the Fenton reaction, where H2O2 decomposes by accepting an electron from a reduced metal ion (such as Fe2+ or Cu+) to form hydroxyl radicals. At high concentrations, superoxide and H2O2 can react with one another via Haber-Weiss reaction to produce a hydroxyl radical as well, further propagating ROS formation [2]. Higher level of H2O2 and the subsequent formation of potent hydroxyl radicals have been shown to contribute to pathologies such as inflammation, stroke, septic shock, and ischemia/reperfusion injury [1]. Additionally, it has been indicated that H2O2 transient exposure can trigger intracellular ROS production possibly from mitochondria [17]. On the other hand, studies have indicated that H2O2 can reduce intracellular antioxidant mechanisms, such as SOD activity or glutathione peroxidase [19], which may further exacerbate the oxidative stress induced by H2O2.
CAPE, a major component of honey bee hives, has been shown to have anti-oxidant effects against H2O2 caused cell damage [16]. In this study, we further confirm CAPE’s cytoprotective effects when given as a co-treatment with H2O2. We also established a concentration response relationship of CAPE and the EC50 of CAPE was 2 μM. Moreover, Wang et al showed CAPE pretreatment for 6 hours significantly protect HUVECs against menadione, another oxidative stress mimetic, induced cytotoxicity [20]. Another study showed that CAPE pretreatment for 5 hours provided beneficial effects on HUVECs against a transient insult of 2 mM H2O2. The EC50 of CAPE on HUVECs is about 8 μM [21]. Meanwhile, the intracellular ROS levels were significantly reduced no matter if CAPE was given as co-treatment in this study or pretreatment in other studies [21]. Furthermore, the lipid peroxidation due to oxidative stress has been found to be reduced after CAPE administration [16]. The reduction of ROS levels can be contributed by direct quench effects of CAPE and/or indirect mechanisms. It has been proposed that CAPE possesses chemical structure for free radical scavenging, such as hydroxyl group and/or catechol ring [22]. Additionally, it has been suggested that CAPE can upregulate intracellular anti-oxidant mechanisms, such as superoxide dismutase, glutathione peroxidase, and heme oxygenase-1 [16,20].
Oxidative stress is a major contributor to I/R injury. Slezak, J et al. have shown that I/R causes an increase of H2O2 in cardiac cells [4]. Moreover, our lab also suggested that blood H2O2 levels are increased during reperfusion after a prolonged ischemia by inserting a H2O2 sensor into femoral veins to measure blood H2O2 levels in real-time in rats [5,13,14]. CAPE administration at the beginning of reperfusion showed significant reduction of blood H2O2 levels from 35 min to 60 min of reperfusion when compared to the saline control. The data further supports that CAPE exerts anti-oxidant effects in vivo. It has been reported that CAPE can be quickly hydrolyzed by esterase and exhibits a relatively short half-life in rat plasma [23]. However, CAPE is relatively stable in human plasma [24]. The major metabolite product of CAPE in plasma is caffeic acid, which is also an antioxidant [24]. CAPE and its metabolites may contribute to its antioxidant
effects that lasted for an hour in this study.
We further found that CAPE given at the beginning of reperfusion could preserve postreperfused cardiac function and
reduce infarct percentage. The cardioprotective effects of CAPE on I/R injury have been indicated in regional ischemia/reperfusion and diabetic heart [25-27]. We found that the beneficial effects can be abolished by a NOS inhibitor or a heme oxygenase-1 inhibitor. CAPE has been suggested to upregulate gene and protein expressions of heme oxygenase-1. CAPE can cause a near 20-fold increase in heme oxygenase-1 expression in HUVEC [20]. Scapagnini et al. also showed that CAPE (15-50 μM) upregulated heme oxygenase-1 expression in astrocytes after 6 or 24 hrs of treatment [28]. It has been discovered that the hydroxyl groups situated in the ortho position of the aromatic in CAPE are attributed to the induction of heme oxygenase-1 [29]. Furthermore, CAPE exerted its antioxidative effects through the Nrf2-mediated heme oxygenase-1 pathway and its anti-inflammatory effects through NF-κB inhibition in murine macrophages and gingival fibroblasts [30]. Hemeoxygenase (HO) is the rate-limiting enzyme in the degradation of heme into free iron, carbon monoxide (CO) and biliverdin. heme oxygenase-1 is highly inducible by various stresses and may provide to play an important role in cellular protection against oxidative stress [31]. It has been indicated that biliverdin, bilirubin, and CO from heme oxygenase-1 related reaction have shown potent antioxidant, anti-inflammatory, or anti-apoptosis effects [20].
Additionally, endothelial-derived nitric oxide synthase (eNOS) may participate in CAPE’s protective effects. Endothelial-derived NOS is an enzyme to produce nitric oxide normally in the presence of its substrate, L-arginine and essential co-factor, tetrahydrobiopterin. Endothelium-derived NO is a key regulator contributing to vascular homeostasis, such as facilitates blood flow, vasodilation, and antiinflammatory, and anti-coagulant [32]. However, it has been demonstrated that eNOS shifts its product from NO to SO under oxidative stress possibly due to oxidation of tetrahydrobiopterin to dihydrobiopterin [33]. We speculate that CAPE exerted direct/indirect anti-oxidant effect to reduce oxidative stress during reperfusion, which promoted normal activity of eNOS and subsequent normal vascular function. Better vasculature function would lead to better cardiac function and less cell damage. Therefore, blockade of eNOS activity by using non-selective NOS inhibitor would reduce CAPE’s effects. Meanwhile, it has been shown that eNOS involves CAPE cardioprotective effects in a diabetic heart I/R model [27]. In another study, CAPE restores eNOS expression on vascular endothelium in high fructose corn syrup consumption rats [34].
In summary, this study provides new evidence of cytoprotective effects of CAPE against oxidative stress-induced cardiac cell and vascular/heart damage by its anti-oxidants properties and regulating hemeoxygenase-1 and nitric oxide synthase activity. It will be intriguing to further investigate if CAPE’s protective effects and underlying mechanisms can be maintained after CAPE removal.
Acknowledgement
The study was supported by Division of Research and Department of Bio-Medical Sciences at PCOM.
References
Citation
Castellano A, Lefkowitz D, Sandhu R, Kim A, Wieczorek P, et al. Caffeic Acid Phenethyl Ester Mitigates Oxidative Stress and Restores Vascular and Heart Function. J Cardiobiol. 2020;7(1): 7.