
Research Article
*Address for Correspondence: Yohan Yoon, Food Safety Research Division, Korea Food Research Institute, Seongnam 13539, Korea, Tel: +82-2-2077-7585; Fax: +82 2 710 9479; E-mail: yyoon@sookmyung.ac.kr *Kyoung-hee Choi, Department of Oral Microbiology, College of Dentistry, Wonkwang University, Iksan 54538, Korea, Tel: +82-63-850-6911; Fax: +82 63 850 6911; E-mail: khchoi@wonkwang.ac.kr (or) kheechoi@wku.ac.kr
Citation: Choi Y, Jeong J, Pyun J, Lee H, Kim HJ. Kinetic Behavior of Pathogenic Escherichia coli and Staphylococcus aureus in Fresh Vegetables during Storage at Constant and Changing Temperature. J Bioanal Biostat 2016;1(1): 6.
Copyright © 2016 Choi Y, et al. This is an open access article distributed under the Creative Commons Attribution License, which permits unrestricted use, distribution, and reproduction in any medium, provided the original work is properly cited.
Journal of Bioanalysis and Biostatistics | Volume: 1, Issue: 1
Submission: 10 September, 2016 | Accepted: 02 November, 2016 | Published: 11 November, 2016
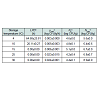
 To describe the changes to the kinetic growth parameters of the E. coli strains in response to increases in temperature, the square root model was fitted to μmax values as a function of temperature, and R2 values were 0.900-0.951, indicating that the square root model was appropriate to evaluate the temperature effect on μmax (lettuce: = 0.0215×(T–3.944), R2 = 0.900; water celery: = 0.0224×(T –6.790), R2 = 0.951). From the square root model, Tmin values, reflecting the theoretical minimum growth temperature for E. coli strains, can be calculated, and the values were 3.944 °C and 6.790 °C for lettuce and water celery, respectively.
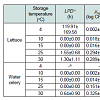
 Increase in the cell counts of S. aureus that was grown on the sprout mix and water celery samples were minimal at all tested temperatures (Figure 3 and 4). Thus, kinetic parameters were calculated only for lettuce samples. Slow S. aureus growth in lettuce were observed at 4 °C (0.003 log CFU/g/h) - 30 °C (0.024 log CFU/ g/h) (Table 2). LPD values were estimated for S. aureus in lettuce only at 4 °C (64.68 h) and 10 °C (20.11 h) (Table 2). The square root model was fitted to the μmax values and appropriate fitting was obtained to describe temperature effect on the μmax of S. aureus in lettuce (0.022×(T+6.077), R2= 0.947). Tmin value of the model was –6.077 °C, which is not realistic temperature for S. aureus growth.
 The observed S. aureus cell counts obtained from lettuce stored at 12 °C and 20 °C were compared to the predicted S. aureus cell counts from the developed model. A factor and B factor values were 1.096 and 0.981, respectively. The RMSE value of S. aureus in lettuce was 0.569, indicating that the developed model is appropriate to describe the kinetic behaviour of S. aureus in lettuce. The growth pattern of S. aureus in lettuce was also simulated under changing temperature condition (4.2 °C, 21.2 °C, and 10.5 °C at 6 h intervals) to describe the fate of the pathogen, and the simulation showed only minimal increases of S. aureus cell counts in lettuce (Figure 5).
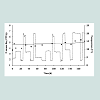
Kinetic Behavior of Pathogenic Escherichia coli and Staphylococcus aureus in Fresh Vegetables during Storage at Constant and Changing Temperature
Yukyung Choi1, Jiyeon Jeong1, Junghoon Pyun1, Heeyoung Lee1, Hyun Jung Kim2, Soomin Lee1, Sejeong Kim1, Jeeyeon Lee1, Jimyeong Ha1, Kyoung-hee Choi3* and Yohan Yoon2*
- 1Department of Food and Nutrition, Sookmyung Women’s University, Seoul 04310, Korea
- 2Food Safety Research Division, Korea Food Research Institute, Seongnam 13539, Korea
- 3Department of Oral Microbiology, College of Dentistry, Wonkwang University, Iksan 54538, Korea
*Address for Correspondence: Yohan Yoon, Food Safety Research Division, Korea Food Research Institute, Seongnam 13539, Korea, Tel: +82-2-2077-7585; Fax: +82 2 710 9479; E-mail: yyoon@sookmyung.ac.kr *Kyoung-hee Choi, Department of Oral Microbiology, College of Dentistry, Wonkwang University, Iksan 54538, Korea, Tel: +82-63-850-6911; Fax: +82 63 850 6911; E-mail: khchoi@wonkwang.ac.kr (or) kheechoi@wku.ac.kr
Citation: Choi Y, Jeong J, Pyun J, Lee H, Kim HJ. Kinetic Behavior of Pathogenic Escherichia coli and Staphylococcus aureus in Fresh Vegetables during Storage at Constant and Changing Temperature. J Bioanal Biostat 2016;1(1): 6.
Copyright © 2016 Choi Y, et al. This is an open access article distributed under the Creative Commons Attribution License, which permits unrestricted use, distribution, and reproduction in any medium, provided the original work is properly cited.
Journal of Bioanalysis and Biostatistics | Volume: 1, Issue: 1
Submission: 10 September, 2016 | Accepted: 02 November, 2016 | Published: 11 November, 2016
Abstract
This study used mathematical models to describe the kinetic behavior of pathogenic Escherichia coli and Staphylococcus aureus in lettuce, commercial sprout mix and water celery during storage at constant and changing temperature. μmax values of E. coli in lettuce (0.002-0.294 log CFU/g/h) and water celery (0.002-0.325 log CFU/g/h) significantly increased (P<0.05) as the temperature increased, but not in sprout mix. Regarding S. aureus, growth (0.003-0.024 log CFU/g/h)was observed on lettuce, but no growth in other vegetables. The square root model was appropriate to describe the temperature effect on the μmax of E. coli in lettuce (R2 = 0.900) and water celery (R2 =0.951), and μmax of S. aureus in lettuce (R2 = 0.947). RMSE (E. coli: lettuce = 0.691, water celery = 0.745; S. aureus: lettuce = 0.569) suggested that mathematical models were appropriate. The simulation with a dynamic model showed the gradual increase of E. coli cell counts in lettuce and water celery at changing temperature. The results indicate that pathogenic E. coli can be problematic in lettuce and water celery not in sprout mix, but S. aureus may not be risky in the vegetable examined in this study for both constant and changing temperature.Keywords
Fresh vegetables; E. coli; S. aureus; Kinetic model; Mathematical modelIntroduction
The consumption of fresh vegetables has been increasing because of their health benefits; however, foodborne outbreaks are more often associated with such produce because fresh vegetables are usually consumed raw [1-4], and therefore, fresh vegetable can be a vector to transfer pathogenic bacteria to consumer [5]. Foodborne illness caused by fresh vegetables is often associated with pathogenic Escherichia coli such as enterotoxigenic E. coli, enterohemorrhagic E. coli, enteroaggregative E. coli, enteroinvasive E. coli, and enteropathogenic E. coli [6-8]. Staphylococcus aureus is also a common cause of foodborne illness because it can resist to various harmful environments [9,10]. Kim et al. also isolated E. coli, Salmonella spp., and S. aureus from various salads. Jo et al. recently found the evidence of E. coli, S. aureus, Salmonella spp, and Listeria monocytogenes contamination in fresh-cut produce and organic vegetables [11,12]. These studies then suggested that foodborne disease can be derived from contaminated fresh vegetables and fruits [13,14]. However, the growth patterns of foodborne pathogens can be different by storage temperature, especially for changing temperature during storage, and type of vegetables. Thus, it is necessary to describe the kinetic behavior of foodborne pathogens in various vegetables and at different temperature patterns.To describe the kinetic behavior of foodborne pathogens, mathematical models can be used under specific conditions, in particular, the effects of storage temperatures on microbial growth [15-17]. Temperature is an important environmental factor for microbial growth, and changing temperature is a particularly important factor to consider when studying foodborne illnesses because circumstances change drastically during harvest, transport, and storage. A dynamic model developed by Baranyi and Roberts can predict bacterial growth under fluctuating temperature. With this mathematical concept, Koseki and Isobe developed mathematical models under changing temperatures during distribution to evaluate microbiological growth patterns on lettuce with pathogenic bacteria (E. coli O157:H7, Salmonella spp., and Listeria monocytogenes) [18,19]. Indeed, when Mckellar et al. simulated E. coli O157:H7 growth in fresh-cut lettuce under dynamic conditions, they were able to suggest the appropriate storage conditions that would effectively inhibit microbial growth under practical environment [20]. Also, Zeng et al. used the concept of mathematical model as an important method to compare bacterial growth (Escherichia coli O157:H7 and Listeria monocytogenes) in fresh-cut romaine mix at changing temperatures during transport, storage and display [14].
Therefore, the objective of this study was to describe the kinetic behavior of pathogenic strains of E. coli and S. aureus in lettuce, commercial sprout mix, and water celery with mathematical models at constant and changing temperature.
Materials and Methods
Inoculum preparationStaphylococcus aureus strains (ATCC 13565, ATCC 14458, ATCC 23235, ATCC 27664, and NCCP 10826) and pathogenic E. coli strains [enterohemorrhagic E. coli (NCCP 11142), enterotoxigenic E. coli (NCCP 14037), enteropathogenic E. coli (NCCP 14038), enteroaggregative E. coli (NCCP 14039), and enteropathogenic E. coli (NCCP 15661)] were cultured in 10 mL tryptic soy broth (TSB; Becton, Dickinson and Company, Sparks, MD, USA) at 35 °C for 24 h. A small portion of the culture (0.1 mL) was transferred into 10 mL TSB and subcultured at 35 °C for 24 h. Five S. aureus strains or five E. coli strains were mixed separately, centrifuged at 1,912 ×g to: 1,912 ⊗g at 4 °C for 15 min, and each pellet was washed twice with phosphate-buffered saline (PBS, pH 7.4; 0.2 g of KH2PO4, 1.5 g of Na2HPO4∙7H2O, 8.0 g of NaCl, and 0.2 g of KCl in 1 L of distilled water). Each suspension was then serially diluted with PBS to 5 log CFU/mL.
Sample preparation and inoculation
Lettuce, commercial sprout mix (broccoli, rapeseed, red kohlrabi, and alfalfa) which is consumed as mixed, and water celery were purchased from a grocery store, cut into small portions (lettuce: 10 g, sprout: 5 g, water celery: 6 g) and placed into a filter bag (Sample Bag, 3M, Korea). The 0.1 mL suspensions were used to inoculate the prepared vegetable samples at 3 log CFU/g. The samples were massaged thoroughly and then stored aerobically at 4 °C, 10 °C, 15 °C, 25 °C, and 30 °C. Each inoculated sample was analysed at specific intervals during their incubation [96 h (15 °C, 25 °C, and 30 °C), 288 h (10 °C), and 336 h (4 °C)].
Bacterial growth analysis
After incubation, 60 mL (lettuce) or 40 mL (sprout mix and water celery) of 0.1% buffered peptone water (BPW; Becton, Dickinson and Company) was added into the sample bags and pummelled in a pummeller (BagMixer; Interscience, St. Nom, France) for 1 min, and the homogenates were then serially diluted with BPW. Aliquots (0.1 mL) of the diluents were spread-plated on tryptic soy agar (TSA; Becton, Dickinson and Company, Sparks, MD, USA), mannitol salt agar (MSA; Becton, Dickinson and Company, Sparks, MD, USA), and E. coli/ Coliform Count Plate (PetrifilmTM, 3M, St. Paul, MN, USA) to enumerate total bacterial, S. aureus, and E. coli cell counts, respectively. The plates were then incubated at 35 °C for 24 h (total bacteria) and 48 h (S. aureus and E. coli), and bacterial colonies were counted manually. Five presumptive S. aureus colonies on MSA were identified with an agglutination test (Microgen® Staph Latex Agglutination Kit; Microgen Bioproducts Ltd., Surrey, UK), and the ratio of the number of positive colonies to the number of total colonies was used to determine the number of S. aureus colonies.
Calculation of kinetic parameters
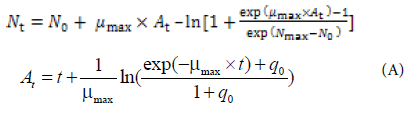
The Baranyi model (A) was fitted to the S. aureus and E. coli cell counts with DMFit (Institute of Food Research, Norwich, UK) to calculate kinetic parameters such as lag phase duration (LPD; h) and maximum specific growth rate (μmax; log CFU/g/h) as well as lower asymptote (N0; log CFU/g) and upper asymptote (Nmax; log CFU/g) for each storage temperature.
Nt: Bacterial cell counts at time t
N0: Initial bacterial counts
μmax: Maximum specific growth rate
At: Adjustment function related to
LPDNmax: Final bacterial counts
q0: a Parameter defining the initial physiological state of the cells
t: Time
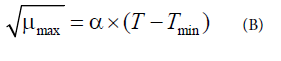
The square root model (B) was used to analyse the temperature effect on E. coli and S. aureus μmax in lettuce to develop secondary models as a function of storage temperature (Baranyi and Roberts) [18].
μmax: Maximum specific growth rate
α: Slope of linear equation
T: Storage temperature
Tmin: Theoretical minimum growth temperature
Validation
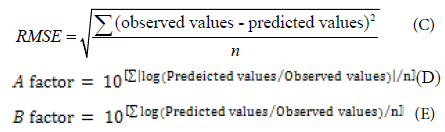
To evaluate the model performance, additional experiments were conducted for each bacteria/vegetable at 12 oC and 20 oC which were not used in developing mathematical models, and the observed bacterial cell counts were compared to the predicted bacterial cell counts of developed models. The root mean square error (RMSE) (C), A factor (D) and B factor (E) were then calculated by comparing the observed values and predicted values as follows:
Kinetic behavior at changing temperature
To predict S. aureus and E. coli cell counts under changing temperatures, the dynamic model was developed using the equation developed by Baranyi and Roberts [18]. The bacterial cell counts from lettuce, sprout mix and water celery were then simulated under changing temperature profiles, which were collected by measuring every 30 min from 10 am to 7:30 pm with an infrared light thermometer (HS33CT, Hansung, Seoul, Korea) in six grocery stores.
Statistical analysis
μmax values were analysed using the general linear model procedure of SAS® version 9.3 (SAS Institute, Cary, NC, USA). All mean comparisons were performed using a pairwise t-test at α = 0.05.
Results
LPD values were observed for E. coli strains that were grown in lettuce but only at 4 °C (119.91 h), 25 °C (1.55 h) and 30 °C (1.30 h), and μmax values for the pathogen increased (P<0.05) as the storage temperature increased from 4 °C (0.002 log CFU/g/h) to 30 °C (0.289 log CFU/g/h) (Table 1). For E. coli in water celery, no growth wasobserved at 4 °C (Table 1). μmax values for E. coli in water celery then increased (P<0.05) when the storage temperature increased from 10 °C (0.002 log CFU/g/h) to 30 °C (0.325 log CFU/g/h), and very short LPD (0.64 h) were observed only at 30 °C(Table 1). However, no E. coli growth in the sprout mix was observed at all temperatures (Figure 1). Instead, the minimal death of E. coli was observed in sprout mixat 4 °C (Figure 1).
Table 1 : Kinetic growth parameters (mean ± SD) calculated by the Baranyi model for pathogenic Escherichia coli growth in lettuce and water celery.
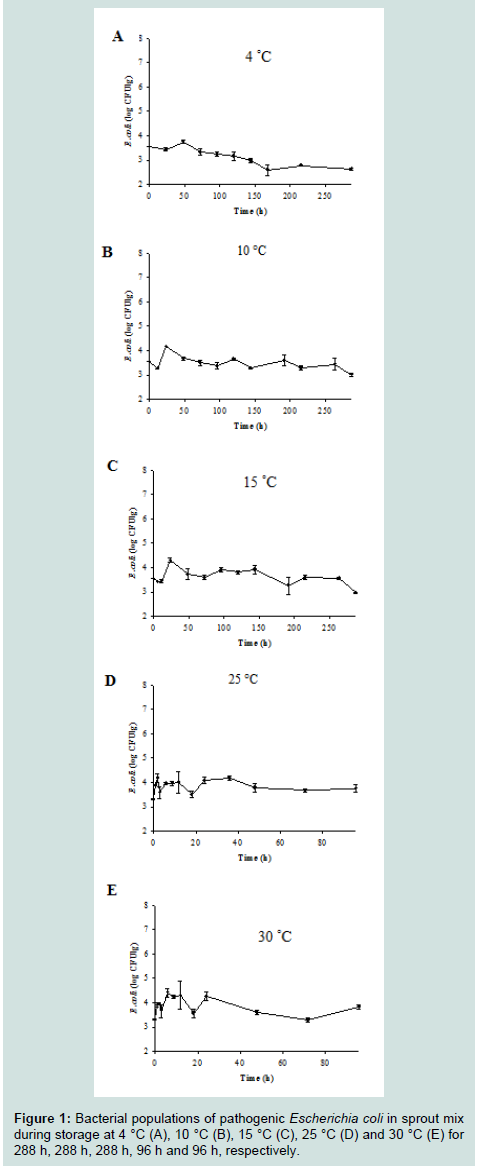
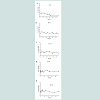
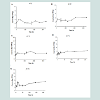
Figure 1 : Bacterial populations of pathogenic Escherichia coli in sprout mix during storage at 4 °C (A), 10 °C (B), 15 °C (C), 25 °C (D) and 30 °C (E) for 288 h, 288 h, 288 h, 96 h and 96 h, respectively.
To evaluate the performance of the mathematical models used in this study, an additional experiment was performed to obtain observed E. coli growth data at 12 °C and 20 °C. To obtain predicted E. coli cell counts, the kinetic parameters (μmax and LPD) were calculated by substituting the specific temperature to the developed model with the square root model, and the kinetic parameters were substituted into the Baranyi model at given condition. The observed values were then compared to the predicted values, and A factor, B factor and RMSE values were then calculated. A factor values were 1.114 (lettuce) and 1.148 (water celery) and B factor values were 1.071 (lettuce) and 0.939 (water celery). RMSE values (lettuce: 0.691; water celery: 0.745) were interpreted that the differences between predicted values and observed values were less than 0.691 log CFU/g in lettuce and 0.745 log CFU/g in water celery.
To describe the kinetic behavior of E. coli during storage, which has changing temperature rather than constant temperature, a simulation of E. coli growth was conducted under changing temperature. The temperature was set to 4.2 °C, 21.2 °C, and 10.5 °C at an interval of 6 h to describe the changes of E. coli cell counts as the temperature changed. The temperature settings were chosen by calculating the minimum, maximum, and mean values for E. coli growth on lettuce (4.1 °C, 21.0 °C, and 10.5 °C) and water celery (4.2 °C, 24.4 °C, and 12.3 °C), which were measured at market displays from six separate locations. Simulated E. coli cell counts at changing temperature are presented in (Figure 2). Under the changing storage temperatures, E. coli grew gradually in both vegetables, and E. coli growth was greater in lettuce samples than when grown in water celery samples, which were also proven by Nmax values in ((Table 1) and (Figure 2)).
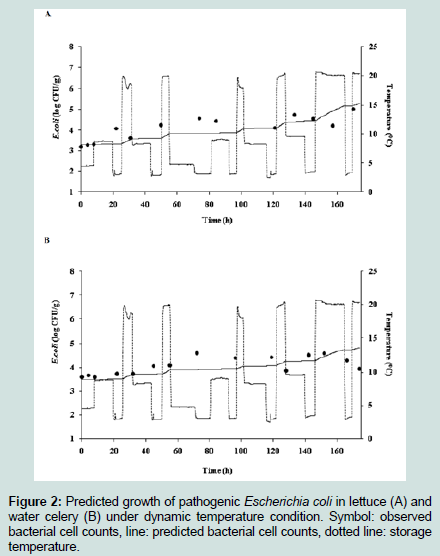
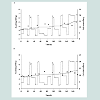
Figure 2 : Predicted growth of pathogenic Escherichia coli in lettuce (A) and water celery (B) under dynamic temperature condition. Symbol: observed bacterial cell counts, line: predicted bacterial cell counts, dotted line: storage temperature.
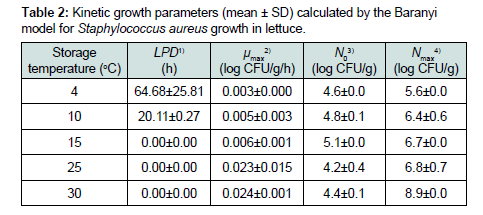
Table 2 : Kinetic growth parameters (mean ± SD) calculated by the Baranyi model for staphylococcus aureus growth in lettuce.
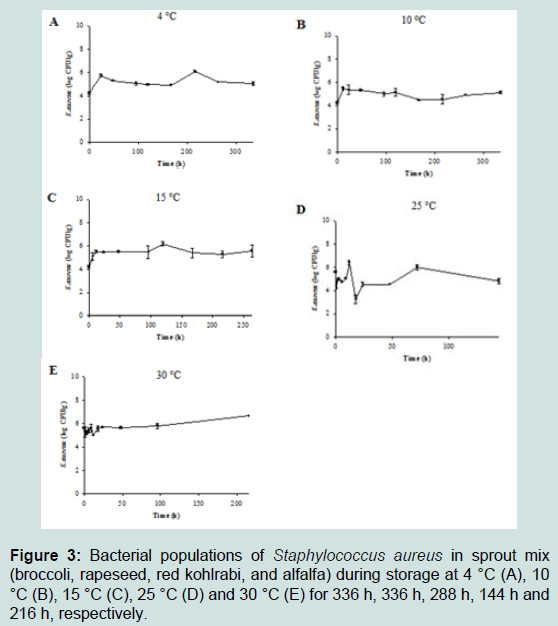
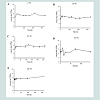
Figure 3 : Bacterial populations of Staphylococcus aureus in sprout mix (broccoli, rapeseed, red kohlrabi, and alfalfa) during storage at 4 °C (A), 10 °C (B), 15 °C (C), 25 °C (D) and 30 °C (E) for 336 h, 336 h, 288 h, 144 h and 216 h, respectively.
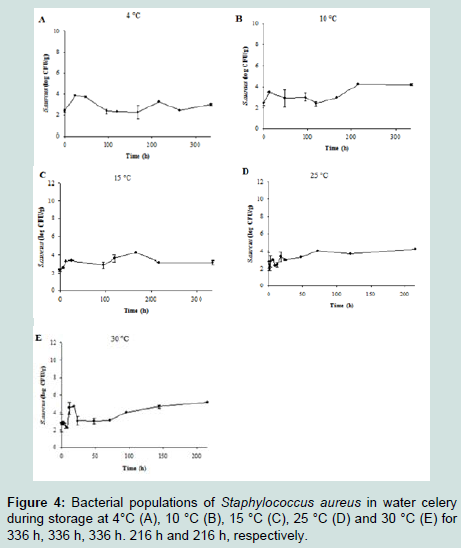
Figure 4 : Bacterial populations of Staphylococcus aureus in water celery during storage at 4°C (A), 10 °C (B), 15 °C (C), 25 °C (D) and 30 °C (E) for 336 h, 336 h, 336 h. 216 h and 216 h, respectively.
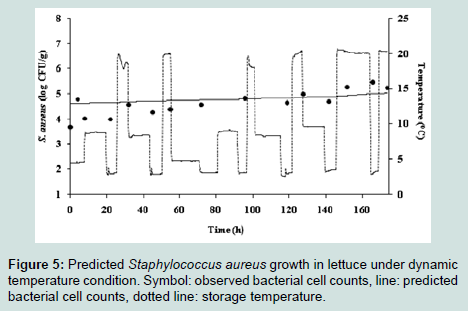
Figure 5 : Predicted Staphylococcus aureus growth in lettuce under dynamic temperature condition. Symbol: observed bacterial cell counts, line: predicted bacterial cell counts, dotted line: storage temperature.
Discussion
Tmin values of developed models were that 3.944 °C (E. coli in lettuce), -6.077 °C (E. coli in water celery) and -6.077 °C (S. aureus in lettuce). These results indicate that the Tmin for the pathogenic E. coli is dependent on vegetable. Ratkowsky et al. previously suggested that the Tmin values for E. coli O157:H7 grown on mechanically tenderized beef was 1.5 °C -4.7 °C, but Huang suggested that the Tmin values were 6.64 °C -8.76 °C [21,22]. Taken together, Tmin values for E. coli can be influenced by food matrix. Since Tmin is the lowest temperature limit theoretically below which the calculated growth rate is close to zero [23], Tmin and minimum growth temperature observed in food can be different such as Tmin value of S. aureus in lettuce -6.077 °C.RMSE values were that 0.691 (E. coli in lettuce), 0.745 (E. coli in water celery) and 0.569 (S. aureus in lettuce). Because NACMCF suggested that more than 1 log growth could be generally considered as a significant change, a mathematical model with less than 1.0 of RMSE could be considered appropriate to describe the kinetic behavior of the pathogenic E. coli in lettuce and water celery at constant temperatures [24]. In previous studies, Perez-Rodriguez et al. and Lee et al. suggested that the performance of developed models were appropriate to assay the temperature requirements for bacterial growth with similar RMSE values [0.300-0.450 for Perez-Rodriguez et al.; 0.326-0.361 for Lee et al. as those of our study [25,26]. Taken together, predictive models should be useful in describing kinetic behavior of foodborne pathogens [27,28].
In the dynamic model, although the S. aureus showed minimal growth in lettuce at changing temperature, the pathogen had very low risk of intoxication because S. aureus produce enterotoxin as they had growth up to 5-6 log CFU/g [29].
Conclusion
E. coli may not grow in commercial sprout mix, but they may grow in lettuce and water celery above at 10 °C as well as changing temperature found in grocery stores. Therefore, storage temperatures for lettuce and water celery should be below 10 °C to prevent E. coli growth on them. Regarding S. aureus, the pathogen may not grow in water celery and sprout mix, and only minimal growth in lettuce for both constant temperature and practical storage temperature, indicating that S. aureus may not be risky pathogen in the vegetables examined in this study.
Acknowledgements
This paper was supported by research grants from the Korea Food Research Institute.References
- Callejon RM, Rodriguez-Naranjo MI, Ubeda C, Hornedo-Ortega R, Garcia-Parrilla MC, et al. (2015) Reported foodborne outbreaks due to fresh produce in the United States and European Union: trends and causes. Foodborne Pathog Dis 12: 32-38.
- De Sao Jose JFB, Andrade NJ, Ramos AM, Vanetti MCD, Stringheta PC, et al. (2014) Decontamination by ultrasound application in fresh fruits and vegetables. Food Control 45: 36-50.
- Oh TY, Kim HJ (2013) Microbiological safety of fresh-cut vegetables and salads. Safe Food 8: 18-27.
- Ziuzina D, Patil S, Cullen PJ, Keener KM, Bourke P (2014) Atmospheric cold plasma inactivation of Escherichia coli, Salmonella enterica serovar Typhimurium and Listeria monocytogenes inoculated on fresh produce. Food Microbiol 42: 109-116.
- Gil MI, Selma MV, Suslow T, Jacxsens L, Uyttendaele M, et al. (2015) Pre- and postharvest preventive measures and intervention strategies to control microbial food safety hazards of fresh leafy vegetables. Crit Rev Food Sci Nutri 55: 453-468.
- Jones LA, Worobo RW, Smart CD (2014) Plant-pathogenic oomycetes, Escherichia coli strains, and Salmonella spp. Frequently found in surface water used for irrigation of fruit and vegetable crops in New York state. Appl Environ Microb 80: 4814-4820.
- Kim JS, Kim J, Kim SJ, Jeon SE, Oh KH, et al. (2014) Characterization of CTX-M-Type extended-spectrum beta-lactamase-producing diarrheagenic Escherichia coli isolates in the Republ+ic of Korea during 2008-2011. J Microbiol Biotechn 24: 421-426.
- Nataro JP, Kaper JB (1998) Microbial and pathogenic contamination of ready-to-eat fresh vegetables in Korea. Clin Microbiol Rev 11: 142-201.
- Fetsch A, Contzenb M, Hartelt K, Kleiser A, Maassene S, et al. (2014) Staphylococcus aureus food-poisoning outbreak associated with the consumption of ice-cream. Int J Food Microbiol 187: 1-6.
- 10. Jung MS (2007) Study on the risk management for risk reduction of Staphylococcus aureus in ready-to-eat foods. The Annual Report of KFDA. 11: 525-527.
- Kim JS, Bang OK, Chang HC (2004) Examination of microbiological contamination of ready-to-eat vegetable salad. J Fd Hyg Safety 19: 60-65.
- Jo MJ, Jeong AR, Kim HJ, Lee N, Oh SW, et al. (2011) Microbiological quality of fresh-cut produce and organic vegetables. Kor J Food Sci Tech 43: 91-97.
- Park HO, Kim CM, Woo GJ, Park H, Lee DH, et al. (2001) Monitoring and trend analysis of food poisoning outbreaks occurred in recent years in Korea. J Fd Hyg Safety 16: 280-294.
- Zeng W, Vorst K, Brown W, Marks BP, Jeong S, et al. (2014) Growth of Escherichia coli O157:H7 and Listeria monocytogenes in packaged fresh-cut romaine mix at fluctuating temperatures during commercial transport, retail storage, and display. J Food Protect 77: 197-206.
- Lee YJ, Jung BS, Yoon HJ, Kim KT, Paik HD, et al. (2014) Predictive model for the growth kinetics of Listeria monocytogenes in raw pork meat as a function of temperature. Food Control 44: 16-21.
- Mcmeekin TA, Brown J, Krist K, Miles D, Neumeyer K, et al. (1997) Quantitative microbiology: a basis for food safety. Emerg Infect Dis 3: 541-549.
- Velugoti PR, Bohra LK, Juneja VK, Huang L, Wesseling AL, et al. (2011) Dynamic model for predicting growth of Salmonella spp. in ground sterile pork. Food Microbiol 28: 796-803.
- Baranyi J, Roberts TA (1994) A dynamic approach to predicting bacterial growth in food. Int J Food Microbiol 2: 277-294.
- Koseki S, Isobe S (2005) Prediction of pathogen growth on iceberg lettuce under real temperature history during distribution from farm to table. Int J Food Microbiol 104: 239-248.
- Mckellar RC, Leblanc DI, Lu J, Delaquis P (2012) Simulation of Escherichia coli O157:H7 behavior in fresh-cut lettuce under dynamic temperature conditions during distribution from processing to retail. Foodborne Pathog Dis 9: 239- 244.
- Ratkowsky DA, Olley J, Mcmeekin TA, Ball A (1982) Relationship between temperature and growth rate of bacterial cultures. J Bacteriol 149: 1-5.
- Huang L (2010) Growth kinetics of Escherichia coli O157:H7 in mechanically-tenderized beef. Int J Food Microbiol 140: 40-48.
- Ross T, Dalgaard P (2004) Modeling microbial responses in food: Secondary models. CRC Series in contemporary food science.
- National Advisory Committee on Microbiological Criteria for Foods (2010) Parameters for determining inoculated pack/challenge study protocols. J Food Prot 73: 140-202.
- Perez-Rodriguez F, Posada-Izquierdo GD, Valero A, Garcia-Gimeno RM, Zurera G (2013) Modelling survival kinetics of Staphylococcus aureus and Escherichia coli O157:H7 on stainless steel surfaces soiled with different substrates under static conditions of temperature and relative humidity. Food Microbiol 33: 197-204.
- Lee J, Skandamis P, Park A, Yoon H, Hwang IG, et al. (2013) Development of mathematical models to predict Staphylococcus aureus growth in sauces under constant and dynamic temperatures. Food Sci Technol Res 19: 331-335.
- Gwak E, Oh M, Park B, Lee H, Lee S, et al. (2015) Probabilistic models to predict Listeria monocytogenes growth at low concentrations of NaNO2 and NaCl in frankfurters. Korean J Food Sci An 35: 815-823.
- Ha J, Gwak E, Oh M, Park B, Lee J, et al. (2016) Kinetic behavior of Salmonella on low NaNO2 sausage during aerobic and vacuum storage. Korean J Food Sci An 36: 262-266.
- Food and Drug Administration (FDA). (2012) Bad bug book (Second edition). Center for Food Safety and Applied Nutrition of the Food and Drug Administration (FDA), MD, USA.