
Journal of Bioanalysis & Biostatistics
Download PDF
Research Article
*Address for Correspondence: Nezamoddin N. Kachouie, Department of Mathematical Sciences, Florida Institute of Technology, University Blvd, Melbourne, USA, E-mail: nezamoddin@fit.edu
Citation: Kachouie NN, Christiani DC. DNA Copy Number Gain in Lung Cancer and Non-Involved Tissue. J Bioanal Biostat 2016;1(1): 5.
Copyright © 2016 Kachouie NN, et al. This is an open access article distributed under the Creative Commons Attribution License, which permits unrestricted use, distribution, and reproduction in any medium, provided the original work is properly cited.
Journal of Bioanalysis and Biostatistics | Volume: 1, Issue: 1
Submission: 16 January, 2016 | Accepted: 02 April, 2016 | Published: 07 April, 2016


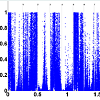
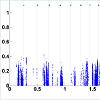
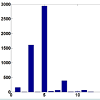
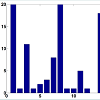
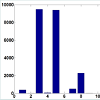 To address this issue, we set a threshold for CN gain. At each probe, all tumor subjects with copy numbers greater than or equal the threshold will be identified. At each probe, a paired t-test is performed based on the paired CN difference of tumor subjects with gained CN and their paired normal tissues' CN. There are 50 tumor subjects with paired normal tissue, however, the number of tumor subjects with gained CN might be different at different probes. The p-values associated with paired t-tests for tumor subjects with gained CN are depicted in (Figure 4). Figure 5 shows the number of probes in each chromosome at significant level of 0.01. We should point out that a p-value is computed for the probes in which at least two (out of 50 tumor subjects) tumor subjects have gained CNs (CNs greater than the threshold). In the next step, the number of probes with significant CN gain in tumor vs. normal for the tumor subjects with gained CNs is controlled for the number of false discovery rates which is depicted in (Figure 6). In comparison with (Figure 3), we can observe that in (Figure 6) we have a much smaller set of probes in each chromosome with significant gained CN in tumor vs. normal tissue. This will considerably improve the identification of genes with significantly gained CNs.
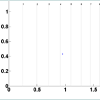
 CN changes can also be caused by phenotypic variation in normal tissues which might not be related to cancer or any other disease. Therefore, in the next step, we investigate any correlation between identified probes with significantly gained CN in tumor subjects and probes with significantly gained CN in normal subjects. To achieve the goal, at each probe the subjects with gained CN in their normal tissue are identified. A paired t-test for normal vs. tumor for normal subjects with gained CN is consequently applied. The p-values associated with the paired t-tests for normal vs. tumor are depicted in (Figure 7). As it can be observed there are a small number of probes with at least two normal subjects (out of 50) with gained CNs. The probes with no p-value (majority of the probes) demonstrate no normal subject with gained CNs (≥ 3) or just one subject for which the paired t-test is not performed (since degree of freedom will be equal to zero). There were just 18 probes including four probes in chromosome 5, five probes in chromosome 14, and nine probes in chromosome 15 with at least two normal subjects with gained CNs. Among them, no probe with significant CN gain for normal tissue (p-value less than or equal 0.01) was identified. Since the FDR threshold is smaller than 0.01, no probe was identified with significantly gained CN in normal tissue in the paired differences of normal vs. tumor (for normal subjects with gained CN) after controlling for FDR. As a result, at the CN gain threshold, no correlation was observed between the significantly gained CN in tumor and significantly gained CN in non-involved tissues.
DNA Copy Number Gain in Lung Cancer and NonInvolved Tissue
Nezamoddin N. Kachouie1* and David C. Christiani2,3
- 1Department of Mathematical Sciences, Florida Institute of Technology, University Blvd, Melbourne, USA
- 2Department of Environmental Health, Harvard School of Public Health, Boston, USA
- 3Department of Epidemiology, Harvard School of Public Health, Boston, USA
*Address for Correspondence: Nezamoddin N. Kachouie, Department of Mathematical Sciences, Florida Institute of Technology, University Blvd, Melbourne, USA, E-mail: nezamoddin@fit.edu
Citation: Kachouie NN, Christiani DC. DNA Copy Number Gain in Lung Cancer and Non-Involved Tissue. J Bioanal Biostat 2016;1(1): 5.
Copyright © 2016 Kachouie NN, et al. This is an open access article distributed under the Creative Commons Attribution License, which permits unrestricted use, distribution, and reproduction in any medium, provided the original work is properly cited.
Journal of Bioanalysis and Biostatistics | Volume: 1, Issue: 1
Submission: 16 January, 2016 | Accepted: 02 April, 2016 | Published: 07 April, 2016
Abstract
Lung cancer is the leading cause of cancer-related death in the United States. Eighty five percent (85%) of lung cancers are non-smallcell (NSCLC). NSCLC remains the number one cause of cancer related mortality for men and women in the U.S and its prevalence continues to increase worldwide. NSCLC has a wide range of patients´ survival and despite potentially curative resection in early-stage, survival remains sub-optimal and recurrence rates are high. Therefore, early detection and staging is crucial to increase the patient´s survival. Copy Number (CN) changes in lung cancer have been shown to be located in certain genomic regions and detection of copy number changes in cancer population can essentially help with the treatment and/or prevention. In turn, identification of genes with significant CN gain can potentially be used for early detection of the disease. One approach is CN analysis of each subject individually, however the results may vary among subjects and it becomes difficult to find the common probes in population analyses. In the proposed approach here, the analysis is performed at the population level directly. We perform genome-wide analyses of CNs in a collection of 50 NSCLC tumors to identify probes with significantly gained CNs. We propose a formal statistical test for CN analysis between lung tumor and its non-involved (normal) tissue over all 50 subjects, subjects with gained CN in tumor, and subjects with gained CN in normal tissue.Introduction
Gene-cancer mapping intends to discover associated genes with cancers and due to advances in high-throughput genotyping, screening for disease loci on a genome-wide scale is now possible. The development of computational methods for human disease gene mapping have prompted recent advances in high-throughput genotyping [1-7]. Characterization of genetic polymorphisms including singlenucleotide-polymorphism (SNP) and CN changes which is associated with genomic mutation of somatic cells holds the potential for cancer diagnosis and cancer stage identification[4-16]. To this end, human gene-cancer mapping has been extensively investigated in the past few years to address cancer susceptibility and its association with SNPs and CN changes. Genome-wide association studies (GWAS) have identified more than one thousand genetic loci associated with many human diseases and traits [17-26].CN changes in NSCLC have been studied in previous research [27-30] however, what causes these changes is still under investigation. Different mechanisms of CN changes are homologous re-combinations and non-homologous mechanisms [31,32]. It has been reported that smoking may be associated with copy number in NSCLC. In the cancer cell population hypoxia may induce CN change, hence cigarette smoking can potentially be considered as an environmental stress on the cells which may lead to CN changes and cause NSCLC. On the other hand, CN change may also be associated with normal phenotypic variation [31,32] and hence it is of great interest to discover any correlation between identified genes with significant CN change in tumor and normal tissues.
To study this, collected CNs from individual subjects can be potentially integrated to discover population patterns. We perform formal test statistics to integrate the population summaries and locate the genes with significant differences in the mean CNs between two populations, i.e. cancer and normal. CN analysis is applied to all subjects, subjects with gained CN in tumor, and subjects with gained CN in normal tissue. This is set up as a multiple testing problem, where p-values are tested for significance. In order to control the global False Discovery Rate (FDR), the significance threshold is adjusted for each chromosome between two populations.
We should point out that the advantage of performing analysis at population level is to discover copy number change patterns which are common among the population. Assessing population patterns from individual copy number change patterns is rather difficult because individual patterns may vary in location and size. Population patterns are important to discover common disease-gene association. However, for personalized medicine, identification of individual patterns is essential. The goal here is to discover population patterns rather than individual ones.
Methods
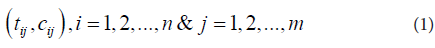
Our interest here is locating probes with significant CN gains. Paired t-statistics was computed at each probe by comparing the group means of the tumor samples and their paired normal tissues as follows.Each chromosome has two arms (arm-p and arm-q) separated at the chromosome centromere. In a dataset consists of n subjects, the data contains n×m pairs for a chromosome of m probes,
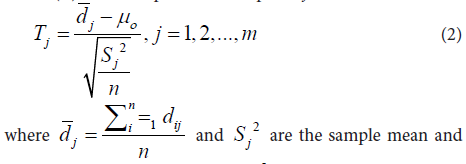
where tij and cij are copy numbers of the tumor and its paired control (normal) tissue at probe j of subject i. First, paired t-tests (T) were computed at each probe j as
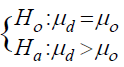
variance of the paired differences dij = tij - cij at probe j, and µº = is the background reference in the null hypothesis:
where µd is the true mean of paired difference d. The unilateral alternative hypothesis is used since the interest here is to discover the copy number gains. We then computed the p values associated with the T tests and adjusted them to control for False Discovery Rate (FDR) using Benjamini and Hochberg (BH) algorithm [33].
To find subjects with amplified copy numbers, we set a copy number gain threshold TA. At each probe, the tumor subjects with copy numbers greater than or equal TA will be identified. At each probe, for each subject with amplified copy number, the copy number of its paired normal tissue will be extracted from the dataset. The paired copy number differences dij = Aij - cij will be computed at each probe j, just for j n subjects with amplified copy numbers. Notice that although the total number of paired subjects n is fixed for all probes (here it is 50), the number of subjects with amplified copy numbers nj (at each probe j) is not fixed and may vary from probe to probe. Hence, the data contains nj ×m pairs for a chromosome of m probes,
where Aij is the amplified copy number of the tumor and Cij is copy number of its paired control (normal) tissue at probe j of subject i. Paired t-tests (T) were computed at each probe j using (3).
Identifying probes with significant copy number amplification by multiple testing
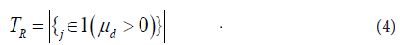
Computed p-values associated with the paired t-tests are adjusted to control the FDR of identified probes with significant copy number change between tumor and normal tissue. Let the number of true detected probes with significant change (by rejecting the null hypothesis) be
and the number of false detected probes with significant change be
Let also the total number of rejections at level α be
The FDR is defined as the expected proportion of falsely rejected hypothesis:
FDR control for the amplified probes is achieved by applying the BH algorithm on the p-values of probes with significantly amplified copy numbers.
Results
A series of 50 snap-frozen tumor samples from nonsmall cell lung cancer (NSCLC) patients (who prospectively enrolled) and their paired specimens of non-neoplastic lung parenchyma as the reference group of copy number estimation were collected from the National Institute of Occupational Health, Oslo, Norway [29,30]. Genome-wide CNs were measured at 262, 565 unequally spaced probes (j) and preprocessed by d Chip [34].T statistics for paired differences of 50 tumor samples and their paired normal tissue is calculated at each probe using (2). (Figure 1) shows the computed p-values for paired t-tests (with 49 degrees of freedom). The number of probes in each chromosome with significant level of 0.01 is depicted in (Figure 2). As we can observe, there are several of thousands probes at this significant level. To control for FDR, we perform multiple testing by applying the BH algorithm to all probes of each chromosome separately. The number of probes with significant copy number gain in tumor vs. normal (paired differences) after controlling for FDR is depicted in (Figure 3). There are still several of thousands probes identified with significant CN gain after controlling for multiple testing. These probes are associated with several genes and therefore genes significantly associated with the NSCLC are precluded among many other genes and cannot be exclusively identified.
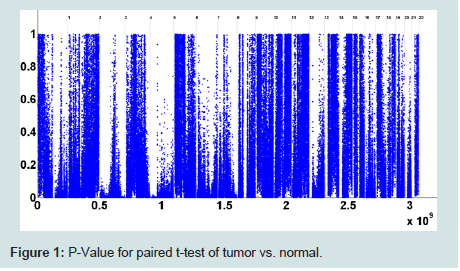
Figure 1 : P-Value for paired t-test of tumor vs. normal.
<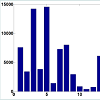
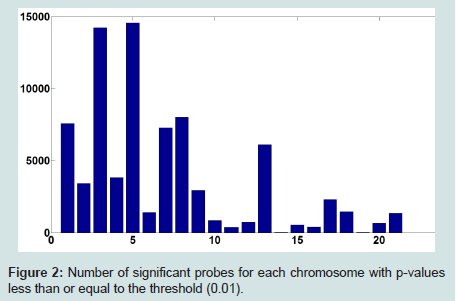
Figure 2: Number of significant probes for each chromosome with p-values less than or equal to the threshold (0.01).
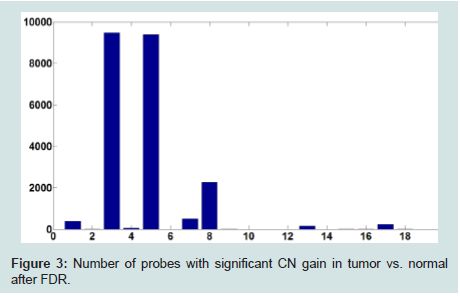
Figure 3: Number of probes with significant CN gain in tumor vs. normal after FDR.
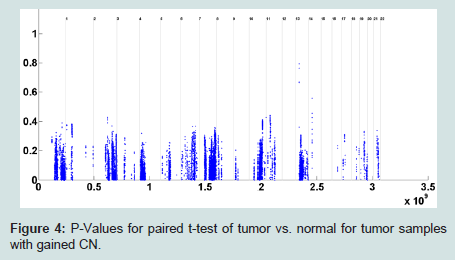
Figure 4: P-Values for paired t-test of tumor vs. normal for tumor samples with gained CN.
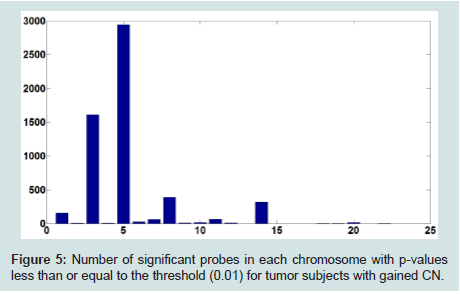
Figure 5: Number of significant probes in each chromosome with p-values less than or equal to the threshold (0.01) for tumor subjects with gained CN.
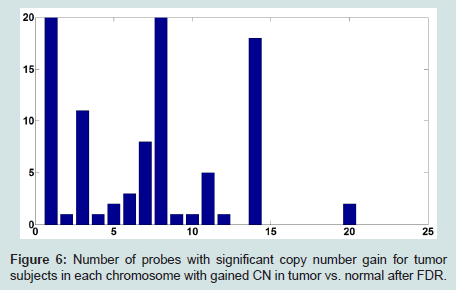
Figure 6: Number of probes with significant copy number gain for tumor subjects in each chromosome with gained CN in tumor vs. normal after FDR.
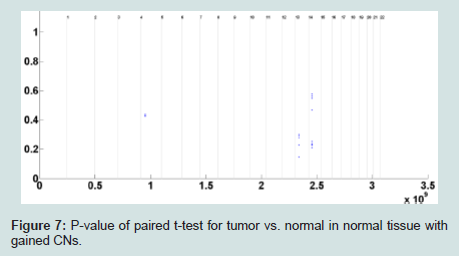
Figure 7: P-value of paired t-test for tumor vs. normal in normal tissue with gained CNs.
Discussion
In this paper, the probes with significant gained CNs in paired t-test of tumor vs. non-involved in tumor subjects with gained CNs in lung cancer data were identified. In place of performing t-tests comparing mean CNs of tumor subjects and normal tissues, we rather performed paired t-tests comparing tumor subjects with their paired normal (non-involved) tissues. To identify the probes with significant gained CNs, multiple testing was applied to control the FDR. The large number of probes with significantly gained CN precludes the identification of genes with significantly gained CNs associated with NSCLC. This issue was addressed by identifying the tumor subjects with gained CNs at each probe and then performing paired t-tests for tumor vs. its paired normal for tumor subjects with gained CNs. It was followed by multiple testing to control for FDR. In this way a small set of probes in each chromosome was identified with significantly gained CNs in tumor vs. normal. To discover any potential correlation between the probes with significantly gained CNs in normal tissue and tumor tissue, the normal subjects with gained CNs was identified and paired t-test for normal vs. tumor was performed at each probe. After application of multiple testing to control FDR, no probe with significantly gained CN among normal tissues in normal vs. tumor paired t-test was identified. Hence, no correlation between probes with significantly gained CNs in tumor tissue and noninvolved tissue at CN gain threshold of 3 was observed. The threshold of 3 is rather intuitively chosen based on 50% copy number gain over normal copy number of two (2). The future work will be conducted to investigate the threshold selection.The results agree with the previous research [28,29] to identify genes in chromosomes 1 to 12,14 and 20, but probes in chromosomes 13,16,17,18,19,21 and 22 were not identified in our analysis at gain threshold of 3 and FDR of 0.01. Among these chromosomes, probes in chromosomes 13,17,18 and 22 can be potentially identified at lower gain threshold and FDR levels. On the other hand, oncogenes in chromosomes 16,19 and 21 were reported for a very small proportion of lung cancer patients in previous studies, and that could be potential reason for lack of identification of them in a sample of 50 subjects in our analysis. These issues will be studied in our future work. We will also investigate the influence of gain threshold on the potential correlation of identified probes with gained CN in tumor tissues and identified probes with gained CN in normal tissues in the CN analysis using paired differences of tumor vs. normal.
Acknowledgements
We would like to thank Dr. Aage Haugen of the Norway IOSH and Dr. Lodve Stangeland of Haukeland University Hospital, Norway for providing the dataset.This research was partially supported by Community Foundation for Brevard Medical Research Grants.References
- Muggeo VM, Adelfio G (2011) Efficient change point detection for genomic sequences of continuous measurements. Bioinformatics 27: 161-166.
- Wang Y, Wu C, Ji Z, Wang B, Liang Y (2011) Non-parametric change-point method for differential gene expression detection. PLoS One 6: e20060.
- Lai Y, Zhao H (2005) A statistical method to detect chromosomal regions with DNA copy number alterations using SNP-array-based CGH data. Comput Biol Chem 29: 47-54.
- Li W, Lee A, Gregersen PK (2009) Copy-number-variation and copy-numberalteration region detection by cumulative plots. BMC bioinformatics 10 Suppl 1: S67.
- Takeuchi I, Tagawa H, Tsujikawa A, Nakagawa M, Katayama-SuguroM, et al. (2009) The potential of copy number gains and losses, detected by array-based comparative genomic hybridization, for computational differential diagnosis of B-cell lymphomas and genetic regions involved in lymphomagenesis. Haematologica 94: 61-69.
- Pollack JR, Perou CM, Alizadeh AA, Eisen MB, Pergamenschikov A, et al. (1999) Genome-wide analysis of DNA copy-number changes using cDNA microarrays. Nat Genet 23: 41-46.
- Carter NP (2007) Methods and strategies for analyzing copy number variation using DNA microarrays. Nat Genet 39 (7 Suppl): S16-S21.
- Li C, Wong WH (2003) DNA-Chip analyzer (dChip). In: Parmigiani G, Garett ES, Irizarry RA, Zeger SL (Eds). The analysis of gene expression data: methods and software, New York, Springer, pp. 120-141.
- Davies H, Dicks E, Stephens P, Cox C, Teague J, et al. (2006) High throughput DNA sequence variant detection by conformation sensitive capillary electrophoresis and automated peak comparison. Genomics 87: 427-432.
- Olshen AB, Venkatraman ES, Lucito R, Wigler M (2004) Circular binarysegmentation for the analysis of array-based DNA copy number data. Biostatistics 5: 557-572.
- Hsu L, Self SG, Grove D, Randolph T, Wang K, et al. (2005) Denoising arraybased comparative genomic hybridization data using wavelets. Biostatistics 6: 211-226.
- Kallioniemi A, Kallioniemi OP, Sudar D, Rutovitz D, Gray JW, et al. (1992) Comparative genomic hybridization for molecular cytogenetic analysis of solid tumors. Science 258: 818-821.
- Kallioniemi OP, Kallioniemi A, Kurisu W, Thor A, Chen LC, et al. (1992) ERBB2 amplification in breast cancer analyzed by fluorescence in situ hybridization. Proc Natl Acad Sci U S A 89: 5321-5325.
- Koski TA, Lehtonen HJ, Jee KJ, Ninomiya S, Joosse SA, et al. (2009) Array comparative genomic hybridization identifies a distinct DNA copy number profile in renal cell cancer associated with hereditary leiomyomatosis and renal cell cancer. Genes chromosomes Cancer 48: 544-551.
- Oga A, Uchida K, Nakao M, Kawauchi S, Furuya T, et al. (2011) Loss of 6q or 8p23 is associated with the total number of DNA copy number aberrations in adenoid cystic carcinoma. Oncol Rep 26: 1393-1398.
- Thomas R, Seiser EL, Motsinger-Reif A, Borst L, Valli VE, et al. (2011) Refining tumor-associated aneuploidy through ‘genomic recoding’ of recurrent DNA copy number aberrations in 150 canine non-Hodgkin lymphomas. Leuk Lymphoma 52: 1321-1335.
- Margulies M, Egholm M, Altman WE, Attiya S, Bader JS, et al. (2005) Genome sequencing in microfabricated high-density picolitre reactors. Nature 437: 376-380.
- Mardis ER (2008) Next-generation DNA sequencing methods. Annu RevGenomics Hum Genet 9: 387-402.
- Ansorge WJ (2009) Next-generation DNA sequencing techniques. NBiotechnol 25: 195-203.
- Eichler EE, Flint J, Gibson G, Kong A, Leal SM, et al. (2010) Missing heritability and strategies for finding the underlying causes of complex disease. Nat Rev Genet 11: 446-450.
- Hindorff LA, Sethupathy P, Junkins HA, Ramos EM, Mehta, JP, et al. (2009) Potential etiologic and functional implications of genome-wide association loci for human diseases and traits. Proc Natl Acad Sci U S A 106: 9362-9367.
- Li B, Leal SM (2008) Methods for detecting associations with rare variants for common diseases: application to analysis of sequence data. Am J Hum Genet 83: 311-321.
- Madsen BE, Brownin SR (2009) A groupwise association test for rare mutations using a weighted sum statistic. PLoS Genet 5: e1000384.
- Morgenthaler S, Thilly WG (2007) A strategy to discover genes that carry multi-allelic or mono-allelic risk for common diseases: a cohort allelic sums test (CAST). Mutat Res 615: 28-56.
- Li B, Leal SM (2009) Discovery of rare variants via sequencing: implications for the design of complex trait association studies. PLoS Genet 5: e1000481.
- Price AL, Kryukov GV, de Bakker PI, Purcell SM, Staples J, et al. (2010) Pooled association tests for rare variants in exon-resequencing studies. Am J Hum Genet 86: 832-838.
- Kim TM, Yim SH, Lee JS, Kwon MS, Ryu JW, et al. (2005) Genome-widescreening of genomic alterations and their clinicopathologic implications in non-small cell lung cancers. Clin Cancer Res 11: 8235-8242.
- Weir BA, Woo MS, Getz G, Perner S, Ding L, et al. (2007) Characterizing the cancer genome in lung adenocarcinoma. Nature 450: 893-898.
- Huang YT, Lin X, Liu Y, Chirieac LR, McGovern R, et al. (2011) Cigarette smoking increases copy number alterations in nonsmall-cell lung cancer. Proc Natl Acad Sci U S A 108: 16345-16350.
- Huang YT, Lin X, Chirieac LR, McGovern R, Wain JC, et al. (2011) Impact on disease development, genomic location and biological function of copy number alterations in non-small cell lung cancer. PloS One 6: e22961.
- Henrichsen CN, Chaignat E, Reymond A (2009) Copy number variants,diseases and gene expression. Hum Mol Genet 18 (R1): R1-R8.
- Bailey JA, Kidd JM, Eichler EE (2008) Human copy number polymorphic genes. Cytogenet Genome Res 123: 234-243.
- Benjamini Y, Hochberg Y (1995) Controlling the false discovery rate: a practical and powerful approach to multiple testing. J R Stat Soc 57: 289-300.
- Zhao X, Li C, Paez JG, Chin K, Jänne PA, et al. (2004) An integrated view of copy number and allelic alterations in the cancer genome using single nucleotide polymorphism arrays. Cancer Res 64: 3060-3071.