
Research Article
Synthesis and Characterization of Porphyrin-Functionalized Shell-Isolated GoldNanoparticles for Metal Ion Detection
Jiang W1,2, Yin Y1, Sapkota R1, Chen L1, Hu J1 and Rayson GD1*
- 1Department of Chemistry and Biochemistry, New Mexico State University, USA
- 2Department of Civil Engineering, New Mexico State University, USA
*Address for correspondence: Rayson GD, Department of Chemistry and Biochemistry, New Mexico State University, Las Cruces, NM, 88003, USA, E-mail: gdrayson@nmsu.edu
Citation: Jiang W, Yin Y, Sapkota R, Chen L, Hu J, et al. Synthesis and Characterization of Porphyrin-Functionalized Shell-Isolated Gold Nanoparticles for Metal Ion Detection. J Analyt Molecul Tech 2018;3(1): 7.
Journal of Analytical & Molecular Techniques | ISSN: 2474-1914 | Volume: 3, Issue: 1
Submission: 01 August, 2018| Accepted: 04 Septmber, 2018 | Published: 10 September, 2018
Copyright: © 2018 Jiang W. This is an open access article distributed under the Creative Commons Attribution License, which permits unrestricted use, distribution, and reproduction in any medium, provided the original work is properly cited.
Abstract
Porphyrins provide a versatile spectroscopic probe for the detection of toxic heavy metal ions. Chelation with transition metals can result in measurable changes in their spectral signatures by absorbance, fluorescence, and Raman scattering. These can be amplified by near-by interactions with gold nanoparticles. Synthesis of silica coated gold nanoparticles functionalized with 9,10,15,20-tetrakis (4-aminophenyl 1)-21H,23H-porphyrin (TAPP) with an undecyl link is described. This material was characterized for potential detection of Zn2+, Cu2+, and Cd2+ in aqueous solutions. Metal-ion dependent shifts in the Soret absorption band were distinguished using Principal Component Analysis (PCA). Detection by fluorescence for each metal ion using this material was observed at concentrations of 1.5 x 10⁻⁵ M. Finally, a Raman enhancement factor of 5.7 was observed.
Keywords
Sensor heavy metal ions; Fluorescence; Functionalized gold nanoparticles; Porphyrin
Introduction
Small amounts of certain heavy metals are essential for a healthy life. However, these same metal ions can be problematic at higher concentration (e.g. Zinc and Copper) [1]. Other heavy metals are extremely toxic even at very low concentrations (e.g. Cadmium) [2]. Heavy metals are also widely used in industrial processes (e.g. Cadmium in electroplated steel and pigments in plastics) [3]. Because metals are not biodegradable, they remain in the environment and accumulate in the food chain. For this reason, organizations worldwide have strictly defined the concentration limits of heavy metals in drinking water [4,5].
Currently, the most common methods for trace heavy-metal ion determination include Atomic Absorption/Emission Spectrometry (AAS/AES) [6,7], inductively coupled plasma-mass spectrometry (ICP-MS) [8], and Mass Spectroscopy (MS) [9]. While each exhibit high sensitivity and low detection limits [6], these techniques are not amenable for in situ monitoring [6-8]. Selective chelators provide the potential for metal detection using absorption or fluorescence detection [10]. Unfortunately, these often involve metal ion specific reagents that may leach into the measured solution. Thus, considerable effort has been made to develop simple and inexpensive colorimetric and fluorometric techniques for heavy-metal detection [10-14].
Sensors based on heavy metal ion induced changes in fluorescence signals have been widely studied [15,16]. For example, Wu et al. developed a phenylene-bridged bis(pyrrol-2-ylmethyleneamine)Zn2+ complex to detect Hg2+ measuring fluorescence quenching upon metal ion exchange. The limitation of this strategy was higher detection limits and release of toxic Zn2+ [17]. Additionally, Basu et al. described using 4,4-dimethyl-4H-5-oxa-1,3,dithia-6,11-diazacyclopenta[α]anthracen-2one for Pb2+ fluorescence detection [18]. However, many of these systems are limited in practical use due to poor aqueous solubility, short emission wavelengths, and weak fluorescence intensities [12].
Using functionalized metal nanoparticles (NPs) for sensing applications has attracted more interest due to optical properties such as strong emission and stability to photobleaching [5,19]. He et al. described a system for Cu2+ detection using gold NPs and modulation of the photoluminescence quenching efficiency between a perylene bisimide chromophore and the NPs [20]. Fluorescence quenching of pyridyl moieties coordinated to gold NPs was negated by Cu2+ through coordination of Cu2+ to the pyridyl moiety. The sensor provided a detection limit of 1.0 μM for Cu2+. Unfortunately, an organic solvent system was required [20]. An example of multi element detection includes the work of Hung et al. They reported a label-free Au NPs based assay for Hg2+, Pb2+, and Ag2+ ions. The key for this assay was the competition between the heavy-metal ions and gold NPs for their binding toward alkanethiols. The presence of strong Hg2+-S bonds alleviated the extent of 4-mercaptobutanol induced aggregation of the gold NPs, resulting in a declining ratio of the absorptivities at 650 to 520 nm of the gold NP solution [21]. These systems used for heavy metal detection often need a complex labeling procedure and most of them can only be applied to detect only a single targeted heavy metal ion. Additionally, they suffer from unavoidable aggregation of metal NPs by many environmental factors such as salts and organic molecules, which often leading to false positive results and poor reproducibility [20,21].
Shell isolated gold nanoparticles were first used in Surface-Enhanced Raman Scattering (SERS) by Li et al. in 2010 [22]. The ultrathin silica shell coated gold NPs significantly increased substrate generality of SERS signals [22-24]. 1) The gold NPs provide Raman signal enhancement; 2) the silica shell prevents the NPs from aggregating and direct contacting with the probed material. The silica shell can be modified using silane coupling agents [25-28]. The addition of functional groups to the surface of these silica-coated gold NPs may enable generation of selective spectroscopic sensors. Work by Cho et al. indicated the feasibility of porphyrin functionalized Au@SiO2 nanoparticles [14]. They indicated high selectivity for Hg2+ ion resulting in a red shifted Soret absorption band and fluorescence quenching by mon para benzyl tetraphenyl porphyrin moiety linked to the silicate using an amino propyl-triethoxysilane bridge. They reported Hg2+ detection limit of 1.2 ppb in water with no indicated interferences [14].
As indicated above, porphyrins are a group of macrocyclic compounds containing four pyrrole rings linked by methyne bridges. Additionally, substitutions at the α, β, γ, and δ positions with varied functional groups can customize the chelation and spectroscopic properties e.g. [14]. The porphyrin nitrogen nucleus is a tetradentate ligand enabling coordination with other transition metal ions (e.g. Cu2+, Zn2+). When the metal complex is formed, two protons are displaced from the pyrrole nitrogen atoms by the divalent metal ion, such as Zn2+. This can result in measurable spectral shifts in the Soret band, a very strong and characteristic absorption bands in the region from 400 to 500 nm. The molar absorptivity for these compounds have been reported as large as 105 [28]. The Soret band is therefore widely used for the determination of metal ions and other ions by spectrophotometric method [28-32]. It was then hypothesized modification of silica coated gold NPs with a porphyrin chelator could enable sensitive and selective detection of transition metal ions in solution using molecular absorption Additionally, such a sensing agent could use fluorescence and Raman scattering as complementary detection modes.
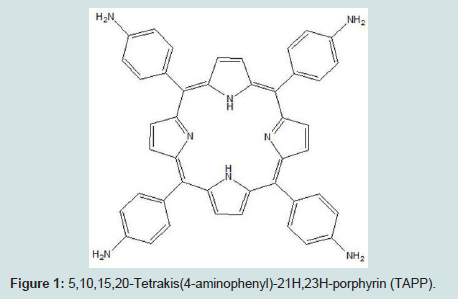
5,10,15,20-Tetrakis(4-aminophenyl)-21H,23H-porphyrin (TAPP) is a porphyrin with aniline groups in the α, β, γ, and δ positions (Figures 1). The versatility of the para amine groups for chemical linking to the silica surface was a consideration in its selection [14]. Another was the enhanced spectroscopic sensitivity offered by the extended conjugation. TAPP functionalized shell isolate gold NPs were investigated for use in a sensing substrate for determination of heavy metals in aqueous solutions using absorbance, fluorescence, and SERS.
Material and Methods
Chemicals and apparatus
Chloroauric acid (HAuCl4) was acquired from Strem Chemicals Inc. (Newburyport, MA), 11-(triethoxysilyl) Undecanal (95%) was purchased from Gelest Inc. (Morrisville, PA). The (3-methylaminopropyl) trimethoxysilane (3MAP-TMOS, 97%), 4-acetoamidobenzaldehyde (technical grade), propionic acid (>99.5%), pyrrole (98%), and trifluoroacetic acid (TFA, 99%) were purchased from Sigma-Aldrich (St. Louis, MO). Methanol (99.9%) and dichloromethane (99.9%) were obtained from Fisher Scientific (Hampton, NH). The ethanol (Absolute anhydrous) was purchased from Pharmco-Aaper (Shelbyville, KY). All chemicals were used as received.
Fluorescence experiments were performed using a Cary Eclipse Fluorimeter (Varian, Santa Clara, CA). UV-VIS absorption measurements were made using a Cary 100 (Varian, Santa Clara, CA). Raman scattering measurement used an Advantage 200A Raman spectrometer (DeltaNu, Laramie, WY) equipped with a He/Ne laser emitting at 632.8 nm (4-mW laser power). The spectral resolution was low, and accumulation time was set to 3s. 1HNMR was performed using an Oxford 300 MHZ (Varian, Palo Alto, CA). Transmission electron microscopy (TEM) was performed on a transmission microscope (H-7650, Hitachi High-Technologies Corp, Pleasanton, CA. operated at 80kv). The samples for TEM analysis were prepared by pipetting 25 μL of the colloidal solutions onto standard carboncoated copper grids.
Data analysis
Principle Components Analysis (PCA) is probably the most widely used multivariate chemometric technique. It is a standard tool in modern data analysis which has been used in diverse fields [33,34]. PCA is designed to extract new uncorrelated variables (components) from the original variables. The new components are linear combinations of the original variables. The goal of PCA is to reduce data complexity and identify the most meaningful components to reexpress a data set [35,36].
For example, a data set has a dimension of m×n, m is the number of samples, n is the number of variables used to describe each sample, i.e. absorbance at each wavelength. The variances between these m samples can then be represented by n1 (n1<n) orthogonal principle components. Each component is the linear combination of the original variables [36]. In comparison to the large number of original variables (n), the new principle components (n1) are fewer, thus enabling analysis of the m samples using those variables sufficient to represent the original data set.
Experiment
Synthesis of silica coated gold NPs
Gold NPs were prepared using Fren’s method [37]. Briefly, 1.4 mL of 39 mM tri-sodium citrate (Na3C6H5O7) was added to 200 ml of 0.29-mM chloroauric acid (HAuCl4) which was stirred and heated to boiling. The mixture was further stirred and refluxed an additional 40 min and cooled to room temperature. To obtain clean gold NPs, 10 mL aliquots were then transferred to 13 mL test tubes and centrifuged at 4,500 rpm for 30 min. Following removal of the supernatant, the resulting Au NPs were washed with deionized water and centrifuged. The supernatant was again removed and clean to obtain concentrated Au NPs. This method was used through this study to collect clean NPs and will be subsequently referred as the centrifuge method.
A layer of SiO2 was then deposited onto a sample of the Au NPs using the procedure described by Liz-Marz’an and Mulvaney [38]. This involved adding 0.4 mL of 1-mM (3-methylaminopropyl) trimethoxysilane (3MAP-TMOS), to a 30-mL aliquot of the prepared Au NP solution described above. After stirring 15 min at room temperature (25 °C), 3.2 mL of a 0.54% sodium silicate (pH= 9.5-11.0) was added and the resulting solution stirred for an additional 3 mins at 25 °C. This was then heated to 90 °C in a water bath and stirred for an additional 2 hours. The reaction was quenched by placing it in ice water. The resulting silica coated Au NPs (Au@SiO2 core/shell NPs) were collected using the centrifuge method described above. Accordingly, all materials were washed twice before further treatment.
Synthesis of 5,10,15,20-Tetrakis(4-aminophenyl)-21H,23HPorphyrin (TAPP)
5,10,15,20-Tetrakis(4-aminophenyl)-21H,23H-porphyrin (TAPP) was synthesized according to the procedure described by Noji [39]. Initially, 5,10,15,20-Tetrakis(4-acetoamidophenyl)- 21H,23H-porphine (TAAPP) was synthesized as a precursor: using a round-bottom flask, 4-acetoamidobenzaldehyde (7.5 g, 47 mmol) was dissolved in 200 ml propionic acid, and the solution refluxed. Pyrrole (3.0 g, 45 mmol) was added, and the mixture refluxed for 6 h under ambient condition. After cooling to room temperature, the insoluble solid was collected using paper filtration. The residual solid was purified by precipitation with dichloromethane/methanol (1:1) to yield the characteristic purple solid [39]. The solid was dried in vacuo overnight.
5,10,15,20-Tetrakis(4-aminophenyl)-21H,23H-porphyrin (TAPP) was synthesized by dissolving TAAPP in trifluoroacetic acid (30 mL) and distilled water (30 mL). The solution was heated to 100 °C while stirring for 6 h, then cooled to room temperature. The solution was evaporated in vacuo to half the original volume. The residual solution was neutralized using dipotassium carbonate (1 M). The product was then extracted from the aqueous phase with dichloromethane and dried using anhydrous sodium sulfate. After solvent removal, the residue was further purified by column chromatography (silica gel, chloroform/ethyl acetate=1:1 (v/v)) to yield a purple solid. The solid was subsequently dried in vacuo overnight.
Synthesis of TAPP attached silica coated gold NPs
To attach TAPP onto the silica shell, a TAPP-siloxy conjugate was synthesized. In a round bottomed flask, TAPP (50 mg, 0.07 mmol) and 11-(triethoxysilyl) undecanal (101 L, 0.28 mmol, 4 equivalents) were taken and dissolved in 2 mL of acetonitrile at 0 °C. Then NaCNBH3 (53 mg, 0.84 mmol, 12 equivalents) was added drop wise. The pH of the solution was maintained at 6.5 using glacial acetic acid. The reaction mixture was then stirred at room temperature for 4 h maintaining the pH. After 4 h, ice cold water (5 mL) was added. Dark solid precipitate was filtered as the product (95 mg, 0.048 mmol, 70%).
Clean and concentrated Au@SiO2 core/shell NPs from section 3.1 were placed directly into a round bottom flask. An additional 5 mL water and 10 mL ethanol were used to further dilute the solution. Then 0.3 mL 10 mM acetate buffer (pH=4.7) was added into the mixture with stirring. Subsequently, 0.75 mL 2.7×10⁻⁴ M TAPP siloxy conjugate was added, the reaction required 5 h. To get clean TAPP attached SiO2@Au NPs, the centrifuge method was used.
It should be noted the present work differs from that described previously by both the length of the linking molecular chain (i.e. 11 carbons compared to three carbons) and the presence of the bridging moiety at all four phenyl rings (i.e. α, β, γ, and δ locations) compared to the mono substituted isomer [14].
TAPP attached silica coated gold NPs react with copper, zinc, and cadmium
TAPP attached Au@SiO2 core/shell NPs were then reacted with metal ions. For easier measurement, the previous mixture in the last step from section 3.3 was not centrifuged and cleaned. Instead, after 5 h reaction, 0.05 mL 0.5M NaOH solution was added with stirring. After 5 mins, 0.05 mL of 5.0×10⁻³ M Cu2+ was added. The mixture reacted for an additional 5 h with stirring at room temperature. Clean, concentrated product was subsequently obtained using the centrifuge method. Zn2+ and Cd2+ solutions were treated using the same procedure.
Results and Discussion
Characterization of the synthesized silica coated gold NPs
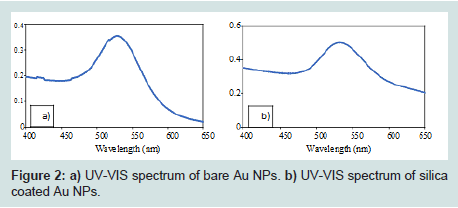
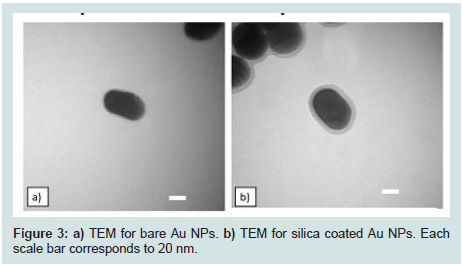
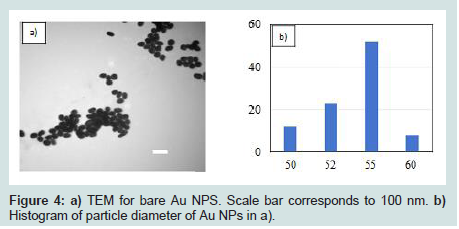
Generation of Au NPs and Au@SiO2 core/shell NPs were spectroscopically confirmed by the appearance of an absorption band at 540 nm in their UV-VIS spectra (Figures 2). This band corresponds to Au NPs ranging in size from 50 to 60 nm in diameter [40]. High-resolution Transmission Electron Micrographs (TEM) for Au NPs and Au@SiO2 core/shell NPs are shown in (Figures 3). TEM micrographs indicated Au particle with a diameter about 55 nm. Analysis of similar TEM of Au NPs (Figures 4a) yielded a histogram shown in (Figures 4b), confirmed a medium particle diameter of 55 nm. Reveals the presence of a silica layer following the deposition procedure described (Figures 3). TEM image of the Au@SiO2 core/shell NPs indicated a SiO2 layer thickness of approximately 5 nm.
The concentration of Au NPs was determined by using the Beer-Lambert relationship, A=εbc, where A is the measured absorbance, ε is the wavelength-dependent absorptivity coefficient, b is the path length, and c is the analyte concentration. The measured absorbance for diluted Au NPs at 540 nm was 0.274. 55 nm Au NPs have been reported to exhibit a molar absorptivity at 540 nm of 3.0×10¹⁰ M-1cm-1 [41]. It is therefore possible to calculate the mass concentration of coated Au-NPs of this dimension using the measured absorbance. Given a 20-fold dilution of the original 1.8×10⁻¹⁰ M (i.e. 1.1×10¹⁴ NPs per liter) solution and assuming a uniform diameter of 55 nm (Figures 4), the mass of one Au NP can be calculated as 1.7×10⁻¹⁵ g.
The mass concentration of for the coated Au NPs was 1.9×10⁻⁴ g/mL. To verify this result, gravimetric was used. 0.058 mM (1.65×10⁻³ g) Au was reduced to Au NPs (section 3.1), and the final volume of Au NPs solution for UV-VIS analysis was 4 mL, therefore, the mass concentration can be calculated as 4.1×10⁻⁴ g/mL. The mass concentration from absorbance method is more reasonable because of sample losses during solution centrifuge and transfer. The mass concentration for the Au NPs solution after clean and concentrate was 1.9×10⁻⁴ g/mL.
Characterization of the synthesized silica coated gold NPs
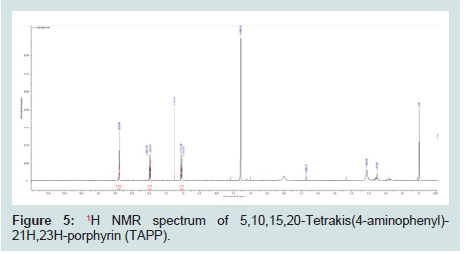
Following TAPP synthesis, the compound was confirmed by 1HNMR (Figures 5). 1HNMR (CDCl3, 400 MHZ, TMS, RT); δ/ppm = 8.90 (8H, s, NH2), 8.0 (8H, d, J=0.03, phenol), 7.04 (8H, d, J=0.03, phenol).
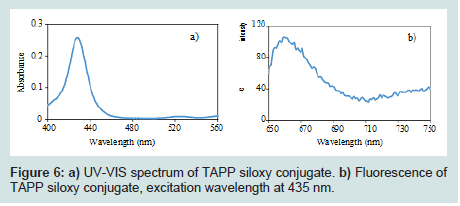
The TAPP siloxy conjugate was analyzed by UV-VIS and Fluorescence (Figures 6). The absorption band in UV-VIS spectrum from 400-450 nm agrees with porphyrin’s Soret band (Figures 6a). The fluorescence spectrum shows that the TAPP siloxy conjugate exhibits an emission band from 650-690 nm with 435 nm excitation (Figures 6b).
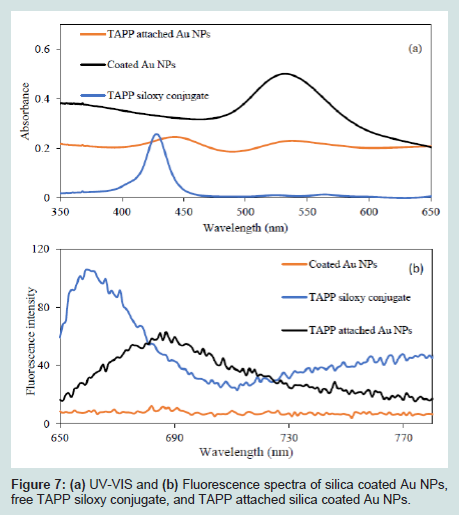
To determine TAPP attachment to the surface of Au@SiO2 core/shell NPs, UV-VIS and Fluorescence spectra were recorded. (Figures 7a) shows comparison of UV-VIS spectra of Au@SiO2, TAPP siloxy conjugate and the TAPP attached Au@SiO2 core/shell NPs. For the spectrum of the TAPP attached particles, two absorption bands are readily visible (440 nm and 532 nm). The band at 532 nm was from the Au@SiO2, the new absorption band at 440 nm was attributed to TAPP absorption. (Figures 7b) shows a comparison of fluorescence spectra of Au@SiO2, TAPP siloxy conjugate, and TAPP attached Au@SiO2, with 435 nm excitation. There was no observed fluorescence signal from unmodified Au@SiO2. The fluorescence spectrum from the free TAPP siloxy conjugate exhibited a peak at 660 nm. After attaching TAPP to the Au@SiO2 core/shell NPs, the maximum fluorescence signal shifted to 685 nm, which can result from energy transfer from the TAPP to the Au NPs (Figures 7) [42].
From UV-VIS absorbance and fluorescence spectra, TAPP was attached to the surface of Au@SiO2 core/shell NPs. Subsequently, the concentration of the TAPP attached to the silica shell after reaction was calculated based on Stern-Volmer equation (Equation 1), because Au@SiO2 NPs quench the fluorescence intensity of TAPP when they were mixed together.
Fo/F = 1+Kq[Q](1)
(F0 is the fluorescence intensity without quencher, F is the fluorescence intensity with quencher, Kq is the Stern-Volmer quenching constant, [Q] is the concentration of quencher).
The Stern-Volmer quenching constant was calculated to be 1.9 using a series of Au@SiO2 core/shell NPs (quencher) mixed with TAPP siloxy conjugate (fluorophore) solution. The final concentrations of Au@SiO2 core/shell NPs were: 3.0×10⁻⁶, 6.0×10⁻⁶, 9.0×10⁻⁶, 12.0×10⁻⁶, and 15.0×10⁻⁶ g/mL. The final concentration of TAPP siloxy conjugate was 2.7×10⁻⁸ M. These solutions were analyzed by fluorescence and the concentration of TAPP on the silica shell was 2.5×10⁻⁸ M.
Raman spectroscopy of TAPP attached silica coated gold NPs
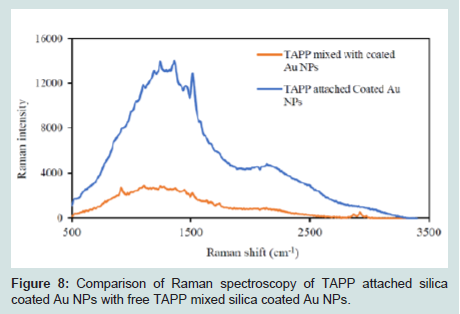
Raman spectrum of TAPP attached Au@SiO2 core/shell NPs was recorded after its synthesis. The concentration of NPs was 10.7×10⁻⁶ g/ml and the concentration of TAPP attached to the silica shell was 2.5×10⁻⁸ M. To compare the effect of linking the TAPP to the silica surface, a solution of TAPP siloxy conjugate (2.57×10⁻⁸ M) mixed with Au@SiO2 core/shell NPs (10.7×10⁻⁶ g/ml) was prepared and analyzed by Raman Scattering.
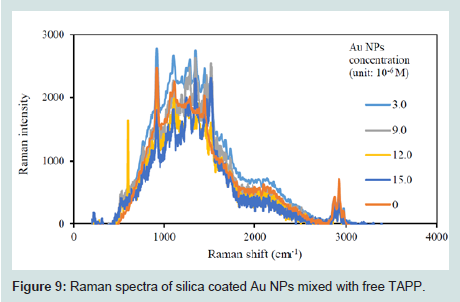
Figures 8 shows a comparison between TAPP attached Au@SiO2 NPs and the free TAPP mixed with Au@SiO2 (no chemical bond). From the Raman spectra, using Raman shift at 1500 cm-1 (aromatic ring), the Raman intensity of TAPP attached Au@SiO2 was 5.7 times greater than when the free TAPP was mixed with the Au@SiO2 core/shell NPs. There are two possible explanations for this result. First, simply mixing cannot ensure TAPP is attached to the surface of the Au@SiO2 core/shell NPs. Second, the enhanced electromagnetic field usually decays exponentially with distance from the metal surface, the coated silica layer further increased the distance of free TAPP to the Au NP surface [43]. To further explore these two explanations, a series of Au@SiO2 NPs were mixed with free TAPP solution, separately. The final concentrations of the nanoparticles were: 3.0×10⁻⁶, 6.0×10⁻⁶, 9.0×10⁻⁶, 12.0×10⁻⁶, and 15.0×10⁻⁶ g/mL. The final concentration of TAPP was 2.7×10⁻⁸ M. With sufficient time for equilibrium, the mixtures were analyzed by Raman Scattering (Figures 9). The Raman spectra indicated no significant enhancement or pattern between the intensity and the concentration of Au NPs. Attaching TAPP to the surface of silica shell was therefore required for an enhanced Raman signal.
Multivariate analysis of resulted fluorescence spectra
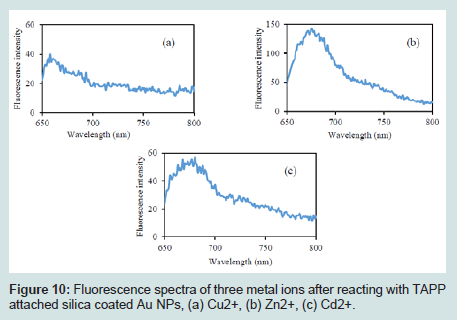
After attachment of TAPP to the Au@SiO2 core/shell NPs, they were reacted with heavy metal ions. The clean and concentrated products were analyzed by fluorescence. The results are shown in (Figures 10). Each product displayed an emission band from 650 to 690 nm. Although a difference was observed between each spectrum, it was not sufficient to distinguish these spectra. To separate these spectra from each other, multivariate analysis was used (i.e. PCA).
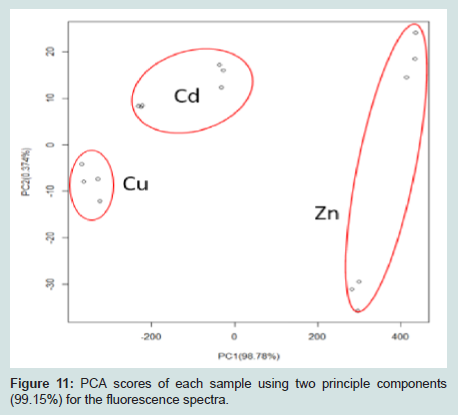
Principal Component Analysis (PCA) was applied to the resulting mean centered, scaled fluorescence spectra (Figures 11), thus eliminating the impact of signal intensity magnitude on the data analysis. PCA revealed 99.15% of the variance in the sample spectra could be described using two components. Scores for the two components are shown in (Figures 11). The spectra for each metal ion bound to the TAPP functionalized NPs appear very similar (Figures 10). However, reduction of the data to two orthogonal components clearly shows discernable differences (Figures 11). This technique enables distinction between each of these three metal ions at a concentration of 1.5×10⁻⁵ M.
Conclusion
In this study, TAPP attached Au@SiO2 were synthesized and applied to detect Zn2+, Cu2+, and Cd2+ in aqueous solutions. Au NPs acted as viable substrate for fluorescence and SERS. The Raman signal of TAPP attached Au@SiO2 core/shell NPs is 5.7 times greater that the intensity of free TAPP mixed with Au@SiO2 core/shell NPs. And the conjugate system exhibited different fluorescence signal changes when reacted with different heavy metal ions. The resulted fluorescence spectra were analyzed by PCA. The result shows this conjugated system can detect and separate Zn2+, Cu2+, and Cd2+ in aqueous solution separately at concentration of 1.5×10⁻⁵ M. Unfortunately, the resulted Raman spectra cannot be used to separate different metal ions from each other. The advantages of this system are: 1) Au NPs are viable substrate for fluorescence and SERS 2). Silica shell can well prevent Au NPs from aggregating and contaminating the analyte 3). Silica shell can be modified by other functional groups.
References
- Duruibe JO, Ogwuegbu MO, Egwurugwu JN (2007) Heavy metal pollution and human biotoxic effects. Int J Phys Sci 2: 112-118.
- de Vries W, Romkens PF, Schutze G (2007) Critical soil concentrations of cadmium, lead, and mercury in view of health effects on humans and animals. Rev Environ Contam Toxicol 191: 91-130.
- Flegal AR, Smith DR (1992) Current needs for increased accuracy and precision in measurements of low levels of lead in blood. Environ Res 58: 125-133.
- Partanen T, Heikkila P, Hernberg S, Kauppinen T, Moneta G, et al. (1991) Renal cell cancer and occupational exposure to chemical agents. Scand J Work Environ Health 17: 231-239.
- Aragay G, Pons J, Merkoci A (2011) Recent trends in macro-, micro-, and nanomaterial-based tools and strategies for heavy-metal detection. Chem Rev 111: 3433-3458.
- Pohl P (2009) Determination of metal content in honey by atomic absorption and emission spectrometries. TrAC Tren Anal Chem 28: 117-128.
- Gasparik J, Vladarova D, Capcarova M, Smehyl P, Slamecka J, et al. (2010) Concentration of lead, cadmium, mercury and arsenic in leg skeletal muscles of three species of wild birds. J Environ Sci Health A Tox Hazard Subst Environ Eng 45: 818-823.
- Caroli S, Forte G, Iamiceli AL, Galoppi B (1999) Determination of essential and potentially toxic trace elements in honey by inductively coupled plasma-based techniques. Talanta 50: 327-336.
- Flamini R, Panighel A (2006) Mass spectrometry in grape and wine chemistry. Part II: The consumer protection. Mass Spectrom Rev 25: 741-774.
- Zhao Y, Zhang XB, Han ZX, Qiao L, Li CY, et al. (2009) Highly sensitive and selective colorimetric and off-on fluorescent chemosensor for Cu2+ in aqueous solution and living cells. Anal Chem 81: 7022-7030.
- Knecht MR, Sethi M (2009) Bio-inspired colorimetric detection of Hg2+ and Pb2+ heavy metal ions using Au nanoparticles. Anal Bioanal Chem 394: 33-46.
- Prestel H, Gahr A, Niessner R (2000) Detection of heavy metals in water by fluorescence spectroscopy: on the way to a suitable sensor system. Fresenius J Anal Chem 368: 182-191.
- Huang CC, Chang HT (2006) Selective gold-nanoparticle-based “turn-on” fluorescent sensors for detection of mercury (II) in aqueous solution. Anal Chem 78: 8332-8338.
- Cho Y, Lee SS, Jung JH (2010) Recyclable fluorometric and colorimetric mercury-specific sensor using porphrin-functionalized Au@SiO2 core/shell nanoparticles. Analyst 135: 1551-1555.
- Lodeiro C, Capelo JL, Mejuto JC, Oliveira E, Santos HM, et al. (2010) Light and colour as analytical detection tools: a journey into the periodic table using polyamines to bio-inspired systems as chemosensors. Chem Soc Rev 39: 2948-2976.
- Kim HN, Ren WX, Kim JS, Yoon J (2012) Fluorescent and colorimetric sensors for detection of lead, cadmium, and mercury ions. Chem Soci Rev 41: 3210-3244.
- Wu Z, Zhang Y, Ma JS, Yang G (2006) Ratiometric Zn2+ sensor and strategy for Hg2+ selective recognition by central metal ion replacement. Inorg Chem 45: 3140-3142.
- Marbella L, Serli‐Mitasev B, Basu P (2009) Development of a fluorescent Pb2+ sensor. Angew Chem Int Ed Engl 48: 3996-3998.
- Rex M, Hernandez FE, Campiglia AD (2006) Pushing the limits of mercury sensors with gold nanorods. Anal Chem 78: 445-451.
- He X, Liu H, Wang S, Li Y, Wang N, et al. (2005) Gold nanoparticle‐based fluorometric and colorimetric sensing of copper (II) ions. Adv Mater 17: 2811-2815.
- Hung YL, Hsiung TM, Chen YY, Huang YF, Huang CC (2010) Colorimetric detection of heavy metal ions using label-free gold nanoparticles and alkanethiols. J Phys Chem C 114: 16329-16334.
- Han D, Lim SY, Kim BJ, Piao L, Chung TD (2010) Mercury (ii) detection by SERS based on a single gold microshell. Chem Commun (Camb) 46: 5587-5589.
- Anema JR, Li JF, Yang ZL, Ren B, Tian ZQ (2011) Shell-isolated nanoparticle-enhanced Raman spectroscopy: expanding the versatility of surface-enhanced Raman scattering. Annu Rev Anal Chem (Palo Alto Calif) 4: 129-150.
- Jal PK, Patel S, Mishra BK (2004) Chemical modification of silica surface by immobilization of functional groups for extractive concentration of metal ions. Talanta 62: 1005-1028.
- Krasnoslobodtsev AV, Smirnov SN (2002) Effect of water on silanization of silica by trimethoxysilanes. Langmuir 18: 3181-3184.
- Zburavlev LT (2000) The surface chemistry of amorphous silica. Zburavlev model. Colloids and Surfaces A: Physicochemical and Engineering Aspects 173: 1-38.
- Badley RD, Ford WT, McEnroe FJ, Assink RA (1990) Surface modification of colloidal silica. Langmuir 6: 792-801.
- Biesaga M, Pyrzynska K, Trojanowicz M (2000) Porphyrins in analytical chemistry. A review. Talanta 51: 209-224.
- Hu Q, Yang G, Zhao Y, Yin J (2003) Determination of copper, nickel, cobalt, silver, lead, cadmium, and mercury ions in water by solid-phase extraction and the RP-HPLC with UV-Vis detection. Anal Bioanal Chem 375: 831-835.
- Hu Q, Yang G, Yin J, Yao Y (2002) Determination of trace lead, cadmium and mercury by on-line column enrichment followed by RP-HPLC as metal-tetra-(4-bromophenyl)-porphyrin chelates. Talanta 57: 751-756.
- Kawakami T, Igarashi S (1996) Highly sensitive spectrophotometric determination of nitrite ion using 5, 10, 15, 20-tetrakis (4-aminophenyl) porphine for application to natural waters. Analy Chem Acta 333: 175-180.
- Aragay G, Pons J, Merkoci A (2011) Recent trends in macro-, micro-, and nanomaterial-based tools and strategies for heavy-metal detection. Chem Rev 111: 3433-3258.
- Brereton RG (2003) Chemometrics: data analysis for the laboratory and chemical plant. John Wiley & Sons Ltd, USA.
- Rencher AC (2003) Methods of multivariate analysis. (2nd edn). Wiley Interscience, A John Wiley & Sons Inc Publication, USA, pp: 1-727.
- Shlens J (2014) A tutorial on principal component analysis.
- Abdi H, Williams LJ (2010) Principal component analysis. Wiley Interdiscip Rev Comput Stat 2: 433-459.
- Frens G (1973) Controlled nucleation for the regulation of the particle size in monodisperse gold suspensions. Nature Phy Sci 241: 20-22.
- Liz-Marzán LM, Giersig M, Mulvaney P (1996) Synthesis of nanosized gold-silica core-shell particles. Langmuir 12: 4329-4335.
- Ikeda T, Tsukahara T, Iino R, Takeuchi M, Noji H (2014) Motion capture and manipulation of a single synthetic molecular rotor by optical microscopy. Angew Chem Int Ed Engl 53: 10082-10085.
- Haiss W, Thanh NT, Aveyard J, Fernig DG (2007) Determination of size and concentration of gold nanoparticles from UV-vis spectra. Anal Chem 79: 4215-4221.
- Liu X, Atwater M, Wang J, Huo Q (2007) Extinction coefficient of gold nanoparticles with different sizes and different capping ligands. Colloids Surf B Biointerfaces 58: 3-7.
- Lakowicz JR, Shen Y, D'Auria S, Malicka J, Fang J, et al. (2002) Radiative decay engineering: 2. Effects of silver island films on fluorescence intensity, lifetimes, and resonance energy transfer. Anal Biochem 301: 261-277.
- Barnes WL, Dereux A, Ebbesen TW (2003) Surface plasmon subwavelength optics. Nature 424: 824-830.