
Application and Utility of Pharmacogenetics in the Clinical Laboratory
Athena K. Petrides, William Clarke, Mark A. Marzinke*
- Department of Pathology, Johns Hopkins University School of Medicine, Baltimore, Maryland
*Address for Correspondence: Mark A. Marzinke, Department of Pathology, Johns Hopkins University School of Medicine, Sheikh Zayed Tower B1020G, 1800 Orleans Street, Baltimore, MD 21297, Tel: (443) 287-7516; Fax: 410-955-0767; E-mail: mmarzin1@jhmi.edu
Citation: Petrides AK, Clarke W, Marzinke MA. Application and Utility of Pharmacogenetics in the Clinical Laboratory. J Analyt Molecul Tech 2014;1(1): 15.
Copyright © 2014 Marzinke et al. This is an open access article distributed under the Creative Commons Attribution License, which permits unrestricted use, distribution, and reproduction in any medium, provided the original work is properly cited.
Journal of Analytical & Molecular Techniques |ISSN: 2474-1914 | Volume: 1, Issue: 1
Submission: 22 November 2013 | Accepted: 29 January 2014 | Published: 08 February 2014
Reviewed & Approved by: Dr. Zafar Iqbal Department of Chemistry at Carleton University, Canada
Abstract
The administration of pharmaceuticals presents a challenge for the healthcare system, as inappropriate drug or dose selection can result in diminished therapeutic efficacy or adverse drug reactions. Genetic variability is a major regulator of drug action which should be taken into account during drug and dose selection. The correlation of drug responses (phenotypes) to specific polymorphisms (genotype) has contributed to the development of many targeted genotyping approaches. Incorporation of such testing into the clinical laboratory requires the evaluation of current testing platform characteristics as well as the selection of appropriate polymorphisms to be tested. Here we describe known genotype - phenotype relationships pertinent to drug action and present currently available targeted genotyping platforms for pharmacogenetics (PGx) testing. We additionally discuss considerations regarding platform and polymorphism selection for successful integration of PGx testing into the clinical laboratory and attainment of clinically useful results.
Keywords: Pharmacogenetics; Pgx; Genotyping; Polymorphism; SNP; Adverse Drug Reaction; ADR; Drug Response
Introduction
Drug response is multifactorial, and involves not only drug dose, but also adherence and compliance, drug-drug interactions, pertinent clinical background, as well as genetic disposition. Genetic variability has shown significant pharmacokinetic and pharmacodynamic consequences in a number of clinical scenarios, including chemotherapeutics, organ transplantation and pain management [1-4]. Further, genetic variations pose a major challenge in patient care, as the non-optimal administration of pharmaceuticals is a major cause of adverse events in a clinical setting [5,6]. Adverse drug reactions (ADRs) can occur when toxic levels of the drug have been reached in a patient, due to failures in drug dosing, drug selection or inefficient drug metabolism. They are responsible for over 200,000 hospitalizations per year in the United States, thus affecting both morbidity rates and healthcare costs [7-12]. In fact, ADRs are ranked as the fourth leading causes of hospitalized patient deaths in the United States [7]. In addition to drug toxicity, genetic aberrations may result in suboptimal drug administration, thus reducing therapeutic efficacy by influencing its absorption, distribution, metabolism, or elimination.
Genetic variations may be inherited (germline) or acquired (somatic); many somatic mutations are associated with cancer and other clinical pathologies [13]. For example, genetic mutations in the Kristen rat sarcoma viral oncogene homolog (K-ras), a small G protein, can confer resistance to certain targeted therapeutics aimed to inhibit the action of the epidermal growth factor receptor (EGFR) for the treatment of colorectal carcinomas [14-17]. As K-ras is an integral downstream signaling component of the EGFR pathway, mutations in the KRAS gene can cause constituent signaling and activation of the cascade regardless of EGFR inhibition [18]. Thus, in order to optimize therapeutic efficacy and treatment success, there is a continued, burgeoning interest in the relationship between pharmacology and genetic information.
Pharmacogenetics (PGx) aims to associate particular genetic polymorphisms (genotype) with differences in drug response in an individual (phenotype) [19]. Polymorphisms are mutations within the DNA sequence that occur at a frequency of 1% or greater in a population [20]. There are three types of polymorphisms predominantly observed in humans: single nucleotide polymorphisms (SNPs), insertions/deletions, and copy number variations (CNVs). SNPs are single base pair substitutions that are further categorized into “nonsynonymous” or “missense,” “synonymous” or “sense,” and “nonsense” polymorphisms. Missense polymorphisms cause a change in the DNA sequence resulting in the transcription of a variant codon and subsequent translation of a substituted amino acid. Sense polymorphisms are DNA variants that do not result in an amino acid substitution. Additionally, “nonsense” polymorphisms occur if the polymorphism results in the generation of a stop codon (TAG, TAA, TGA). It should be noted that these polymorphisms may occur in the coding and/or non-coding regions of a gene, and can result in altered protein structure and function. While polymorphisms within the coding sequence can directly cause changes in the amino acid sequence, polymorphisms within non-coding regions can influence both gene expression and function (Figure 1). Notably, polymorphisms in the promoter sequences, introns, and 5′and 3′untranslated regions (UTRs), may cause low or null protein expression, the creation of alternative splice sites, or decreased transcript stability, respectively (Figure 1). For example, the expression of the uridine diphosphate (UDP) glucuronosyl transferase can substantially decrease depending on the number of TA repeats in the promoter region (5′ UTR) of its corresponding gene, UGT1A1 [21].
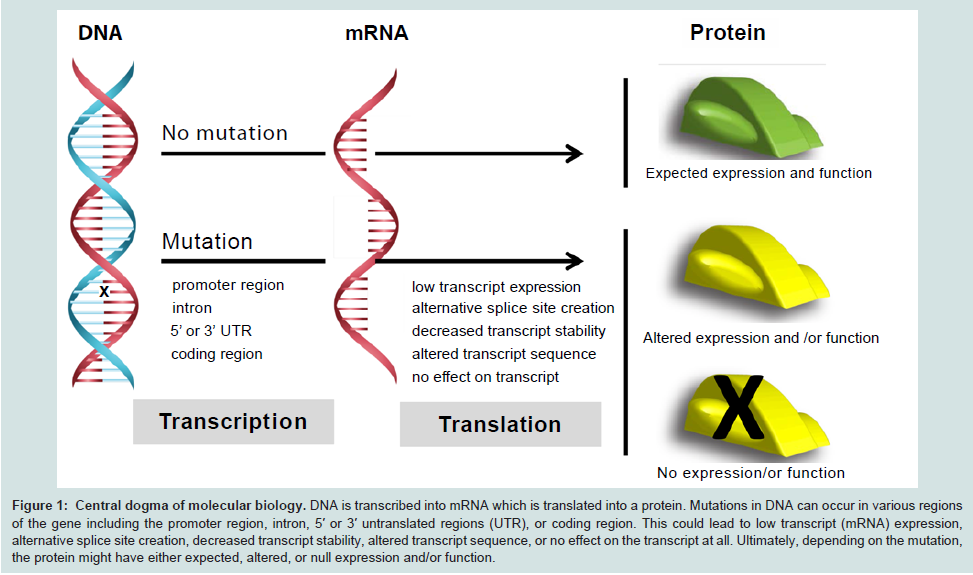
Figure 1: Central dogma of molecular biology. DNA is transcribed into mRNA which is translated into a protein. Mutations in DNA can occur in various regions of the gene including the promoter region, intron, 5′ or 3′ untranslated regions (UTR), or coding region. This could lead to low transcript (mRNA) expression, alternative splice site creation, decreased transcript stability, altered transcript sequence, or no effect on the transcript at all. Ultimately, depending on the mutation, the protein might have either expected, altered, or null expression and/or function.
In addition to single nucleotide polymorphisms, genetic insertions and deletions can severely impact protein expression and structure. Such insertions and deletions can result in absent or additional amino acids in the normal protein sequence, which may lead to altered or abrogated protein function. These events that may also cause a shift in the reading frame of a DNA sequence, thereby altering the transcribed codon sequence. Therefore, when a frameshift occursduring protein translation, the end proteins do not resemble the normal gene product. Lastly, CNVs are duplications or deletions of sequences (1Kb - 5Mb), which depending on the size of the sequence, may affect the copy number of a gene or cause structural variation within the genome.
The Food and Drug Administration (FDA) has recognized the influence of genetic variability on drug efficacy and potential adverse reactions, as evident from its recommendation to includepharmacogenetic biomarker information on 107 drug labels (Table 1) [22]. In fact, for 7 of these drugs, the FDA has issued boxed warnings, which indicate that there is a serious potential for adverse reactions [22]. Additionally, the FDA has defined PGx testing as assays intended to study inter-individual variations in a DNA sequence related to drug absorption and disposition or drug action, including polymorphic variations in the genes that encode the functions of transporters, metabolizing enzymes, receptors, and other proteins [23]. The targeted PGx approach is distinct from more global pharmacogenomics (PGo) testing, which studies whole-genome variations that may be correlated with pharmacological function and therapeutic response [23].
Table 1: Prediction of Cardiovascular diseases, age adjusted death rate in total population (ASDR per 100,000) 90 countries, year 2008
Germline polymorphisms | |
CYP2D6 | Aripiprazole, Atomoxetine, Carvedilol, Cevimeline, Chlordiazepoxide and Amitriptyline, Citalopram, Clomipramine, Clozapine, Codeine, Desipramine, Dextromethorphan and Quinidine, Doxepin, Fluoxetine, Fluoxetine and Olanzapine, Fluvoxamine, Galantamine, Iloperidone, Imipramine, Metoprolol, Modafinil, Nefazodone, Nortriptyline, Paroxetine, Perphenazine, Pimozide, Propafenone, Propranolol, Protriptyline, Quinidine, Risperidone, Terbinafine, Tetrabenazine, Thioridazine, Tolterodine, Tramadol and Acetaminophen, Trimipramine, Venlafaxine |
CYP2C9 | Celecoxib, Flurbiprofen, Warfarin |
CYP2C19 | Carisoprodol, Citalopram, Clobazam, Clopidogrel*, Dexlansoprazole, Diazepam, Drospirenone and Ethinyl Estradiol, Esomeprazole, Lansoprazole, Omeprazole, Pantoprazole, Prasugrel, Rabeprazole, Ticagrelor, Voriconazole |
TPMT | Azathioprine, Cisplatin, Indacaterol, Irinotecan, Mercaptopurine, Nilotinib, Thioguanine |
UGT1A1 | Indacaterol, Irinotecan, Nilotinib |
VKORC1 | Warfarin |
HLA-B | Abacavir*, Carbamazepine*, Phenytoin |
Somatic polymorphisms | |
BRAF | Vemurafenib |
EGFR | Cetuximab, Erlotinib, Gefitinib, Panitumumab |
KRAS | Cetuximab, Panitumumab |
*issued as Boxed Warning
There is exceedingly compelling evidence that PGx information should be part of the clinical decision process. Many health care institutions have incorporated routine PGx testing into the clinical laboratory; this has been accompanied by the development of computational clinical decision support (CDS) tools; the information is delivered directly to clinicians through the hospital information system [24]. In order for such support to be provided, the benefits and limitations of particular platforms that can perform PGx testing must be understood. As there are several methodologies and platforms available for PGx testing, this review will focus on the presentation, analysis, and comparison of targeted genotyping assays.
Genotype and drug response
Genetic variability can influence therapeutic modalities in the following ways: 1) pharmacokinetic changes, 2) pharmacodynamic changes, 3) immune-mediated responses, 4) altered structure/function of drug direct or indirect target.
Pharmacokinetic changes
The term pharmacokinetics pertains to the effect the body has on a drug, which includes drug bioavailability and absorption, distribution, metabolism, and elimination [19]. The activity of drug metabolizing enzymes can significantly influence the pharmacokinetics of a drug, and along with the dosing regimen, can impact the systemic steady-state drug concentration. Hepatic and extra-hepatic enzymes play a significant role in both phase I (modification) and phase II (conjugation) metabolism. Phase I metabolism involves the addition of a polar group to lipophilic xenobiotic substrates to increase their solubility in water; this may occur through oxidative, reductive or hydrolytic reactions [25]. Drug metabolism is primarily carried out via oxidative metabolism by cytochrome P450 enzymes, which are monooxygenases found at highest concentrations in the liver. Phase I metabolism may convert an active drug into an inactive metabolite, a pro-drug into a pharmacologically active agent, or a non-toxic molecule into a toxic one. Conjugation of xenobiotic metabolites to less active, and more water soluble derivatives, occurs during phase II metabolism [26]. Specifically, the addition of a hydrophilic group, such as a glucuronide or acetyl group, to the metabolite, will increase the metabolite’s polarity, which will in turn allow for its excretion [25]. Interestingly, a significant number of polymorphisms have been identified in drug-metabolizing enzymes that can alter their individual activity, such as in genes coding for the cytochrome P450 family of enzymes, thiopurine methyltransferase (TPMT) and UDP glucuronosyl transferase (UGT1A1).
The cytochrome P450 (CYP) family of proteins are drugmetabolizing enzymes responsible for the metabolism of over 75% of commonly prescribed drugs [27]. Genes encoding these cytochromes have been extensively studied in part because of their heavily polymorphic nature [28]. Although several polymorphisms result in aberrant enzyme activity, most variants are not associated with a particular phenotype, due to the fact that there is functional redundancy amongst the CYP drug-metabolizing enzymes [28]. However, genotypic characterization of germline polymorphisms in drug-metabolizing enzymes can play an important part in the phenotypic characterization of individuals who are poor metabolizers (PM), intermediate metabolizers (IM), extensive metabolizers (EM), and ultra-rapid metabolizers (UM) for a particular substrate [29].
The CYP3A enzyme subfamily is the most abundant subclass of metabolizing enzymes in the human liver and small intestine [30]. Even though genetic variations have been observed within these genes, their effects on drug metabolism have not been extensively studied. The characterization of their clinical significance remains challenging, as their regulation and expression are determined via complex pathways and environmental cues [31]. Although there are many more CYP enzymes that play a role in the metabolism of xenobiotic substrates, this section will highlight a subset of enzymes with genetic polymorphisms shown to have phenotypic consequences.
A well characterized enzyme of the P450 family is CYP2D6, a phaseI monooxygenase involved in the metabolism of approximately 25% of commonly used medications (Table 1) [32,33]. There are currently over 63 allelic variants identified, including gene rearrangements, deletions or insertions, SNPs, and allelic deletions or duplications [34,35]. Therefore, phenotype prediction based on genotype is challenging, due to the occurrence of numerous allelic combinations as well as differential impacts of a specific mutation on enzyme activity [36]. Regardless, CYP2D6 genotype information, in conjunction with pharmacokinetic and pharmacodynamic information, has allowed for the closer prediction of drug metabolism/clearance for the following antidepressants: desipramine, fluvoxamine, mexiletine, mianserin, nortryptiline, and paroxetine [37]. Although CYP2D6 polymorphisms are observed at various frequencies in ethnic populations, most individuals are phenotypically classified as EMs, which is now considered to be the “normal” metabolism of a xenobiotic substance [38]. Depending on the specific polymorphisms, heterozygotes may display slightly impaired activity and may be phenotypically classified as IMs. Individuals who carry two deficient CYP2D6 variants are characterized as PMs and tend to have higher concentrations of unmetabolized drugs, thereby potentially placing them at a higher risk of experiencing a toxic or adverse event, or leading to suboptimal drug concentrations and preventing maximum efficacy [39]. In contrast, UMs exhibit extremely high metabolic capacity caused by the amplification, duplication, or multi-duplication of the CYP2D6 gene, most commonly of the CYP2D6*2 allele [33,40]. While individuals with a UM phenotype may exhibit increased clearance of an active drug and decreased efficacy, UMs may also experience toxicities associated with increased prodrug activation [33,41,42].
CYP2C9 is another major CYP enzyme which participates in the metabolism of 20% of drugs (Table 1). Even though there have been over 100 variant alleles identified so far, the CYP2C9*2 and CYP2C9*3 are the most common variants, especially in European populations. The role of CYP2C9 polymorphisms in warfarin and phenytoin metabolism has been extensively studied; this is partly due to the fact that these drugs have narrow therapeutic ranges and their administration could potentially result in ADRs [43]. Although phenytoin is a commonly prescribed drug for epilepsy treatment, it is difficult to manage, as it shows significant inter-variability and nonlinearity in its pharmacokinetics [44,45]. Phenotypically, carriers of either the CYP2C9*2 or CYP2C9*3 variant not only show a decreased clearance of the drug but also up to a 30% increase in serum levels compared to CYP2C9 wild type individuals [46].
A smaller percentage of drugs including anticonvulsants and proton pump inhibitors are, in part, metabolized by the oxidase encoded from the CYP2C19 gene (Table 1). There are at least seven variant alleles associated with decreased enzyme activity and a PM phenotype shown to influence the metabolism of various benzodiazepines, such as diazepam, clobazam, flunitrazepam, and quazepam [25]. However, the genetic polymorphism CYP2C19*17, has been associated with increased gene expression and subsequent protein activity and metabolism of xenobiotic compounds, such as omeprazole, a proton pump inhibitor, and escitalopram, an antidepressant. Further, CYP2C19 variants may play a role in the metabolism of clopidogrel, an antiplatelet agent; individuals carrying the deficientCYP2C19*2 and CYP2C19*3 variants exhibit inefficient inhibition of platelet reactivity and a potential increased risk of recurrent cardiovascular events [47]-51]. While CYP2C19*17 carriers metabolize the drug rapidly and can exhibit a better response to therapy due to prodrug activation, these individuals may also be at increased risk for potential bleeding [52,53].
Thiopurine methyltransferase (TPMT) is a gene located on chromosome 6 and the gene encodes a protein that methylates sulfur groups. Mechanistically, TPMT facilitates the transfer of a methyl group from the donor molecule S-adenosyl-L-methionine, generating S-adenosyl-L-homocysteine as a byproduct and methylating a thiopurine compound, such as thioguanine and the active anti-cancer agent 6-mercaptopurine (Table 1) [28,54].While there are 17 genetic alleles identified to date, there are three variant alleles associated with severe toxic events in patients receiving mercaptopurine therapy; TPMT*2, TPMT*3A, and TPMT*3C, all of which result in amino acid substitutions [55,56]. These three alleles (predominantly *3A and *3C) represent greater than 90% of TMPT genetic variants [55,56]. Of note, it has been reported that 30-60% of heterozygous individuals had experienced severe acute immunosuppression while their dose of thiopurine was being adjusted [57]. Consequently, starting doses based on genotype have been recommended [58]. However, even though genotyping information is informative, it is important for clinicians to monitor both disease progression and immunosuppression to adjust dosage appropriately [58].
UGT1A1 codes for uridine diphosphate glucuronosyltransferase, a phase II metabolizing enzyme that solubilizes both endogenous and exogenous compounds, converting lipophilic compounds into water-soluble metabolites. While there are several genetic variations identified in the coding region of the gene, the UGT1A1*28 variant allele contains a 2bp TA insertion in the non-coding promoter region, resulting in reduced transcription levels and an overall decrease in enzyme activity [59,60]. An exogenous drug that is solubilized via UGT1A1-mediated glucuronidation is the anti-neoplastic irinotecan. Irinotecan is a prodrug that is converted to the active SN38 molecule, which is a topoisomerase I inhibitor. A number of studies have demonstrated that individuals homozygous for UGT1A1*28 exhibit reduced glucuronidation and are not able to completely detoxify SN38 [61-63]. According to the World Health Organization (WHO), these individuals are at higher risk to experience toxic effects, including neutropenia, as compared to wild type or heterozygous individuals [64]. In fact, the FDA has recommended genetic testing for the UGT1A1 variant prior to initiating irinotecan therapy, as well as other drugs listed in Table 1.
Changes in drug pharmacodynamics
Pharmacodynamics refers to the effect a drug has on the body when interacting with receptor proteins [19]. It is considered that the duration and intensity of drug effect, therapeutic or toxic, is proportional to localized drug concentration at the site of action [65]. Pharmacodynamic measures include resolution or management of pain following the administration of opioids, decreased blood clotting following administration of anticoagulants, or the measurement of cholesterol following stat in administration.
Efficacy of the oral anticoagulant warfarin is measured pharmacodynamically through the measurement of prothrombin time, and determination of the international normalized ratio (INR), to assess the extrinsic pathways of coagulation. Mechanistically, warfarin inactivates vitamin Kepoxidereductase (VKOR), a hepatic enzyme responsible for Vitamin K recycling, thereby preventing the downstream activation of Vitamin K-dependent coagulation factors [66]. Since warfarin is a drug with a narrow therapeutic window and a wide inter-individual response, the discovery of the gene encoding VKOR, VKORC1, led to the study of polymorphisms that could contribute to this response. These studies revealed that VKORC1 variants can cause 50% of the variability observed in dosing requirements [67,68]. Interestingly,VKOR1 variants appear at various frequencies for different ethnic populations; particularly, 42% in Caucasians, 90% in Asians, and 10% in African Americans [69].
Immune-mediated Responses
One of the well-described examples of an altered drug response due to immune-mediated action is that of abacavir, a nucleoside analogue reverse transcriptase inhibitor. Abacaviris prescribed for the treatment of HIV and, although well-tolerated, approximately 5% of the population is at risk of developing hypersensitivity (HSR) to the drug [70]. Within the first 11 days of abacavir use, individuals with drug hypersensitivity may present with fever, skin rash, gastrointestinal or respiratory problems, and in rare cases, lifethreatening conditions like Stevens-Johnson syndrome (SJS) [66,70]. In 2002, the genetic susceptibility of HSR was determined, when the HLA-B locus variant, HLA-B*5701, was shown to be associated with increased risk of developing HSR in response to abacavir [71]. HLA-B is part of the major histocompatibility complex (MHC) and functions to encode proteins involved in cell antigen presentation to T-cells [72]. Specifically, carriers of this variant are thought to have up to a 117-fold increased risk of developing abacavir HSR [71,73]. Epidemiologically, the HLA-B*5701 frequency in Europeans ranges from 1.4-10.3%, and Southwest Asians from 3.8-19.8%, it ranges 1.1-3.1% in South Americans [74,75]. Consequently, the Infectious Disease Society of America has recommended HLA-B*5701 genotyping prior to starting patients on abacavir [72,76]. Interestingly, studies have revealed that the incidence of abacavir HSR had significantly decreased due to HLA-B*5701 pharmacogenetic testing [77].
Aside from the HLA-B*5701 allele, other polymorphisms in the HLA family can also lead to life threatening conditions in response to other drugs. Both the HLA-B*1502 and HLA-A*3101 variants have been correlated to SJS development after carbamazepine administration in Asians and Caucasians, respectively [78,79]. In addition, HLA-B*5701 carriers were found to have an increased risk of developing liver damage due to flucloxacillin [80].
Altered structure/function of direct or indirect drug target
In addition to the previously mentioned germline polymorphisms, somatic mutations arising from a single cell can also alter drug response. The acquisition of somatic mutations is aphenomenon frequently observed in tumor cells that usually leads to cell overexpression. Mutations in tumor cells could dictate an individual’s response to an anti-cancer drug, by modifying either the activity and/or expression of the drug target or that of downstream effectors. Even though the prognostic value of this information is great, pharmacogenetic testing for cancer-therapeutics is quite complicated, due to the genetic heterogeneity of the tumor itself as well as variability in the approaches used for detecting somatic mutations.
The down-regulation of EGFR activity is also desired for the treatment of mCRC patients, who may exhibit up to 80% overexpression of the receptor [92]. This is now being achieved via FDA-approved monoclonal anti-EGFR antibodies such as cetuximab and panitumumab. Response to these drugs is also variable, as many patients with mutations in downstream effectors of the EGFR pathway can abrogate therapeutic response, leading to a poor prognosis [14,93,94]. K-ras is a small G-protein and downstream effector of EGFR involved in the regulation of many processes. Activating mutations in KRAS, seen in approximately 44% of colorectal cancers, frequently occur as G to A and G to T substitutions in codons 12 and 13 [85]. Consequently, the presence of such mutations allows for the activation of EGFR pathways in a ligand-independent manner. It is, therefore, now recommended that patients are screened for KRAS activating mutations prior to anti-EGFR antibody therapy in order to assess the drug’s therapeutic efficacy. The B-raf kinase is another downstream effector in the EGFR pathway. Mutations within the BRAF gene, particularly the V600E activating mutation, have been associated with 40-60% of malignant melanoma cases [95-97]. The FDA has very recently approved two drugs for the treatment of advanced melanoma patients who harbor the V600E B-raf variant, dabrafenib and vemurafenib. Therefore, genotyping is required for the administration of either of these two drugs, and the provision of molecular testing has contributed to increased survival rates in this patient population [97].
Mutations in one therapeutic drug target, the epithelial growth factor receptor (EGFR) gene, are associated withpoor prognosis for many cancers [81,82]. Specifically, EGFR mutations have been linked to non-small cell carcinoma (NSCLC) and EGFR overexpression to metastatic colorectal cancer (mCRC) and glioblastoma [83,84]. EGFR encodes for a transmembrane tyrosine kinase (TK), which acts to phosphorylate downstream effectors and activate several pathways, including the RAS-RAF signaling pathways [85]. Since this protein is involved in the progression of several tumors, it has been the target of many developed anti-cancer therapeutic drugs. Gefitinib and Erlotinib are small molecules designed to target and inhibit the EGFR TK domain. These drugs are FDA approved for NSCLC treatment, as they have been shown to minimize tumor growth [86]. The heterogeneity in patient responses to both drugs led to the realization that certain mutations within the TK could potentially dictate the prognosis of drug therapy. For instance, a deletion in exon 19 (E746_A750del) or a substitution in exon 21 (L858R), will result in the autonomous activation of EGFR TK domain as well as that of its downstream pathways [87]. NSCLC patients, who have acquired such mutations as well as similar activating mutations, show a higher drug response and survival rate than wild type (WT) patients [88]. Many patients receiving TK inhibitor therapy, however, have the tendency to develop a resistance against the drugs by acquiring other mutations. This includes a threonine to methionine mutation at codon 790 (T290M), which interferes with TK inhibitor binding and is associated with a relapsed tumor [89-91]. Mutations within the EGFR TK region (exons 18-21) occur in 12% of NSCLC cases [85]; therefore, screening for TK mutations prior to drug therapy is recommended.
The down-regulation of EGFR activity is also desired for the treatment of mCRC patients, who may exhibit up to 80% overexpression of the receptor [92]. This is now being achieved via FDA-approved monoclonal anti-EGFR antibodies such as cetuximab and panitumumab. Response to these drugs is also variable, as many patients with mutations in downstream effectors of the EGFR pathway can abrogate therapeutic response, leading to a poor prognosis [14,93,94]. K-ras is a small G-protein and downstream effector of EGFR involved in the regulation of many processes. Activating mutations in KRAS, seen in approximately 44% of colorectal cancers, frequently occur as G to A and G to T substitutions in codons 12 and 13 [85]. Consequently, the presence of such mutations allows for the activation of EGFR pathways in a ligand-independent manner. It is, therefore, now recommended that patients are screened for KRAS activating mutations prior to anti-EGFR antibody therapy in order to assess the drug’s therapeutic efficacy. The B-raf kinase is another downstream effector in the EGFR pathway. Mutations within the BRAF gene, particularly the V600E activating mutation, have been associated with 40-60% of malignant melanoma cases [95-97]. The FDA has very recently approved two drugs for the treatment of advanced melanoma patients who harbor the V600E B-raf variant, dabrafenib and vemurafenib. Therefore, genotyping is required for the administration of either of these two drugs, and the provision of molecular testing has contributed to increased survival rates in this patient population [97].
Targeted genotpying techniques
There are a number of analytical platforms available for the targeted identification of genetic variants. However, all of the genotyping tools employ at least one of the basic principles implemented for allelic discrimination: hybridization, primer extension, ligation or invasive cleavage. Probe hybridization utilizes two sequence-specific oligonucleotide probes that are designed to match either the mutation-containing sequence or the wild type sequence. Following temperature-mediated strand separation, the probes will specifically hybridize to their target sequences, since they are added to the reaction at a concentration higher than the DNA molecule. Probes are commonly conjugated with a fluorescent dye or anneal to fluorescently labeled DNA, in order for the hybridization event to be detected. While there are many platforms that utilize this chemistry, most differ in the mode of detection (see Detection Methods).
Primer extension is a very popular technique used for allelic discrimination due to its robustness and flexibility. This technique relies on the ability of DNA polymerase to incorporate the correct complementary deoxyribonucleotide triphosphate (dNTP) according to the template DNA sequence. Primer extension can be utilized for genotyping either in a sequencing approach or an allele-specific PCR approach. The sequencing approach entails the amplification of target DNA and the subsequent identification of a mutated base within the sequence. In the allele-specific PCR approach, a primer is designed to target the polymorphic region of DNA, with its 3′end targeting the potentially mutated nucleotide site. If the DNA polymerase is not able to extend the primer in a 5′ to 3′ directionality, it is an indication that the 3′ end of the primer was not complementary to the template DNA sequence and that the polymorphism in fact exists in the target DNA sequence. Conversely, the successful extension of the primer and subsequent DNA amplification would indicate that the target sequence does not contain the polymorphism. The detection of a PCR product can be achieved in numerous ways, including melting curve analysis and fluorescently labeled hybridization probes.
Another technique implemented in the identification of a genetic variant is DNA ligation. Mechanistically, DNA ligase links two adjacent nucleotides through the generation of a phosphodiester bond. DNA ligase is used to ligate adjacent molecules following the previously described oligonucleotide annealing process. Using this approach, two complementary probes are designed to the DNA region flanking the polymorphism. The 3′end of one probe contains the nucleotide targeted to the polymorphic site. The 5′ end of the other probe contains a phosphate group that would allow for the creation of a phosphodiester bond between the 3′-hydroxyl group and 5′end of the two probes. In the presence of a polymorphism, the 3′oligonucleotide probe will not anneal to the target DNA, thereby preventing DNA ligation, and the formation of a full complementary strand. Even though this technique exhibits the highest specificity from other genotyping methods, it is quite slow and requires many modified probes [98]. A unique feature of this technique is that it does not always require the pre-amplification of DNA by PCR, but instead may utilize ligation probes.
Invasive cleavage relies on the specificity and activity of a thermostable flap endonuclease (FEN) to recognize and cleave structure specific substrates. Similar to the exploitation of DNAligation approaches, DNA amplification may not be necessary. In order to generate this substrate, two oligonucleotides are designed to target the polymorphic region of DNA. One oligonucleotide is allele specific and is complementary to a DNA region downstream of the polymorphism. The 5′end of this oligonucleotide contains a nucleotide which anneals to the polymorphism and is attached to a series of non-complementary nucleotides that will form a flaplike structure. The second oligonucleotide anneals upstream of the polymorphism, and contains a non-complementary nucleotide at the polymorphic site. The three dimensional structure formed by the overlapping nucleotides at the polymorphic site is recognized by the FEN and, upon heat activation, cleaves the nucleotide flap at the site of the genetic variant. Detection of flap cleavage can occur using a fluorescently labeled flap or reporter substrate, as seen in the Invader® Assay (see below).
Detection mechanisms
Genetic variants can be detected in either a direct or indirect manner. Whereas direct detection platforms rely on the physical properties of the DNA variant and detect a polymorphism within the sequence, indirect methods commonly measure light emission from a probe used for DNA detection. An overview of methods using both approaches for SNP identification and genotype will be discussed, using commonly employed platforms as examples.
Indirect Measurements
Fluorescence
Fluorescence is the most common and straightforward detection mechanism used in genotyping methods. There are several modalities through which fluorescence is implemented in an assay, including the attachment of a fluorophore to a probe, such as a PCR primer, as well as via fluorescently labeled dideoxynucleotides, or the intercalation of a fluorescent dye into double stranded DNA during PCR annealing. Fluorescently labeled primers can be constructed using multiple fluorophores as labels, making multiplexed analysis possible. These products, however, require separation from labeled primers in a second step, due to the high primer concentrations in the DNA mixture. Separation can be achieved via solid phase capture or capillary gel electrophoresis, which may be costly. Conversely, methods employing fluorescent DNA-binding dyes are not specific to the composition of the DNA sequence, but rather the formation of double-stranded DNA. A major caveat of using dyes for DNA detection is the increased potential for interference, as the dye may also bind to secondary structures within a single strand.
Conventional sequencing
Conventional sequencing, also known as Sanger sequencing, involves the DNA polymerase-driven incorporation of chainextending deoxynucleotides (dNTPs) or chain-terminating 2′, ′-dideoxynucleotides (ddNTPs) during PCR extension [99]. Since the ddNTPs lack a 3′ hydroxyl group, phosphodiester bonds between nucleotides cannot be created, causing the termination of the extending chain. Therefore, various length products are generated during this process, corresponding to the frequency of ddNTP deposition. Amplified products can then be separated by size, via capillary or gel electrophoresis, and analyzed to determine the nucleotide composition of the DNA sequence. Originally, Sanger sequencing was carried out by fluorescently or radioactively labeling a primer. Four reactions were performed for each sequence, one for each ddNTP: adenine, thymine, cytosine and guanine. The results from each reaction would then be combined to read the entire target sequence. Currently, Sanger sequencing is carried out via capillary electrophoresis. Individual ddNTPs are labeled with fluorophores exhibiting unique fluorescence spectra; based on this single-base pair extension approach, labeled products of varying lengths are generated. DNA sequences are resolved via an ultra-thin capillary, which separates DNA molecules by size. Following size separation, DNA molecules, which are fluorescently labeled with fluorophorespecific ddNTPs, are detected by a laser. The excitation of the fluorophore-specific ddNTPs generates specific emission spectra, each corresponding to a ddNTP; the resulting fluorescence emission may be digitally acquired to provide an electropherogram of the target DNA sequence.
Sanger sequencing is a staple in molecular biology laboratories, and was readily adopted into translational laboratories. However, in spite of advancements in technology and automation, the method is associated with significant limitations. Conventional sequencing has a long run time and requires a significant amount of hands-on personnel time [100]. Additionally, the ability of the method to discriminate between a mutation at a single ucleotide position is quite variable; the limit of detection (LOD), or limit of discrimination, of Sanger sequencing is estimated at 25% [100]. However, this is somewhat dependent on the mutation. For example, regions that are rich in guanine-cytosine (GC) pairs are more prone to forming secondary structures within one strand of DNA; this could cause the polymerase to “skip” the structured region during primer extension, as it is not available for complementary nucleotide deposition [101]. Limit of discrimination is of particular importance when evaluating somatic mutations in tumor cells, due to the substantial heterogeneity in their genetic presentation. The inability to discriminate mutant DNA from normal DNA may result in the reporting of a false negative, and can have a substantial impact on therapeutic treatment modalities [102]. It is therefore crucial that the analytical sensitivity of the assay is low enough to identify mutations in these situations. This method, however, offers the advantage of examining a long gene fragment, a feature that is helpful when evaluating genes prone to frameshifts or insertion/deletion mutations.
High-resolution melting (HRM) curve analysis
HRM is a non-targeted genotyping method that detects SNPs within small PCR amplicons. Following PCR amplification, product DNA is strand-separated via heating at high temperatures (95°C). Following the denaturation of double-stranded amplified DNA, a melting curve is generated through a gradient decrease in temperature and subsequent reformation of double-stranded DNA. As previously described, the emission wavelength of a fluorescent dye is measuredas it intercalates into reformed DNA. Intercalating dyes are highly specific to double-stranded DNA since they are designed to bind to either the major or minor grooves, or between base pairs [103]. Changes in the shape of the melting curve profile against that of a wildtype standard can delineate wild-type from non-wild type sequences. HRM is superior to previously utilized melting curve techniques, primarily because this platform can acquire a higher density of data points per degree Celsius [104]. A more robust collection of data points allows for the detection of very small differences in melting temperature, facilitating the discrimination of a wild type from a nonwild type sequence. This can provide key information on the presence of a mutation within an amplified region of DNA. Thus, along with performing real-time PCR, the instrumentation required for HRM analysis must be capable of capturing fluorescent signals with a high optical and thermal precision [105].
An additional feature of HRM is that the curve shape can determine whether a mutation is homozygous or heterozygous for germline variations, when compared against homozygous andheterozygous standards. A major challenge with this method is in amplicon selection, a sites sensitivity and accuracy is dependent on the amplicon size being under 200 bp and on the GC content ranging from 31-54% to reduce the probability of secondary structure formation, respectively [106]. Achieving this level of selectivity is difficult when designing primers against regions within the highly conserved CY450 superfamily of genes, as they are extremely homologous to each other. Another consideration is the performance of HRM in detecting mutations in tumor material. It is now well established that the sensitivity of HRM is not suitable for detection somatic mutations in a heavily wild type background, just as in the case of DNA extracted from tumor material [104,107]. Lastly, confirmatory testing would be required for samples that produce a mutant melting curve profile, since the variant arising within the amplicon region may not be the SNP in question. Despite the aforementioned limitations, HRM genotyping is a fast and cost-effective platform that can be easily incorporated into routine testing [106,108].
Locked Nucleic Acid (LNA) amplification
Locked nucleic acids are DNA analogs that exhibit high thermostability when annealed to its complimentary DNA Specifically, a LNA is a ribonucleoside containing a 2′-O, 4′-Cmethylene bridge, which, when incorporated into a DNA molecule, is able to change its base-stacking properties to stabilize and rigidify the DNA helix (Figure 2) [109]. Consequently, this conformational change results in increased thermal stability. In the presence of a DNA mismatch, as would be the case in the presence of a genetic polymorphism, the affinity of the oligomer to the target DNA strand is decreased. This results in decreased thermal stability so that DNA denaturation can be achieved at lower temperatures. Using this approach, LNA oligomers offer higher discriminatory power for the identification of genetic variants as compared to the difference in melting temperature (Tm) of a DNA:DNA duplex. In addition to its use in delineating amplicons based on melting temperature differences, LNAs can be used to block oligonucleotide extension. This can be exploited for the identification of SNPs when a probe designed to target the region potentially containing the polymorphism is comprised of a LNA at its 3′ end [110]. The LNA is complementary only to the wild type nucleotide, which allows for the probe to anneal only if the sequence does not contain a polymorphism. By using a DNA polymerase fragment that lacks 3′ exonuclease activity, the LNA will not be removed and extension of the wild type sequence will be inhibited. Thus, there will only be extension of the mutant sequence, which can be detected using a fluorescently labeled primer. This assay has been successful in identifying SNPs in heterogeneous samples that contain an excess in wild type DNA [110]. The use of LNA probes in genotyping assays is an extremely promising tool for SNP characterization [105,109].
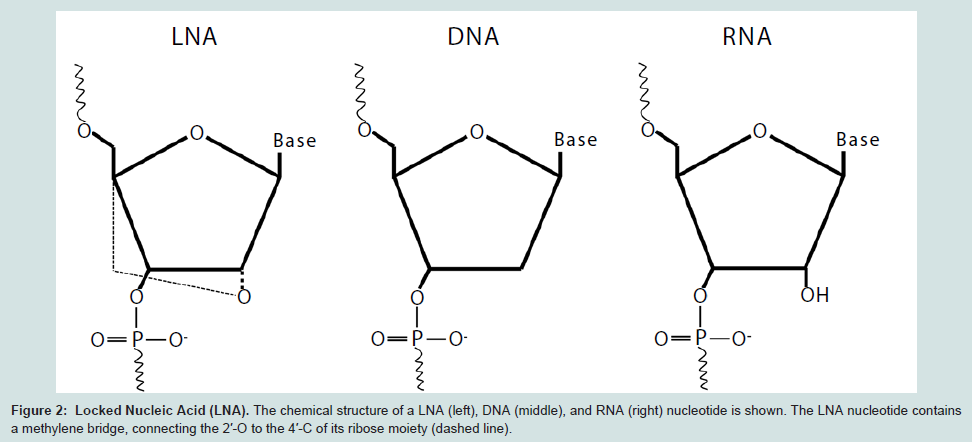
Figure 2: Locked Nucleic Acid (LNA). The chemical structure of a LNA (left), DNA (middle), and RNA (right) nucleotide is shown. The LNA nucleotide containsa methylene bridge, connecting the 2′-O to the 4′-C of its ribose moiety (dashed line).
AmpliChip® CYP450 test
The AmpliChip® from Roche Diagnostics utilizes a microarraybased method that is part of an exclusive group of FDA approved platforms for CYP450 gene testing (Table 2). Specifically, the AmpliChip® tests for two variants of CYP2C19 and twenty seven variants of CYP2D6, including those resulting from gene deletion orduplication, as well as a conversion between CYP2C7P and CYP2D6 [111]. Even though this was the first microarray based platform to be approved for pharmacogenetics testing, it is no longer commonly used, as it has been replaced with more sophisticated testing methodologies.
Table 2: Prediction of Cardiovascular diseases, age adjusted death rate in total population (ASDR per 100,000) 90 countries, year 2008
Gene(s) | Platform | Manufacturer |
CYP2D6 | Amplichip™ | Roche Molecular System, Inc. |
xTAG CYP2D6 Kit v3 | Luminex | |
CYP2C19 | Amplichip™ | Roche Molecular System, Inc. |
eSensor® | GenMarkDx | |
INFINITY™ | Autogenomics | |
Spartan RX™ CYP2C19 System | Spartan | |
Verigene® | Nanosphere | |
xTAG CYP2C19 Kit v3 | Luminex | |
CYP2C9&VKORC1 | Verigene® | Nanosphere |
INFINITY™ | Autogenomics | |
eSensor® | GenMark Dx | |
eQ-PCR LightCycler | TrimGen | |
Gentris Rapid Genotyping Assay (RT-PCR) | ParagonDx, LLC | |
UGT1A1 | Invader UGT1A1 Molecular Assay | Third Wave Technologies, Inc. |
Luminex® xMAP™
The xMAP™system is a high-throughput microsphere-based suspension array platform that has been widely used for SNP genotyping. This detection platform is designed to identify up to one hundred different alleles, which are defined by the user through a tag/anti-tag hybridization system. For example, the xMAP detection system has been used in conjunction with an allele-specific primer extension (ASPE) assay to detect specific SNPs in Factor V Leiden, factor II (prothrombin) and methylene tetrahydrofolate reductase (MTHR) [113]. Specifically, the Tag-It™ system (Tm Bioscience) was used, which is a universal array of one hundred unique 24-mer sequences (tags). Following PCR, tagged amplified products are generated that can hybridize to targeted tag sequences, which are covalently linked to the xMAP microspheres. The xMAP platform consists of one hundred polystyrene microspheres that have been internally dyed with specific ratios of two different fluorochromes. A distinct spectral address is created for each microsphere. The spheres are also labeled with a reporter fluorochrome that is used to detect hybridization of the tag-labeled extension product to microsphere linked anti-tag sequence. The microspheres are aspirated into the xMAP instrument and are individually passed through two different lasers for sphere (tag) identification and primer extension detection through the reporter fluorochrome emission. The xMAP™ system is approved by the FDA for genotyping sixteen CYP2D6 polymorphisms using the Luminex®xTAG® CYP2D6 Kit v3, and has been recently approved for genotyping three CYP2C19 variants, CYP2C19*2, CYP2C19*3, and CYP2C19*17, when used with the Luminex®xTAG® CYP2C19 Kit v3 (Table 2).
The most evident advantage of using this type of system is that many different mutations can be tested for one gene. This could potentially decrease reagent costs and personnel time as well as the possibility of mixing up samples. However, PCR amplification, primer extension, and hybridization reactions all occur in different reaction tubes, which could increase the risk of sample contamination, as well as workflow challenges. Additionally, the assay is dependent on three different molecular steps and two different lasers for detection, all of which must be optimized for the accurate calling of alleles.
Fluorescence Energy Transfer (FRET)
FRET is a common detection method utilized in molecular applications. This method relies on the principle that one fluorescent molecule can transfer excitation energy, in the form of a photon, to another fluorescent molecule without the emission of that photon. The prerequisites for this energy transfer include an overlap between the emission spectrum of the one molecule (donor dye) and the excitation spectrum of the second molecule (acceptor dye). Also, molecules must be placed at a close distance from each other (10- 100 Å). Lastly, the orientations of the donor and acceptor dye dipolemoments must be exactly parallel [114]. The acceptor and donor pairs typically used in molecular applications can be comprised of a fluorescent dye and a quencher dye, either of which may be detected. In some cases, two fluorescent molecules could be used, in which case fluorescence depolarization would be assessed. The wide appeal for this mechanism lies in the fact that the distance requirements between the two dyes can be exploited. For instance, FRET can be used in ligation- or primer extension-based genotyping methods, because, in both cases, two DNA molecules are brought into close proximity to each other. Even though this method offers great allelic discrimination, the use of labeled probes is quite expensive, especially for approaches that require both a dually labeled mutant and wild type probe for each genetic variant.
Invader® Assay
This assay uses an invasive cleavage technique for the detection of SNPs. Briefly; a flap endonuclease (FEN) cleaves a structure formed when two overlapping allele-specific probes hybridize to a target sequence (Figure 3). One of the probes contains nucleotides that do not anneal to the target DNA, forming a flap-like structure. Once this “flap” of non-complementary nucleotides is cleaved by FEN, it anneals to a secondary probe. During this secondary reaction, the flap acts as an “invader” probe, annealing to a secondary universal probe, creating another flap-like structure; this is again enzymatically cleaved. Of note, the universal probe contains a fluorescent molecule on the 5′ end of the flap as well as an internal quencher that minimizes fluorescence detection. Once the flap structure is cleaved, the fluorescent molecule is distanced from the quencher, resulting in fluorescent emission [115]. This assay offers many advantages, including potential to be used without pre-amplification; it is currently FDA-approved for UTG1A1 genotyping (Table 2). It also has the potential for automation and high throughput, as it has been recently used in research studies as a multiplex assay, detecting up to 82,935 SNPs [116,117]. However, even though this method has been used in large scale SNP identification studies, its multiplexing potentials for clinical genotyping use are limited, as testing of two alleles for each SNP must still be carried out in different reaction wells [105].
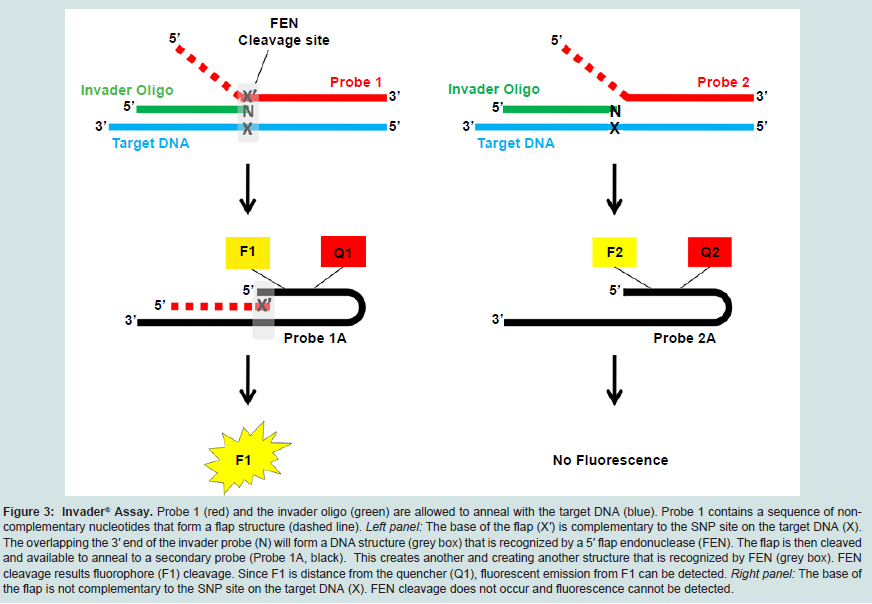
Figure 3: Invader® Assay.: Probe 1 (red) and the invader oligo (green) are allowed to anneal with the target DNA (blue). Probe 1 contains a sequence of noncomplementary nucleotides that form a flap structure (dashed line). Left panel: The base of the flap (X′) is complementary to the SNP site on the target DNA (X). The overlapping the 3′ end of the invader probe (N) will form a DNA structure (grey box) that is recognized by a 5′ flap endonuclease (FEN). The flap is then cleaved and available to anneal to a secondary probe (Probe 1A, black). This creates another and creating another structure that is recognized by FEN (grey box). FEN cleavage results fluorophore (F1) cleavage. Since F1 is distance from the quencher (Q1), fluorescent emission from F1 can be detected. Right panel: The base of the flap is not complementary to the SNP site on the target DNA (X). FEN cleavage does not occur and fluorescence cannot be detected.
Real-time quantitative PCR (rt-qPCR) probes
A commonly used technology for genotyping is rt-qPCR, which detects and quantifies DNA molecules during PCR amplification. This is made possible through the exploitations of a fluorescent dye that intercalates with duplex DNA or the use of fluorescently labeled allele-specific probes. TaqMan® probes are probes designed to detect polymorphisms and are dually labeled with both an acceptor and donor dye, usually containing a fluorophore at the 5′ end and quencher molecule at the 3′ end of the probe, respectively. Two allelespecific probes, one covering the wild type nucleotide or sequence and the other the polymorphic sequence, are added to the PCR reaction along with unlabeled primers aimed to mplify the DNAregion of interest. Each probe anneals to its specific complementary sequence. During the PCR reaction, a DNA polymerase facilitates the primer extension in a 5′ to 3′ directionality, until it reaches the 5′ end of the probe. Starting from the 5′ end, the entire probe is subsequently degraded by the 5′-3′ exonuclease activity found in the DNA polymerase, as in the case of Taq DNA polymerase [118]. This allows for the separation of the fluorophore and quencher molecules, with the subsequent detection of fluorophore emissions from the two different dyes, which correspond to wild type and polymorphic probes. The intensity of emitted fluorescence by the wild type or mutant probe can then be used both for genotype detection as well as quantification of alleles. Quantification can be extrapolated from a standard curve created from known DNA concentrations or from a comparative threshold cycle (CT) method (ΔΔCT), which compares the CT value of the gene of interest with that of a control gene. The latter method allows for the normalization of CT values to control for variations in global DNA expression from sample to sample. If a genetic variant is present, it may be characterized as heterozygous or homozygous for a polymorphism, as heterozygotes would have detect fluorescence emission spectra from both the wild type and mutant probes. Although this technique offers advantages such as high specificity and multiplexing capabilities, labeled probes are costly, and each reaction must be optimized with regards to annealing temperatures and ΔΔCT.
Molecular beacon probes have also been used to determine DNA sequences. These probes are dually labeled with an acceptor and donor dye at the 5′ and 3′ ends, respectively. When the probes do not anneal to their target DNA, they assume a secondary hairpin structure,bringing the dyes in close proximity to each other. Once hybridized to the DNA, the dyes are spatially separated, resulting in an increase in fluorescence. Just as with TaqMan® probes, two molecular beacon probes can be simultaneously added to an amplification reaction, one targeting the wild type allele and the other the polymorphic allele. The probes are labeled with different fluorophore sets in order to quantify each allele. One of the main advantages in using a molecular beacon-based system is that they are extremely sensitive and selective to a degree that is thought by some to be superior from other fluorescent probes [119]. Their high sensitivity is primarily due to their high signal-to-background ratio and selectivity to their hairpin confirmation requiring for complete annealing to the target in order to be dissolved [119,120]. However, even though software has been developed to assist with probe design, it is still believed to be challenging and time consuming [121].
Scorpion molecules are unique in their design as one oligonucleotide can function both as a PCR primer as well as a detector probe. Specifically, the probe character of the molecule isattached to the 5′ primer portion, the former of which is designed to anneal to the extension product produced by the primer. The probe is prevented from product incorporation via a “PCR blocker”, which is a hexaethylene glycol (HEG) molecule located between the primer and the probe elements. The probe portion assumes a stem-loop configuration when it is not annealed to its complementary DNA and contains a fluorescent and quencher dye at its two ends. Just as the previously described molecular beacons approach, fluorescence will not be detected until the probe anneals to its complementary DNA, and the quencher is sufficiently distanced from the fluorophore. The fact that one molecule is able to perform both the reaction priming and detection creates a great advantage in using this method for genotyping. Not only are the kinetics of the reaction faster and more predictable, but detection signal is also stronger because the assay does not allow for any other side-events, such as amplicon reannealing, to compete with the primary reaction [105].
Luminescence
Luminescence emission occurs when the enzyme luciferase acts upon its substrate, luciferin, in an adenosine triphosphate (ATP)- dependent reaction. This chemistry can be utilized in genotyping platforms, such as in pyrosequencing [122,123]. In this application, enzymes are added into the PCR reaction along with a luciferin substrate to convert pyrophosphate (PPi) into ATP. This method is based on primer extension, and all four dNTPs are sequentially added to the reaction; once a nucleoside triphosphate incorporates into the DNA chain, a PPi is released [122]. The PPi is used as a substrate along with adenosine 5′-phosphosulfate (ASP) by ATP. Luciferase is then able to use the ATP to convert luciferin into oxy-luciferase, which emits luminescence that can be measured by a luminometer. Thus, light emission only occurs when a complementary nucleotide is incorporated into the growing primer chain. In order to monitor which nucleotide is being added into the chain, a stepwise addition of each of the four nucleotides is required for each position in the sequence; this way, the light intensity will be proportionate to the frequency of a specific nucleotide in the chain.
Pyrosequencing is one of the more straightforward genotyping methods regarding result interpretation [100]. There is only one signal detected as a result of any nucleotide incorporation, as opposed to conventional sequencing, which assigns a different dye for each nucleotide. This single signal detection also allows for a lower limit of detection (LOD) of 5-12%, making the method compelling for mutational analysis in a heterogeneous tumor cell population [100]. However, a drawback to this method is that only 20-40 bases can be evaluated per reaction, even though improvements have been made to address this [124]. For instance, single stranded DNA binding (SSB) protein can be added to the reaction in order to eliminate the creation of secondary structures in the template DNA, which can significantly impact the processivity and efficiency of the DNA polymerase [125]. Nevertheless, due to this limitation, pyrosequencing is suitable for detecting mutations within known hotspots of the gene.
Direct Measurements
The most direct method for the detection of polymorphisms is mass spectrometry (MS). As oppose to indirect methods, detection by MS does not rely on the efficiency of a secondary reaction such as dye excitation or enzymatic activity. MS is able to determine sequences by measuring the mass to charge (m/z) ratios of products formed after a PCR reaction. All MS methods developed for biomolecule detection require an ionization step prior to detection, which is achieved either by electron spray ionization (ESI) or matrix-assisted laser desorption/ionization (MALDI). While ESI can also be used for SNP identification, MALDI is most commonly used, particularly in conjunction with time-of-flight (TOF) MS [126]. Mos MALDITOF methods follow a similar step-wise process: DNA purification, amplification of the region of interest, allele-specific primer extension and mass labeling reaction, purification of products, and MALDITOF MS [126].
The MassARRAY® iPLEX assay from Sequenom is a commercially available MALDI-TOF MS platform for SNP genotyping. The MassARRAY® is an automated system designed to perform PCR reactions in a 384-well plate format. The system can be programmed to perform PCR with one to four primer groups per plate, which allows for a throughput of four different PCR reactions for 96 samples per run. After completion of the PCR reaction using traditional PCRamplification methods, shrimp alkaline phosphatase (SAP) is used to inactive any unincorporated dNTPs. Once the DNA regions of interest are amplified and purified, a second round of primer extension takes place on an automated iPLEX system using a primer that anneals just upstream of the polymorphism site, with its 5′end complementary to the immediately preceding nucleotide. The reaction also contains ddNTPs, and similar to conventional sequencing, the polymerase will stop extending the strand once a ddNTP is incorporated into the chain. Each of the four ddNTPs used in this assay are uniquely mass modified, so that the incorporation of a ddNTP at the site of a potential polymorphism can be distinguished. In MALDI-TOF analysis, short laser beam pulses are used to vaporize and ionize analytes on a solid surface [127,128]. This is achieved by co-crystallization of the matrix and analyte followed by laser vaporization of the matrix in order for the analyte ions to be released. These are then passed through a TOF-MS analyzer for detection. Since the molecular mass of the primers and each ddNTP are known, the MassARRAY® software can determine which dNTP was added. The software can also quantify the increase in mass for wild type and variant-specific primers, a feature that can be used for somatic mutation analysis.
There are many advantages to using platform direct platform for variant detection. Firstly, SNP detection is not reliant on the efficiency of hybridization, enzyme activity, or luorescence emission, all which can impact DNA detection. Secondly, even though the initial costs for instrumentation are expensive, the routine performance of this method is extremely cost effective due to the low cost of reagents. This platform, however, can only detect one polymorphism per sample at a time and is preceded by two long PCR and incubation steps. Additionally, the quality of DNA used for detection must be highly purified, which requires additional clean-up steps. All these factors contribute to the platform’s long turnaround time.
Criteria for selecting a genotyping method
When choosing a genotyping method for any assay, two factors are generally considered: the requirements of the assay set by the user and the analytical performance of the method. First, the assay requirements must be identified based on the type of mutation being examined and the level of heterogeneity within the sample. For example, while frameshifts may be accurately determined using conventional sequencing, they cannot be deciphered using pyrosequencing, as the latter platform can only evaluate small length regions of 20-40 bp [124]. Conversely, if an assay is required to detect mutations within a highly heterogeneous sample, such as in biopsy samples containing a high non-cancerous cells, pyrosequencing, a method with a discriminatory threshold of around 10%, would be preferable over conventional sequencing.
Furthermore, if more targeted PGx testing is to be performed in a clinical laboratory setting, it is important to decipher which SNPs should be tested. The selection of variants should be partially based on the patient population which the laboratory serves; studies haverevealed that specific SNPs within germline drug metabolizing genes can be prominent within specific ethnic groups [129]. For example, CYP3A5 is expressed only in approximately 10% of the European population [130]. This is mostly due to an extremely common polymorphism among ethnic groups (the CYP3A5*3 variant) which results in the creation of a non-active truncated protein [31]. Additionally, it is likely that a patient population treated at the same institution will have similar medications prescribed, depending on the institution’s specialty. Thus, the laboratory should offer testing for SNPs pertinent to those medications. Many of the FDA approved array-based platforms only test a pre-defined set of polymorphisms and genes. Since the interest in individual polymorphisms can vary, it would be desirable for a platform to offer flexibility in gene and polymorphism selection.
An additional consideration for assay requirements is whether the assay will be performed in an established clinical setting. If so, the compatibility of the prospective method to the current workflow of the clinical lab would have to be assessed. Moreover, the required turn-around-time from test ordering to test reporting for the assay should also be determined and evaluated for any prospective method. This would be necessary not only for laboratory and personnel management, but also for assessing the assay’s clinical utility, as it will only be effective if a result is reported prior to medication administration. Lastly, the cost of the test for both instrumentation and routine performance, including reagents and labor, should also be considered. For instance, reagent costs are much lower for methods using a DNA-binding dye for detection than individual fluorescent probes.
Platform selection based on analytical performance can be evaluated based on assay specificity, sensitivity, accuracy, precision, throughput and reagent stability [105]. The first three parameters are uniquely defined for molecular assays; for example, specificity can be defined as the assay’s ability of discriminating the SNP of interest in the presence of interfering DNA and can be assessed by determining primer pecificity [105]. This is particularly important for CYP450 genes which are highly homologous to each other. Assay sensitivity is dependent on the assay’s limit of detection, which is considered the lowest amount of DNA detected by the assay. The significance of sensitivity is evident in assays aimed to quantify mutations in tumor cells which may have a low percentage of mutated DNA. Finally, selectivity is determined based on the assignment of a genotype which is identical to the gold standard method, conventional sequencing.
An ideal genotyping platform that incorporates the finest analytical performance characteristics as well as the flexibility to be used by any laboratory does not yet exist. Additionally, only a small percentage (5%) of molecular clinical laboratory testing is dedicated to SNP detection for PGx application [131]. These could be the case because the characterization of phenotype-genotype relationships were initially pursued to develop a personalized medicine approach to define a therapeutic window for drug dosage and optimize treatment success [29]. However, even though individuals can inherit (germline) or acquire (somatic) a genetic aberration, they may not necessarily exhibit the same phenotypic characteristics. Along with genetic factors, drug response is also influenced by a number of stimuli, including environmental and physiological factors, as well as pathological state and clinical factors. Environmental factors include administration of drugs, alcohol drinking, exposure to chemicals, toxins, or cigarette smoke, as well as diet; physiological factors include age, sex, and exercise [4]. Thus, even though the concept of genotypedependent drug adjustment is appealing, drug dosing is a continuous process that requires constant monitoring due to the transient nature of the previously described factors.
References
- McLeod HL, Sargent DJ, Marsh S, Green EM, King CR, et al. (2010) Pharmacogenetic predictors of adverse events and response to chemotherapy in metastatic colorectal cancer: results from North American Gastrointestinal Intergroup Trial N9741. J Clin Oncol 28: 3227-3233.
- MacPhee IA, Fredericks S, Tai T, Syrris P, Carter ND, et al. (2004) The influence of pharmacogenetics on the time to achieve target tacrolimus concentrations after kidney transplantation. Am J Transplant 4: 914-919.
- Jannetto PJ, Bratanow NC (2010) Pharmacogenomic considerations in the opioid management of pain. Genome Med 2: 66.
- Ma Q, Lu AY (2011) Pharmacogenetics, pharmacogenomics, and individualized medicine. Pharmacol Rev 63: 437-459.
- Phillips KA, Veenstra DL, Oren E, Lee JK, Sadee W (2001) Potential role of pharmacogenomics in reducing adverse drug reactions: a systematic review. JAMA 286: 2270-2279.
- Bates DW, Gawande AA (2000) Error in medicine: what have we learned? Minn Med 83: 18-23.
- Vargas E, Terleira A, Hernando F, Perez E, Cordon C, et al. (2003) Effect of adverse drug reactions on length of stay in surgical intensive care units. Crit Care Med 31: 694-698.
- Gurwitz JH, Field TS, Judge J, Rochon P, Harrold LR, et al. (2005) The incidence of adverse drug events in two large academic long-term care facilities. Am J Med 118: 251-258.
- Lazarou J, Pomeranz BH, Corey PN (1998) Incidence of adverse drug reactions in hospitalized patients: a meta-analysis of prospective studies. JAMA 279: 1200-1205.
- Ernst FR, Grizzle AJ (2001) Drug-related morbidity and mortality: updating the cost-of-illness model. J Am Pharm Assoc (Wash) 41: 192-199.
- Classen DC, Pestotnik SL, Evans RS, Lloyd JF, Burke JP (1997) Adverse drug events in hospitalized patients. Excess length of stay, extra costs, and attributable mortality. JAMA 277: 301-306.
- Kitzmiller JP, Groen DK, Phelps MA, Sadee W (2011) Pharmacogenomic testing: relevance in medical practice: why drugs work in some patients but not in others. Cleve Clin J Med 78: 243-257.
- Futreal PA, Coin L, Marshall M, Down T, Hubbard T, et al. (2004) A census of human cancer genes. Nat Rev Cancer 4: 177-183.
- Amado RG, Wolf M, Peeters M, Van Cutsem E, Siena S, et al. (2008) Wildtype KRAS is required for panitumumab efficacy in patients with metastatic colorectal cancer. J Clin Oncol 26: 1626-1634.
- Bokemeyer C, Bondarenko I, Makhson A, Hartmann JT, Aparicio J, et al. (2009) Fluorouracil, leucovorin, and oxaliplatin with and without cetuximab in the first-line treatment of metastatic colorectal cancer. J Clin Oncol 27: 663-671.
- De Roock W, Piessevaux H, De Schutter J, Janssens M, De Hertogh G, et al. (2008) KRAS wild-type state predicts survival and is associated to early radiological response in metastatic colorectal cancer treated with cetuximab. Ann Oncol 19: 508-515.
- Di Fiore F, Blanchard F, Charbonnier F, Le Pessot F, Lamy A, et al. (2007) Clinical relevance of KRAS mutation detection in metastatic colorectal cancer treated by Cetuximab plus chemotherapy. Br J Cancer 96: 1166-1169.
- Der CJ, Cooper GM (1983) Altered gene products are associated with activation of cellular rasK genes in human lung and colon carcinomas. Cell 32: 201-208.
- Mark W Linder, RVJ (2006) Fundamentals of Pharmacogenetics: Enabling the Practice of Personalized Medicine. Pharmacogenomics and Proteomics, Washington DC: AACC Press, 13-19.
- Weber WW (2006) Techniques for Analyzing Pharmacogenetic Variation. Pharmacogenomics and Proteomics, Washington, DC: AACC Press.
- Monaghan G, Ryan M, Seddon R, Hume R, Burchell B (1996) Genetic variation in bilirubin UPD-glucuronosyltransferase gene promoter and Gilbert’s syndrome. Lancet 347: 578-81.
- US Food and Drug Administration (FDA) (2013) Table of Pharmacogenomic Biomarkers in Drug Labels.
- US Department of Health and Human Services (FDA) (2005) Attachment to Guidance on Pharmacogenomic Data Submissions.
- Bell GC, Crews KR, Wilkinson MR, Haidar CE, Hicks JK, et al. (2014) Development and use of active clinical decision support for preemptive pharmacogenomics. J Am Med Inform Assoc 21: e93-9.
- Fukasawa T, Suzuki A, Otani K (2007) Effects of genetic polymorphism of cytochrome P450 enzymes on the pharmacokinetics of benzodiazepines. J Clin Pharm Ther 32: 333-41.
- Hammet-Stabler CA (2011) Pharmacokinetics for the Practicing Clinical Chemist. (2nd edtn) Contemporary Practice in Clinical Chemistry; Clarke W, Editor. Washington DC., AACCPress.
- Kashuba AM, Bertino J (2005) Mechanisms of Drug Interactions I, in Drug Interactions in Infectious Diseases; Piscitelli S, K. Rodvold, Editors. Humana Press. 13-39.
- Daly AK (2012) Genetic polymorphisms affecting drug metabolism: recent advances and clinical aspects. Adv Pharmacol 63: 137-67.
- Lesko LJ, Schmidt S (2012) Individualization of drug therapy: history, present state, and opportunities for the future. Clin Pharmacol Ther 92:458-66.
- Lamba JK, Lin YS, Schuetz EG, Thummel KE (2002) Genetic contribution to variable human CYP3A-mediated metabolism. Adv Drug Deliv Rev 54: 1271-94.
- Kuehl P, Zhang J, Lin Y, Lamba J, Assem M, et al. (2001) Sequence diversity in CYP3A promoters and characterization of the genetic basis of polymorphic CYP3A5 expression. Nat Genet 27: 383-91.
- Wolf CR, Smith G (1999) Cytochrome P450 CYP2D6. IARC Sci Publ 148: 209-229.
- Ingelman-Sundberg M, Evans WE (2001) Unravelling the functional genomics of the human CYP2D6 gene locus. Pharmacogenetics 11: 553-4.
- Bernal ML, Sinues B, Johansson I, McLellan RA, Wennerholm A, et al. (1999) Ten percent of North Spanish individuals carry duplicated or triplicated CYP2D6 genes associated with ultrarapid metabolism of debrisoquine. Pharmacogenetics 9: 657-60.
- Aynacioglu AS, Sachse C, Bozkurt A, Kortunay S, Nacak M, et al. (1999) Low frequency of defective alleles of cytochrome P450 enzymes 2C19 and 2D6 in the Turkish population. Clin Pharmacol Ther 66: 185-92.
- Gaedigk A, Simon SD, Pearce RE, Bradford LD, Kennedy MJ, et al. (2008) The CYP2D6 activity score: translating genotype information into a qualitative measure of phenotype. Clin Pharmacol Ther 83: 234-42.
- Kirchheiner J, Nickchen K, Bauer M, Wong ML, Licinio J, et al. (2004) Pharmacogenetics of antidepressants and antipsychotics: the contribution of allelic variations to the phenotype of drug response. Mol Psychiatry 9: 442-73.
- Zanger UM, Raimundo S, Eichelbaum M (2004) Cytochrome P450 2D6: overview and update on pharmacology, genetics, biochemistry. Naunyn Schmiedebergs Arch Pharmacol 369: 23-37.
- Ma MK, Woo MH, McLeod HL (2002) Genetic basis of drug metabolism. Am J Health Syst Pharm 59: 2061-9.
- Davis MP, Homsi J (2001) The importance of cytochrome P450 monooxygenase CYP2D6 in palliative medicine. Support Care Cancer 9: 442-451.
- Kirchheiner J, Schmidt H, Tzvetkov M, Keulen JT, Lotsch J, et al. (2007)Pharmacokinetics of codeine and its metabolite morphine in ultra-rapid metabolizers due to CYP2D6 duplication. Pharmacogenomics J 7: 257-265.
- Candiotti KA, Yang Z, Rodriguez Y, Crescimone A, Sanchez GC, et al. (2009) The impact of CYP2D6 genetic polymorphisms on postoperative morphine consumption. Pain Med 10: 799-805.
- Daly AK (2010) Pharmacogenetics and human genetic polymorphisms. Biochem J 429: 435-449.
- Inaba T (1990) Phenytoin: pharmacogenetic polymorphism of 4′-hydroxylation. Pharmacol Ther 46: 341-347.
- Fritz S, Lindner W, Roots I, Frey BM, Kupfer A (1987) Stereochemistry of aromatic phenytoin hydroxylation in various drug hydroxylation phenotypes in humans. J Pharmacol Exp Ther 241: 615-622.
- Aynacioglu AS, Brockmoller J, Bauer S, Sachse C, Guzelbey P, et al. (1999) Frequency of cytochrome P450 CYP2C9 variants in a Turkish population and functional relevance for phenytoin. Br J Clin Pharmacol 48: 409-415.
- Collet JP, Hulot JS, Pena A, Villard E, Esteve JB, et al. (2009) Cytochrome P450 2C19 polymorphism in young patients treated with clopidogrel after myocardial infarction: a cohort study. Lancet 373: 309-317.
- Shuldiner AR, O’Connell JR, Bliden KP, Gandhi A, Ryan K, et al. (2009) Association of cytochrome P450 2C19 genotype with the antiplatelet effect and clinical efficacy of clopidogrel therapy. JAMA 302: 849-857.
- Simon T, Verstuyft C, Mary-Krause M, Quteineh L, Drouet E, et al. (2009) Genetic determinants of response to clopidogrel and cardiovascular events. N Engl J Med 360: 363-375.
- SMega JL, Close SL, Wiviott SD, Shen L, Hockett RD, et al. (2009) Cytochrome p-450 polymorphisms and response to clopidogrel. N Engl J Med 360: 354-362.
- Mega JL, Simon T, Collet JP, Anderson JL, Antman EM, et al. (2010) Reduced-function CYP2C19 genotype and risk of adverse clinical outcomes among patients treated with clopidogrel predominantly for PCI: a metaanalysis. JAMA 304:1821-1830.
- Li-Wan-Po A, Girard T, Farndon P, Cooley C, Lithgow J (2010) Pharmacogenetics of CYP2C19: functional and clinical implications of a new variant CYP2C19*17. Br J Clin Pharmacol 69: 222-230.
- Sibbing D, Koch W, Gebhard D, Schuster T, Braun S, et al. (2010) Cytochrome 2C19*17 allelic variant, platelet aggregation, bleeding events, and stent thrombosis in clopidogrel-treated patients with coronary stent placement. Circulation 121: 512-8.
- Marsh S, Van Booven DJ (2009) The increasing complexity of mercaptopurine pharmacogenomics. Clin Pharmacol Ther 85:139-41.
- Schaeffeler E, Fischer C, Brockmeier D, Wernet D, Moerike K, et al. (2004) Comprehensive analysis of thiopurine S-methyltransferase phenotypegenotype correlation in a large population of German-Caucasians and identification of novel TPMT variants. Pharmacogenetics 14: 407-17.
- Yates CR, Krynetski EY, Loennechen T, Fessing MY, Tai HL, et al. (1997) Molecular diagnosis of thiopurine S-methyltransferase deficiency: genetic basis for azathioprine and mercaptopurine intolerance. Ann Intern Med 126: 608-14.
- Relling MV, Hancock ML, Rivera GK, Sandlund JT, Ribeiro RC, et al. (1999) Mercaptopurine therapy intolerance and heterozygosity at the thiopurine S-methyltransferase gene locus. J Natl Cancer Inst 91: 2001-8.
- Relling MV, Gardner EE, Sandborn WJ, Schmiegelow K, Pui CH, et al. (2011) Clinical Pharmacogenetics Implementation Consortium guidelines for thiopurine methyltransferase genotype and thiopurine dosing. Clin Pharmacol Ther 89: 387-91.
- Bosma PJ, Chowdhury JR, Bakker C, Gantla S, de Boer A, et al. (1995) The genetic basis of the reduced expression of bilirubin UDPglucuronosyltransferase 1 in Gilbert’s syndrome. N Engl J Med 333: 1171-5.
- Burchell B, M Soars, G Monaghan, A Cassidy, D Smith, et al. (2000) Drug-mediated toxicity caused by genetic deficiency of UDPglucuronosyltransferases. Toxicol Lett 112-113: 333-40.
- Cote JF, Kirzin S, Kramar A, Mosnier JF, Diebold MD, et al. (2007) UGT1A1 polymorphism can predict hematologic toxicity in patients treated with irinotecan. Clin Cancer Res 13: 3269-75.
- Hoskins JM, Goldberg RM, Qu P, Ibrahim JG, McLeod HL (2007) UGT1A1*28 genotype and irinotecan-induced neutropenia: dose matters. J Natl Cancer Inst 99: 1290-5.
- Nagar S, Blanchard R (2006) Pharmacogenetics of uridinediphosphoglucuronosyltransferase (UGT) 1A family members and its role in patient response to irinotecan. Drug Metab Rev 38: 393-409.
- Innocenti F, Undevia SD, Iyer L, Chen PX, Das S, et al. (2004) Genetic variants in the UDP-glucuronosyltransferase 1A1 gene predict the risk of severe neutropenia of irinotecan. J Clin Oncol 22: 1382-8.
- DiPiro, Spruill JT, Wade WJ, Blouin WE, Pruemer RA (2010) Introduction to Pharmacokinetics and Pharmacodynamics. (5th edn) Concepts in Clinical Pharmacokinetics; DiPiro JT, editor. American Society of Health-System Pharmacists, Bethesda MD.
- Tzvetkov M, von Ahsen N (2012) Pharmacogenetic screening for drug therapy: from single gene markers to decision making in the next generation sequencing era. Pathology 44: 166-80.
- Sconce EA, Khan TI, Wynne HA, Avery P, Monkhouse L, et al. (2005) The impact of CYP2C9 and VKORC1 genetic polymorphism and patientcharacteristics upon warfarin dose requirements: proposal for a new dosing regimen. Blood 106: 2329-33.
- D’Andrea, G, D’Ambrosio RL, Di Perna P, Chetta M, Santacroce R, et al. (2005) A polymorphism in the KORC1 gene is associated with an interindividual variability in the dose-anticoagulant effect of warfarin. Blood 105: 645-9.
- Marsh S, King CR, Porche-Sorbet RM, Scott-Horton TJ (2006) Eby CS Population variation in VKORC1 haplotype structure. J Thromb Haemost 4: 473-4.
- Hetherington S, McGuirk S, Powell G, Cutrell A, Naderer O, et al. (2001) Hypersensitivity reactions during therapy with the nucleoside reverse transcriptase inhibitor abacavir. Clin Ther 23: 1603-14.
- Mallal S, Nolan D, Witt C, Masel G, Martin AM, et al. (2002) Association between presence of HLA-B*5701, HLA-DR7, and HLA-DQ3 and hypersensitivity to HIV-1 reverse-transcriptase inhibitor abacavir. Lancet 359: 727-32.
- Martin MA, Kroetz DL (2013) Abacavir pharmacogenetics from initial reports to standard of care. Pharmacotherapy 33: 765-75.
- Hetherington S, Hughes AR, Mosteller M, Shortino D, Baker KL, et al. (2002) Genetic variations in HLA-B region and hypersensitivity reactions to abacavir. Lancet 359: 121-2.
- Shankarkumar U, Sridharan B, Pitchappan RM (2003) HLA diversity among Nadars, a primitive Dravidian caste of South India. Tissue Antigens 62: 542-7.
- Martin MA, Klein TE, Dong BJ, Pirmohamed M, Haas DW, et al. (2012) Clinical pharmacogenetics implementation consortium guidelines for HLA-B genotype and abacavir dosing. Clin Pharmacol Ther 91: 734-8.
- Marra CA, Esdaile JM, Anis AH (2002) Practical pharmacogenetics: the cost effectiveness of screening for thiopurine s-methyltransferase polymorphisms in patients with rheumatological conditions treated with azathioprine. J Rheumatol 29: 2507-12.
- Mallal S, Phillips E, Carosi G, Molina JM, Workman C, et al. (2008) HLA-B*5701 screening for hypersensitivity to abacavir. N Engl J Med 358: 568-79.
- Chung WH, Hung SI, Hong HS, Hsih MS, Yang LC, et al. (2004) Medical genetics: a marker for Stevens-Johnson syndrome. Nature 428: 486.
- Hung SI, Chung WH, Liou LB, Chu CC, Lin M (2005) et al., HLA-B*5801 allele as a genetic marker for severe cutaneous adverse reactions caused by allopurinol. Proc Natl Acad Sci U S A 102: 4134-.
- Daly AK, Donaldson PT, Bhatnagar P, Shen Y, Pe’er I, et al. (2009) HLA-B*5701 genotype is a major determinant of drug-induced liver injury due to flucloxacillin. Nat Genet 41: 816-9.
- Normanno N, De Luca A, Bianco C, Strizzi L, Mancino M, et al. (2006) Epidermal growth factor receptor (EGFR) signaling in cancer. Gene 366: 2-16.
- Krause DS, Van Etten RA (2005) Tyrosine kinases as targets for cancer therapy. N Engl J Med 353: 172-87.
- Mayer A, Takimoto M, Fritz E, Schellander G, Kofler K, et al. (1993) The prognostic significance of proliferating cell nuclear antigen, epidermal growth factor receptor, and mdr gene expression in colorectal cancer. Cancer 71: 2454-60.
- De Witt Hamer PC Small molecule kinase inhibitors in glioblastoma: a systematic review of clinical studies. (2010) Neuro Oncol 12: 304-16.
- Savonarola A, Palmirotta R, Guadagni F, Silvestris F (2012) Pharmacogenetics and pharmacogenomics: role of mutational analysis in anti-cancer targeted therapy. Pharmacogenomics J 12: 277-86
- Cataldo VD, Gibbons DL, Perez-Soler R , Quintas-Cardama A, Treatment of non-small-cell lung cancer with erlotinib or gefitinib. N Engl J Med 2011 364: 947-55.
- Riely GJ, Politi KA, Miller VA, Pao W (2006) Update on epidermal growth factor receptor mutations in non-small cell lung cancer. Clin Cancer Res 12: 7232-41.
- Linardou H, Dahabreh IJ, Bafaloukos D, Kosmidis P, Murray S (2009) Somatic EGFR mutations and efficacy of tyrosine kinase inhibitors in NSCLC. Nat Rev Clin Oncol 6: 352-66
- Bell DW, Gore I, Okimoto RA, Godin-Heymann N, Sordella R, et al. (2005) Inherited susceptibility to lung cancer may be associated with the T790M drug resistance mutation in EGFR. Nat Genet 37: 1315-6.
- Yun CH, Mengwasser KE, Toms AV, Woo MS, Greulich H, et al. (2008) The T790M mutation in EGFR kinase causes drug resistance by increasing the affinity for ATP. Proc Natl Acad Sci U S A 105: 2070-5.
- Pao W, Miller VA, Politi KA, Riely GJ, Somwar R, et al. (2005) Acquired resistance of lung adenocarcinomas to gefitinib or erlotinib is associated with a second mutation in the EGFR kinase domain. PLoS Med 2: e73.
- Yen LC, Uen YH, Wu DC, Lu CY, Yu FJ, et al. (2010) Activating KRAS mutations and overexpression of epidermal growth factor receptor asindependent predictors in metastatic colorectal cancer patients treated with cetuximab. Ann Surg 251: 254-60.
- Lievre A, Bachet JB, Boige V, Cayre A, Le Corre D, et al. (2008) KRAS mutations as an independent prognostic factor in patients with advanced colorectal cancer treated with cetuximab. J Clin Oncol 26: 374-9.
- Camp ER, Summy J, Bauer TW, Liu W, Gallick GE, et al. (2005) Molecular mechanisms of resistance to therapies targeting the epidermal growth factor receptor. Clin Cancer Res 11: 397-405.
- Kumar R, Angelini S, Snellman E, Hemminki K (2004) BRAF mutations are common somatic events in melanocytic nevi. J Invest Dermatol 122: 342-8.
- Davies H, Bignell GR, Cox C, Stephens P, Edkins S, et al. (2002) Mutations of the BRAF gene in human cancer. Nature 417: 949-54.
- Chapman PB, Hauschild A, Robert C, Haanen JB, Ascierto P, et al. (2011) Improved survival with vemurafenib in melanoma with BRAF V600E mutation. N Engl J Med 364: 2507-16.
- Kwok PY (2001) Methods for genotyping single nucleotide polymorphisms. Annu Rev Genomics Hum Genet 2: 235-58.
- Sanger F, Nicklen S, Coulson AR (1992) DNA sequencing with chainterminating inhibitors.1977. Biotechnology 24: 104-8.
- Tsiatis AC, Norris-Kirby A, Rich RG, Hafez MJ, Gocke CD, et al. (2010) Comparison of Sanger sequencing, pyrosequencing, and melting curve analysis for the detection of KRAS mutations: diagnostic and clinical implications. J Mol Diagn 12: 425-32..
- Ranu RS (1994) Relief of DNA polymerase stop(s) due to severity of secondary structure of single-stranded DNA template during DNA sequencing. Anal Biochem 217: 158-61.
- Marusyk A, Polyak K (2010) Tumor heterogeneity: causes and consequences. Biochim Biophys Acta 1805: 105-17.
- Dragan AI, Pavlovic R, JB McGivney, J.R. Casas-Finet, E.S. Bishop, et al. (2012) SYBR Green I: fluorescence properties and interaction with DNA. J Fluoresc 22: 1189-99.
- Tindall EA, Petersen DC, Woodbridge P, Schipany K, Hayes VM (2009) Assessing high-resolution melt curve analysis for accurate detection of gene variants in complex DNA fragments. Hum Mutat 30: 876-83.
- Di Francia R, Frigeri F, Berretta M, Cecchin E, Orlando C, et al., (2010) Decision criteria for rational selection of homogeneous genotyping platforms for pharmacogenomics testing in clinical diagnostics. Clin Chem Lab Med 48: 447-59.
- van der Stoep N, van Paridon CD, Janssens T, Krenkova P, Stambergova A, et al. (2009) Diagnostic guidelines for high-resolution melting curve (HRM) analysis: an interlaboratory validation of BRCA1 mutation scanning using the 96-well LightScanner. Hum Mutat 30: 899-909.
- Krypuy M, Newnham GM, Thomas DM, Conron M, Dobrovic A (2006) High resolution melting analysis for the rapid and sensitive detection of mutations in clinical samples: KRAS codon 12 and 13 mutations in non-small cell lung cancer. BMC Cancer 6: 295.
- Wittwer CT (2009) High-resolution DNA melting analysis: advancements and limitations. Hum Mutat 30: 857-9.
- Mouritzen P, Nielsen AT, Pfundheller HM, Choleva Y, Kongsbak L, et al. (2003) Single nucleotide polymorphism genotyping using locked nucleic acid (LNA). Expert Rev Mol Diagn 3: 27-38.
- Dominguez PL, Kolodney MS (2005) Wild-type blocking polymerase chain reaction for detection of single nucleotide minority mutations from clinical specimens. Oncogene 24: 6830-4.
- de Leon J, Susce MT, Murray-Carmichael E (2006) The AmpliChip CYP450 genotyping test: Integrating a new clinical tool. Mol Diagn Ther 10: 135-51.
- Koch WH, Lin Wu (2006) Genotyping of Polymorphic CYP450 Genes Using the Amplichip CYP450 Test. Pharmacogenomics and Proteomics: Enabling the Practice of Personalized Medicine; Wong LSHY, Valdes MW, editors. AACC Press,Washington DC.
- Bortolin S, Black M, Modi H, Boszko I, Kobler D, et al. (2004) Analytical validation of the tag-it high-throughput microsphere-based universal array genotyping platform: application to the multiplex detection of a panel of thrombophilia-associated single-nucleotide polymorphisms. Clin Chem 50: 2028-36.
- Iqbal A, Arslan S, Okumus B, Wilson TJ, Giraud G, et al. (2008) Orientation dependence in fluorescent energy transfer between Cy3 and Cy5 terminally attached to double-stranded nucleic acids. Proc Natl Acad Sci U S A 105: 11176-81.
- Hall JG, Eis PS, Law SM, Reynaldo LP, Prudent JR, et al. (2000) Sensitive detection of DNA polymorphisms by the serial invasive signal amplification reaction. Proc Natl Acad Sci U S A 97: 8272-7.
- Imada Y, Fujimoto M, Hirata K, Hirota T, Suzuki Y, et al. (2009) Large scale genotyping study for asthma in the Japanese population. BMC Res Notes 2: 54.
- Ito N, Eto M, Nakamura E, Takahashi A, Tsukamoto T, et al. (2007) STAT3 polymorphism predicts interferon-alfa response in patients with metastatic renal cell carcinoma. J Clin Oncol 25: 2785-91.
- Holland PM, Abramson RD, Watson R, Gelfand DH (1991) Detection of specific polymerase chain reaction product by utilizing the 5’----3’ exonuclease activity of Thermus aquaticus DNA polymerase. Proc Natl Acad Sci U S A, 88: 7276-80.
- Kim Y, Sohn D, Tan W (2008) Molecular beacons in biomedical detection and clinical diagnosis. Int J Clin Exp Pathol 1: 105-16.
- Tyagi S, Bratu DP, Kramer FR (1998) Multicolor molecular beacons for allele discrimination. Nat Biotechnol 16: 49-53.
- Kolpashchikov DM (2012) An Elegant Biosensor Molecular Beacon Probe: Challenges and Recent Solutions. Scientifica 2012: 17.
- Ronaghi M, Karamohamed S, Pettersson B, Uhlen M, Nyren P (1996) Real-time DNA sequencing using detection of pyrophosphate release. Anal Biochem 242: 84-9.
- Elahi E, Ronaghi M (2004) Pyrosequencing: a tool for DNA sequencing analysis. Methods Mol Biol 255: 211-9.
- Tooke N (2006) The Application of PyrosequencingTM Technology in Pharmacogenomics. Pharmacogenomics and Proteomics: Enabling the Practice of Personalized Medicine; Wong LSHY, Valdes MW, Jr R, editors. AACC Press, Washington DC.
- Ronaghi M (2000) Improved performance of pyrosequencing using singlestranded DNA-binding protein. Anal Biochem 286: 282-8
- Pusch W, Wurmbach JH, Thiele H, Kostrzewa M (2002) MALDI-TOF mass spectrometry-based SNP genotyping. Pharmacogenomics 3: 537-48.
- Mann M, Talbo G (1996) Developments in matrix-assisted laser desorption/ionization peptide mass spectrometry. Curr Opin Biotechnol 7: 11-9.
- Stults JT (1995) Matrix-assisted laser desorption/ionization mass spectrometry (MALDI-MS). Curr Opin Struct Biol 5: 691-8.
- Bernard S, Neville KA, Nguyen AT, Flockhart DA (2006) Interethnic differences in genetic polymorphisms of CYP2D6 in the U.S. population: clinical implications. Oncologist 11: 126-35.
- Daly AK (2006) Significance of the minor cytochrome P450 3A isoforms. Clin Pharmacokinet 45: 13-31.
- Little S (2006) Translating single nucleotide polymorphism tests from clinical research to clinical practice. Personalized Medicine 3: 95-99
- US Food and Drug Administration (FDA) (2013) 510(k) Premarket Notification.