
Advances in Diabetes & Endocrinology
Download PDF
Stage 1: Guanidinium thiocyanate or guanidinium isothiocyanate (GITC) procedure
One millilitre of whole blood sample was transferred into a 15mL tube and labelled accordingly. Ten millitres of cold 1x Red blood cell lysis buffer (RCLB) was added to each sample and the tube properly closed and was mixed by inversion. The tube was then placed on ice for 10 minutes. The tubes were wiped carefully. The tubes were centrifuged at 4000 rpm for 7 minutes. The supernatant was carefully decanted into the waste bucket. Care was taken not to lose the cell pellet. Ten millitres of cold 1x RCLB was again added to the cell pellet, mixed by vortex.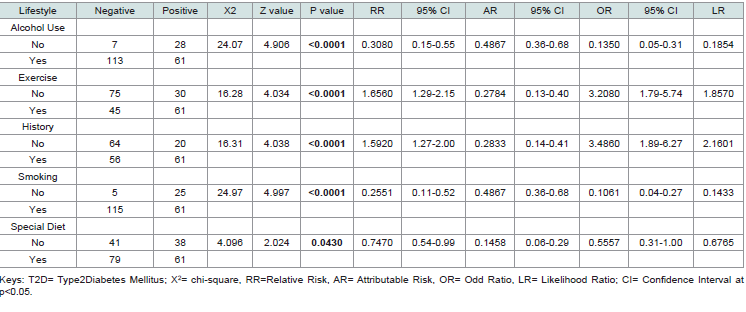 Table 1:Association of Environmental and lifestyle Risk Indices in Subjects with Expressed CDKN/2A gene with T2D
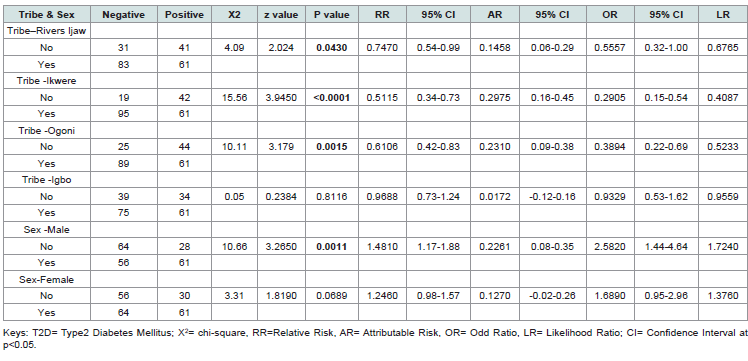 Table 2: Association of Tribe and Sex Risk Indices in Subjects with Expressed CDKN/2A gene with T2D
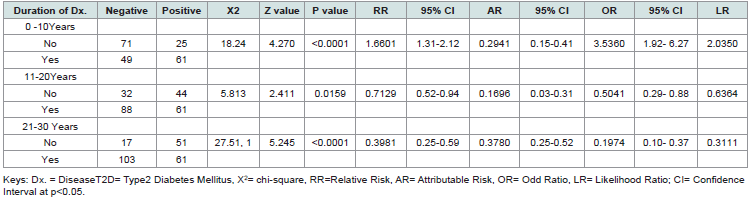 Table 3:Association of Duration of Disease Risk Indices in Subjects with Expressed CDKN/2A gene with T2D
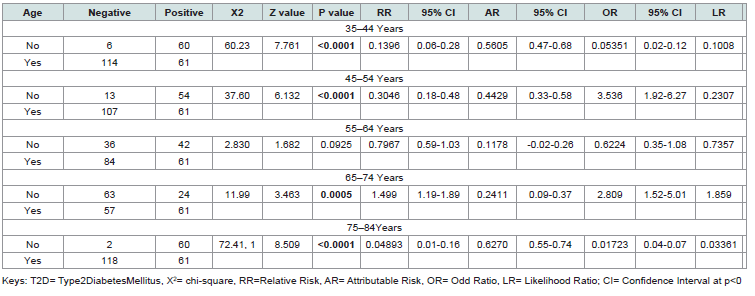 Table 4:Association of Age and Risk Indices in Subjects with T2D Expressing CDKN/2A gene
Research Article
Determination of Association and Risks Indices of Subjects with Type 2 Diabetes Expressing CDKN-2A Gene in Some Tribes in Southern Nigeria
Doris OC, Bartimaeus EAS, Ogechi NE and Holy B*
*Address for Correspondence:Brown Holy, Department of Clinical Chemistry, Faculty of
Medical Laboratory Science, Rivers State University, Nkpolu, Port Harcourt, Nigeria.E-mail Id: brown.holy01@ust.edu.ng
Submission: 26 November, 2025
Accepted: 22 December, 2025
Published: 24 December, 2025
Copyright: © 2025 Doris OC, et al. This is an open access
article distributed under the Creative Commons Attribution
License, which permits unrestricted use, distribution, and
reproduction in any medium, provided the original work is
properly cited.
Keywords:CDKN/2A gene; lifestyles modification; Diabetes Type 2
Abstract
The cyclin-dependent kinase inhibitor (CDKN/2A) gene locus has
been implicated in diabetes type 2 susceptibility through genomewide
association studies (GWAS). However, there is paucity of data on
this in Nigeria. The aim was to determine association and risks indices of
subjects with type 2 diabetes expressing CDKN/2A gene in some tribes
in Southern Nigeria. This is a cross-sectional study that involved 120
females and males’ subjects from Ijaw, Ogoni, Ikwerre and Igbo tribes,
between the ages of 34 – 84 attending diabetic clinics at two tertiary
hospitals. Well-structured questionnaires were randomly administered
to the 120 subjects. The result revealed significant associations (p
< 0.05) between all examined lifestyle factors and T2D in individuals
expressing the CDKN/2A gene. Sedentary individuals showed a strong
positive association with T2D (X² = 16.28, p < 0.0001), with elevated
relative risk (RR = 1.66) and odds ratio (OR = 3.21). Subjects without a
family history of T2D had a higher association (X² = 16.31, p < 0.0001),
with increased relative risk (RR = 1.59) and odds ratio (OR = 3.49).
Non-smokers exhibited a significant association with T2D (X² = 24.97,
p < 0.0001), with reduced relative risk (RR = 0.26) and odds ratio (OR =
0.11). The Ijaw tribe depicted a modest but significant association (X²
= 4.09, p = 0.043), with reduced relative risk (RR = 0.75) and odds ratio
(OR = 0.56). While Ikwere tribe had a strong negative association (X² =
15.56, p < 0.0001), with reduced relative risk (RR = 0.51) and odds ratio
(OR = 0.29). Also, Ogoni tribe had a significant negative association (X²
= 10.11, p = 0.0015), with reduced relative risk (RR = 0.61) and odds ratio
(OR = 0.39). And Igbo tribe had no significant association. Individuals
expressing CDKN/2A gene may have the propensity for risk indices for
type 2 diabetes in the study population.
Introduction
T2DM is a complicated metabolic disease of global significance
with increased prevalence rate without any form or spraying or
plateau (Rodríguez-Mañas et al. 2022) [1]. It is often characterised
by a combination of impairments in insulin secretion from the
beta cells in pancreas, to the resistance of insulin in the peripheral
tissues, especially in the liver and muscle that occurs as a result of
interaction between multiple environmental as well as genetic
factors. Several studies have shown evidence supporting gene as
well as lifestyle related to T2DM to have come from the prevalence
of DM across diverse environmental factors and ethnicities, as well
as familial based intervention studies which has shown that related
individuals’ response to interventions is more similar than that in
unrelated individuals (Paul et al., 2013) [2]. Both environmental and
genetic factors play an essential role in causing T2DM (Khan et al.
,2015; Shariff et al., 2018) [3,4]. In addition, Yan et al., (2017) [5]
posited that T2DM is a complicated, chronic, polygenic congenital
disorder involving intricate interactions between gene variants and
environmental factors–for instance, coffee, smoking, stress, obesity,
physical activity, inflammation, exercise, diet, as well as family
history. Several studies have shown evidence supporting gene as
well as lifestyle related to T2DM to have come from the prevalence
of DM across diverse environmental factors and ethnicities, as well
as familial based intervention studies which has shown that related
individuals’ response to interventions is more similar than that in
unrelated individuals (Paul et al., 2013; Schwab et al., 2021) [2,6].
In another study, Ajabnoor et al. (2018) [7] explained that genetic
linkage analyses and genome-wide association studies (GWAS)
have identified many more T2DM susceptibility loci, with about 187
T2DM-linked loci confirmed to date (Voight et al., 2010; Lau et al.,
2017) [8,9].
Despite significant progress in the area of genetics and GWAS in T2DM, the ability of genetic variants on the prognostics of T2DM Mellitus (T2DM) has not yielded substantiated progress. Therefore, there is need to evaluate the allelic variants of CDKN/2A presents in T2DM, as well as determine the relation between the expression of CDKN/2A and lifestyle modification in Southern Nigeria.
Despite significant progress in the area of genetics and GWAS in T2DM, the ability of genetic variants on the prognostics of T2DM Mellitus (T2DM) has not yielded substantiated progress. Therefore, there is need to evaluate the allelic variants of CDKN/2A presents in T2DM, as well as determine the relation between the expression of CDKN/2A and lifestyle modification in Southern Nigeria.
Materials and Method
Research Design:
This is a cross-sectional study involving the identification of
transcript variants of CDKN/2A gene in Type 2 Diabetics Mellitus
subjects from selected ethnic groups in Southern Nigeria. Wellstructured
questionnaires were used to obtain information on
smoking, alcohol, exercise, medical history and diet status.Sampling Method:
A total of 120 subjects of which 64 females and 56 males who
are from Ijaw, Ogoni, Ikwerre and Igbo tribes between the ages of
34 – 84 attending diabetic clinics at Rivers State University Teaching
Hospital (RSUTH) formally known as Braithwaite Memory Hospital,
Port Harcourt (BMSH) and University of Port Harcourt Teaching
Hospital (UPTH).Eligibility, Inclusion and Exclusive Criteria:
A well-structured questionnaire was issued to all the participants
to obtain demographic information, medical history, and lifestyle
after obtaining verbal consent of participants. Subject included in
this study were attending Diabetes Clinic at Braithwaite Memorial
Specialist Hospital (BMSH) and University of Port Harcourt Teaching
Hospital, with history of diabetes and glycated haemoglobin (HbA1c)
greater than 6.5% and from the selected tribes. Those who did not
give their consent were excluded from the study and those without a
clear history of diabetes and fasting blood sugar of less than 7.0mmo/l
and glycated haemoglobin (HbA1c) less than 6.5% and those not of
the selected tribes. Before the start of the study, ethical approval with
number RSHMB/RSHREC/2023/027 was obtained from the Ethical
Review Boards of the Rivers State Government, through the Rivers
State Ministry of Health covering the Rivers State University Teaching
Hospital and University Teaching Hospital UPTH/ADM/90/S.11/
VOL.XI/1069. The subjects were addressed and the purpose of the
study made known to them. Upon receipt of oral consent, they were
required to complete a set of questionnaires.Sample Collection:
Seven milliliters of blood was drawn from the subjects after
obtaining consent, three (3ml) for HbA1C and fasting blood glucose.
The remaining four ml of blood was collected using a EDTA K3
tubes and was transported in cold box to Safety Molecular Pathology
Laboratory Services located at 44 Rangers Avenue, Enugu for DNA
extraction and genotyping (Sequencing).Genetic analysis:
Genomic DNA extraction: Genomic DNA extractions of the
samples was performed using Geneaid DNA Mini Kit (Blood/
Cultured Cell).Principle:
RBC Lysis Buffer and chaotropic salt are used to lyse cells
and degrade protein, allowing DNA to bind to the glass fiber matrix
of the spin column. Contaminants are removed using a wash
buffer (containing ethanol) and the purified genomic DNA is eluted
by a low salt elution buffer, TE or water. The entire procedure can
be completed within 25 minutes without phenol/chloroform
extraction or alcohol precipitation. The purified DNA, with
approximately 20-30 kb, is suitable for use in PCR or other enzymatic
reactions.Stage 1: Guanidinium thiocyanate or guanidinium isothiocyanate (GITC) procedure
One millilitre of whole blood sample was transferred into a 15mL tube and labelled accordingly. Ten millitres of cold 1x Red blood cell lysis buffer (RCLB) was added to each sample and the tube properly closed and was mixed by inversion. The tube was then placed on ice for 10 minutes. The tubes were wiped carefully. The tubes were centrifuged at 4000 rpm for 7 minutes. The supernatant was carefully decanted into the waste bucket. Care was taken not to lose the cell pellet. Ten millitres of cold 1x RCLB was again added to the cell pellet, mixed by vortex.
Where there were still traces of red cells, 10ml of cold RCLB was
added to the cell pellet again, mixed by vortex. Ten millilitres of sterile
Phosphate buffered saline (PBS) was added to the cell pellet, mixed by
vortex and centrifuged at 4000 rpm for 7min. The supernatant was
decanted; 5ml of sterile PBS was added into each tube. Mixed
by vortex and centrifuged at 4000rpm for 5min. The supernatant was
decanted into the waste bucket carefully not to discard the pellet and
the fifteen millilitres’ tubes were drained on a clean towel. While
draining, the GITC buffer was prepared by adding 10uL betamercaptoethanol
(BME) to the 1ml of GITC. One millilitre
of activated GITC buffer containing BME was added to the
cell pellets in one tube. A blunt end 18G needle and 2ml syringe
was used to homogenise the GITC lysate 18 times. A sterile Pasteur
pipettes was used to transfer the GITC lysate into 2mL cryovial and
labelled accordingly for storage at minus -200C. (The lysate can also
be used immediately for nucleic acid extraction). For quality control
(QC) purpose, also 1.0mL of the GITC buffer containing BME was
transferred into a cryovial, label as QC control and treated as a sample
during nucleic acid extractions.
Stage 2: DNA Extraction [Geneaid Genomic DNA Mini Kit (Blood/Cultured Cell)]:
Protocol for Extraction: Two hundred microlitres of GITC lysate
was pipetted into a 1.5mL tube. Two hundred and fifty microliters of
Guanidium Chloride buffer (GB buffer), and vortexed for 15 seconds
and then incubated at 60oC for 30mins. It was mixed occasionally.
Two hundred and fifty microliters absolute ethanol was added
and Vortexed gently for 10 seconds. The mixture was incubated
at room temp for 5 minutes. The GD column was placed in 2mL
collection tube. The mixture was transferred into the GD column.
It was centrifuged at 14000 rpm for 5 minutes. The 2mL collection
tube was discarded and then replaced with a new one. Four hundred
microlitres of W1 buffer was added to the GD column and centrifuged
for 1 minute. The collection tube was discarded and the GD column
was placed in a new collection tube. Six hundred microlitres of wash
buffer was added to the GD column and centrifuged for 1 minute.
The GD column was place into another collection tube, centrifuged at
14000rpm for 3 minutes to ensure the column is dry. The GD column
was transferred to 1.5ml tube. Sixty microlitres of preheated elution
buffer was added to the center of the GD column and allowed to
stand for 10 minutes at room temperature. Then centrifuged at
14000 rpm for 30 seconds to elute the purified DNA.Genotyping of SNPs: Genotyping of SNPs of the CDKN/2A gene
was performed with the Illumina next-generation sequencing (NGS)
using NextSeq 2000 Sequencing System. Purity and concentration of
isolated DNA was determined by UV/VIS spectrophotometer
Nano Drop ND-1000. The primers for the sequence, as designed
from Illumina Design Studio (Ampliseq for Illumina Gene DNA for
CDKN/2A Gene with a 100% coverage):
The primers for the sequence, as designed from Illumina Design
Studio (Ampliseq for Illumina Gene DNA for CDKN/2A Gene
with a 100% coverage):
Manifest IAA23693_182 Manifest Format Version 1.0 Manifest File Version 20201117 BuildIDgrch38.p2 Source ConvertTsa Manifest Lite 1.22.0.388
Manifest IAA23693_182 Manifest Format Version 1.0 Manifest File Version 20201117 BuildIDgrch38.p2 Source ConvertTsa Manifest Lite 1.22.0.388
Statistical Analysis:
The statistical analysis of the experimental data was conducted
using GraphPad Prism software (Version 8.0.2). All raw data generated
from the study were entered into the software for comprehensive
analysis and interpretation. Different statistical tools were applied
to assess variations and relationships among parameters. These
included: Chi-square test, odd ratio, relative risk, attributable risk,
and likelihood ratio.Results
The risks indices for T2D subjects with expressed CDKN/2A
gene were calculated using chi-square, relative risk, attributable risks,
odd ratio, and likelihood ratio. The relative risk, attributable risks,
odd ratio, and likelihood ratios were determined using Koopman
asymptotic score, Baptista-Pike, Wilson-Brown and Newcombe/
Wilson with CC methods respectively at p<0.05.
[Table 1] presents the association between various lifestyle factors and the presence of T2D in individuals expressing the CKDA gene. Statistical measures include chi-square (X²), z-value, p-value, relative risk (RR), attributable risk (AR), odds ratio (OR), likelihood ratio (LR), and their corresponding 95% confidence intervals (CI).
The analysis revealed significant associations (p < 0.05) between all examined lifestyle factors and T2D in individuals expressing the CKDA gene. Alcohol Use: Non-drinkers had a significantly higher association with T2D (X² = 24.07, p < 0.0001), with reduced relative risk (RR = 0.31) and odds ratio (OR = 0.14). Exercise: Sedentary individuals showed a strong positive association with T2D (X² = 16.28, p < 0.0001), with elevated relative risk (RR = 1.66) and odds ratio (OR = 3.21). Family History: Subjects without a family history of T2D had a higher association (X² = 16.31, p < 0.0001), with increased relative risk (RR = 1.59) and odds ratio (OR = 3.49). Smoking: Non-smokers exhibited a significant association with T2D (X² = 24.97, p < 0.0001), with reduced relative risk (RR = 0.26) and odds ratio (OR = 0.11).
Special Diet: Individuals not following a special diet had a modest but
significant association (X² = 4.10, p = 0.043), with reduced relative
risk (RR = 0.75) and odds ratio (OR = 0.56). The confidence intervals
for all measures remained consistent with the observed associations,
showing statistical reliability.
[Table 2] examines the association between tribal affiliation, sex, and the presence of T2D in individuals expressing the CDKN/2A gene. Statistical measures include chi-square (X²), z-value, p-value, relative risk (RR), attributable risk (AR), odds ratio (OR), likelihood ratio (LR), and their corresponding 95% confidence intervals (CI).
The analysis revealed significant associations between certain tribal groups, sex, and T2D in individuals expressing the CDKN/2A gene, while others showed no significant link. Tribe – Rivers Ijaw: A modest but significant association was observed (X² = 4.09, p = 0.043), with reduced relative risk (RR = 0.75) and odds ratio (OR = 0.56). Tribe – Ikwere: A strong negative association was found (X² = 15.56, p < 0.0001), with reduced relative risk (RR = 0.51) and odds ratio (OR = 0.29). Tribe – Ogoni: A significant negative association was present (X² = 10.11, p = 0.0015), with reduced relative risk (RR = 0.61) and odds ratio (OR = 0.39). Tribe – Igbo: No significant association was detected (X² = 0.05, p = 0.8116), with near-neutral relative risk (RR = 0.97) and odds ratio (OR = 0.93). Sex – Male: A strong positive association was observed (X² = 10.66, p = 0.0011), with elevated relative risk (RR = 1.48) and odds ratio (OR = 2.58). Sex – Female: No significant association was found (X² = 3.31, p = 0.0689), though a trend toward increased risk was noted (RR = 1.25, OR = 1.69). The confidence intervals for significant associations support the reliability of these findings, while non-significant results suggest no strong link in those categories.
[Table 3] presents the association between the duration of T2D and its presence in individuals expressing the CKDA gene. Statistical measures include chi-square (X²), z-value, p-value, relative risk (RR), attributable risk (AR), odds ratio (OR), likelihood ratio (LR), and their corresponding 95% confidence intervals (CI).
The analysis revealed significant associations between different
durations of T2D and the presence of the disease in individuals
expressing the CDKN/2A gene. 0–10 Years Duration: A strong
positive association was observed (X² = 18.24, p < 0.0001), with
elevated relative risk (RR = 1.66) and odds ratio (OR = 3.54). 11–20
Years Duration: A modest but significant negative association was
found (X² = 5.813, p = 0.0159), with reduced relative risk (RR =
0.71) and odds ratio (OR = 0.50). 21–30 Years Duration: A highly
significant negative association was detected (X² = 27.51, p < 0.0001),
with substantially reduced relative risk (RR = 0.40) and odds ratio
(OR = 0.20). The confidence intervals for all significant associations
support the reliability of these findings, indicating that shorter disease
duration (0–10 years) is strongly linked to T2D presence, while longer
durations (11–30 years) show progressively weaker associations.
[Table 4] examines the association between different age groups
and the presence of T2D in individuals expressing the CDKN/2A
gene. Statistical measures include chi-square (X²), z-value, p-value,
relative risk (RR), attributable risk (AR), odds ratio (OR), likelihood
ratio (LR), and their corresponding 95% confidence intervals (CI).
The analysis revealed strong age-dependent associations between CDKN/2A gene expression and T2D, with particularly notable patterns in younger and older age groups: 35–44 Years: An extremely strong negative association was observed (X² = 60.23, p < 0.0001), with very low relative risk (RR = 0.14) and odds ratio (OR = 0.05). 45-54 Years: A significant negative association was found (X² = 37.60, p < 0.0001), with reduced relative risk (RR = 0.30) and odds ratio (OR = 0.23). 55–64 Years: No significant association was detected (X² = 2.830, p = 0.0925), with near-neutral relative risk (RR = 0.80) and odds ratio (OR = 0.62). 65–74 Years: A strong positive association emerged (X² = 11.99, p = 0.0005), with elevated relative risk (RR = 1.50) and odds ratio (OR = 2.81). 75-84 Years: An exceptionally strong negative association was present (X² = 72.41, p < 0.0001), with extremely low relative risk (RR = 0.05) and odds ratio (OR = 0.02). The confidence intervals for significant associations support robust findings, indicating that middle-aged groups (35–54 years) show protective effects, while older adults (65–74 years) demonstrate increased risk. The oldest group (75–84 years) paradoxically shows the strongest negative association.
The analysis revealed strong age-dependent associations between CDKN/2A gene expression and T2D, with particularly notable patterns in younger and older age groups: 35–44 Years: An extremely strong negative association was observed (X² = 60.23, p < 0.0001), with very low relative risk (RR = 0.14) and odds ratio (OR = 0.05). 45-54 Years: A significant negative association was found (X² = 37.60, p < 0.0001), with reduced relative risk (RR = 0.30) and odds ratio (OR = 0.23). 55–64 Years: No significant association was detected (X² = 2.830, p = 0.0925), with near-neutral relative risk (RR = 0.80) and odds ratio (OR = 0.62). 65–74 Years: A strong positive association emerged (X² = 11.99, p = 0.0005), with elevated relative risk (RR = 1.50) and odds ratio (OR = 2.81). 75-84 Years: An exceptionally strong negative association was present (X² = 72.41, p < 0.0001), with extremely low relative risk (RR = 0.05) and odds ratio (OR = 0.02). The confidence intervals for significant associations support robust findings, indicating that middle-aged groups (35–54 years) show protective effects, while older adults (65–74 years) demonstrate increased risk. The oldest group (75–84 years) paradoxically shows the strongest negative association.
Discussion
This study has assessed the relationships of special diet, lifestyle
modifications, family health history, duration of diabetes and age, on
of diabetes type 2 subjects expressing CDKN/2A among major tribes
in the Southern Nigeria.
The impact of lifestyle factors on the development and
progression of chronic diseases, particularly Type 2 Diabetes (T2D),
is well-established. Lifestyle choices such as alcohol consumption,
physical activity, and smoking are known to modulate disease risk.
This study’s findings emphasize the profound influence these factors
have on the expression of the CDKN/2A gene, which plays a role in
the pathophysiology of T2D.
The significant association between alcohol use and the
expression of the CDKN/2A gene (p < 0.0001) highlights the critical
role that alcohol plays in modulating genetic expression in T2D
patients. The relative risk (RR = 0.3080) suggests that individuals
who abstain from alcohol are less likely to express the CDKN/2A
gene compared to those who consume alcohol. The attributable risk
(AR = 0.4867) further supports this finding, indicating that nearly
half of the CDKN/2A expression cases among alcohol users could
potentially be avoided if alcohol consumption were eliminated.
Alcohol is known to influence glucose metabolism and insulin
sensitivity. Chronic alcohol consumption can impair pancreatic betacell
function, leading to decreased insulin secretion and an increased
risk of hyperglycemia (Howard et al., 2004, Yang et al., 2020) [10,11].
This metabolic dysregulation could create an environment that favors
the expression of genes like CDKN/2A, which are implicated in the
development of T2D. Moreover, alcohol has been shown to induce
oxidative stress and inflammation, both of which are key contributors
to T2D pathogenesis (Caturano et al., 2023) [13]. The findings of this
study align with previous research that links alcohol consumption
to adverse outcomes in diabetic patients, emphasizing the need
for targeted interventions to reduce alcohol use in this population.
Interestingly, the odds ratio (OR = 0.1350) suggests a significantly
lower likelihood of CDKN/2A gene expression among non-alcohol
users. This finding points to the protective effect of abstaining from
alcohol in individuals at risk of or already diagnosed with T2D. Given
the widespread consumption of alcohol in many populations, public
health campaigns aimed at reducing alcohol intake, particularly
among those with a genetic predisposition to T2D, could have a
substantial impact on disease prevention and management.
Lack of physical activity was found to be strongly associated with
CDKN/2A gene expression in T2D patients. The relative risk (RR
= 1.6560) indicates that individuals who do not engage in regular
exercise are more than 1.5 times as likely to express the CDKN/2A
gene compared to those who do. This is corroborated by the odds
ratio (OR = 3.2080), which further highlights the heightened risk of
CDKN/2A expression in physically inactive individuals. The strong
association (p < 0.0001) suggests that exercise plays a crucial role
in regulating genetic expression related to T2D. Physical activity is
well-documented to improve insulin sensitivity and glucose uptake
by muscle cells, which helps maintain stable blood glucose levels.
Regular exercise has also been shown to reduce inflammation and
oxidative stress, factors that are known to influence gene expression
(Venkatasamy et al., 2013, Galicia-Garcia et al., 2020). [14,15] The
findings of this study support the existing body of literature that
advocates for regular physical activity as a preventive measure against
the development of T2D, particularly in genetically predisposed
individuals. Additionally, the attributable risk (AR = 0.2784)
indicates that nearly 28% of the cases of CDKN/2A gene expression
in inactive individuals could be prevented through increased physical
activity. This underscores the importance of lifestyle interventions
that promote regular exercise. Given that many individuals with T2D
may experience barriers to physical activity due to comorbidities
or complications of diabetes (e.g., neuropathy), tailored exercise
programs that accommodate these limitations could be particularly
beneficial. The promotion of physical activity should be a cornerstone
of public health strategies aimed at reducing the burden of T2D and
its genetic components.
Smoking emerged as another significant lifestyle factor associated
with CDKN/2A gene expression. Non-smokers had a notably lower
relative risk (RR = 0.2551) and odds ratio (OR = 0.1061) for CKDA-
2 gene expression compared to smokers. This suggests that smoking
substantially increases the likelihood of CDKN/2A expression, with
nearly half of the attributable risk (AR = 0.4867) in smokers being
linked to this lifestyle choice. Smoking is a well-known risk factor
for numerous chronic conditions, including cardiovascular disease,
cancer, and diabetes. In the context of T2D, smoking exacerbates
insulin resistance and promotes chronic inflammation, both of
which can influence the expression of diabetes-related genes
such as CDKN/2A (AfGeijerstam et al., 2023) [16]. Nicotine, the
addictive component of cigarettes, has been shown to impair glucose
metabolism and increase oxidative stress, creating an environment
conducive to the development of T2D. The results of this study align
with these findings, indicating that smoking not only contributes to
the onset of T2D but also increases the genetic risk for the disease
through the expression of CDKN/2A. The odds ratio (OR = 0.1061)
and likelihood ratio (LR = 0.1433) reinforce the notion that nonsmokers
are at a much lower risk of expressing the CDKN/2A gene.
These findings provide strong evidence for the detrimental effects of
smoking on both metabolic health and genetic predisposition in T2D
patients. Smoking cessation programs should be prioritized as part of
a comprehensive strategy to manage and prevent T2D, particularly
among individuals with a known genetic risk for the disease.
Demographic characteristics such as tribe, sex, and age are crucial
in understanding the risk factors and genetic predisposition for the
expression of the CDKN/2A gene in individuals with Type 2 Diabetes
(T2D). This study highlights how these factors correlate with the
expression of the CDKN/2A gene, shedding light on the interplay
between genetics and demographic influences in T2D patients.
The study found significant associations between CDKN/2A gene expression and specific tribal affiliations, particularly among the Ikwere and Ogoni tribes, where relative risks (RR) of 0.5115 and 0.6106, respectively, were observed. These findings suggest that individuals from these tribes have a notably lower risk of CDKN/2A gene expression compared to those from other tribes. In contrast, members of the Ijaw tribe showed a less pronounced risk reduction (RR = 0.7470). The potential reasons behind these tribal differences could be multifactorial, involving both genetic and environmental components. Ethnic groups often have distinct genetic backgrounds, which may influence the prevalence of particular gene variants related to T2D. Moreover, lifestyle factors such as diet, physical activity, and cultural practices that differ between tribes may also play a role in modulating the expression of diabetes-related genes like CDKN/2A (Iqbal, 2023, Dietrich et al.,2019) [16,17]. For instance, variations in traditional diets or differences in healthcare access could contribute to these tribal disparities. While the study does not provide direct evidence for the mechanisms underlying these tribal differences, the results align with previous research showing that ethnicity and genetic background are significant determinants of T2D risk. The findings highlight the need for tailored public health interventions that take tribal or ethnic differences into account. Specifically, tribes with a higher relative risk of CDKN/2A expression could benefit from targeted genetic screening programs and lifestyle interventions that address the unique challenges faced by these populations.
The study found significant associations between CDKN/2A gene expression and specific tribal affiliations, particularly among the Ikwere and Ogoni tribes, where relative risks (RR) of 0.5115 and 0.6106, respectively, were observed. These findings suggest that individuals from these tribes have a notably lower risk of CDKN/2A gene expression compared to those from other tribes. In contrast, members of the Ijaw tribe showed a less pronounced risk reduction (RR = 0.7470). The potential reasons behind these tribal differences could be multifactorial, involving both genetic and environmental components. Ethnic groups often have distinct genetic backgrounds, which may influence the prevalence of particular gene variants related to T2D. Moreover, lifestyle factors such as diet, physical activity, and cultural practices that differ between tribes may also play a role in modulating the expression of diabetes-related genes like CDKN/2A (Iqbal, 2023, Dietrich et al.,2019) [16,17]. For instance, variations in traditional diets or differences in healthcare access could contribute to these tribal disparities. While the study does not provide direct evidence for the mechanisms underlying these tribal differences, the results align with previous research showing that ethnicity and genetic background are significant determinants of T2D risk. The findings highlight the need for tailored public health interventions that take tribal or ethnic differences into account. Specifically, tribes with a higher relative risk of CDKN/2A expression could benefit from targeted genetic screening programs and lifestyle interventions that address the unique challenges faced by these populations.
A significant association between sex and CDKN/2A gene
expression was observed, with males showing a notably higher
relative risk (RR = 1.4810, p = 0.0011) compared to females (RR =
1.2460, p = 0.0689). This suggests that male T2D patients are more
likely to express the CDKN/2A gene than females, placing them
at a greater genetic risk for the disease. The biological differences
between men and women, particularly regarding hormone regulation
and fat distribution, may explain the higher risk observed in men.
For instance, men are more likely to accumulate visceral fat, which
is strongly associated with insulin resistance, a key factor in T2D
development (Ciarambino et al., 2023) [18]. Moreover, sex hormones
like testosterone in men and estrogen in women may differentially
influence glucose metabolism and the inflammatory processes that
contribute to the expression of genes like CDKN/2A. Testosterone,
for example, has been linked to a higher risk of T2D in men due to its
role in promoting abdominal fat accumulation and insulin resistance
(Cheung et al., 2015) [19]. The higher odds ratio (OR = 2.5820) and
likelihood ratio (LR = 1.7240) in men further underscore the greater
genetic susceptibility of males to CDKN/2A gene expression. This
finding suggests that male T2D patients may require more intensive
monitoring and intervention to mitigate the impact of their genetic
predisposition. Public health strategies should consider these sexbased
differences when designing prevention and treatment programs
for T2D, ensuring that men are adequately targeted for interventions
that address both genetic and lifestyle risk factors.
Age was another critical demographic factor associated
with CDKN/2A gene expression. The study revealed significant
associations across various age groups, with the most striking
findings observed in the younger and older ends of the age spectrum.
Individuals in this age group had the lowest relative risk of CDKN/2A
gene expression (RR = 0.1396, p < 0.0001), suggesting that younger
adults are less likely to express this gene. This may reflect the typically
lower overall incidence of T2D in younger populations, as age is a
well-known risk factor for the disease. Younger individuals may
have fewer comorbidities and healthier lifestyle habits, such as better
physical activity levels, which could protect against both T2D and its
associated genetic risk factors (Lascar et al., 2017, Kovács et al., 2024)
[20,21]. In contrast, individuals in the 75–84-year age group showed
the highest relative risk of CDKN/2A expression (RR = 0.04893, p
< 0.0001), indicating that older adults are at significantly increased
risk. This finding aligns with the broader understanding that age is
a major risk factor for T2D, as the body’s ability to regulate glucose
metabolism declines with age. Aging is associated with reduced betacell
function, increased insulin resistance, and chronic inflammation,
all of which contribute to the onset and progression of T2D (Zhu et
al., 2021) [22]. The results for these middle-aged groups indicate a
moderate risk of CDKN/2A gene expression, with relative risks of
0.3046 and 0.7967, respectively. As individuals transition into middle
age, they tend to accumulate more risk factors for T2D, including
weight gain, decreased physical activity, and the onset of other health
conditions such as hypertension and cardiovascular disease. These
factors likely contribute to the increased risk of CDKN/2A gene
expression in these age groups.
The findings related to age suggest that the expression of
CDKN/2A is not static but evolves across the lifespan, with younger
adults being more protected and older adults being more susceptible.
These results point to the need for age-specific interventions in the
prevention and management of T2D. For younger populations, efforts
should focus on maintaining healthy lifestyle habits that can delay or
prevent the onset of CDKN/2A gene expression and, by extension,
T2D. In older adults, more aggressive interventions may be necessary
to manage both the genetic and lifestyle factors that contribute to
T2D, particularly given the heightened risk in this age group
As seen in the result Younger Age Groups (e.g., 35–44 years, p <
0.0001) were significantly different implying that younger individuals
expressing the CDKN/2A gene show a higher risk of T2D, indicating
that the disease may manifest earlier in life in these individuals. Some
of the reasons may be the early onset of T2D in younger individuals
which could be due to stronger genetic expression of the CDKN/2A
gene, leading to earlier disruption in glucose metabolism or it could
be that younger individuals may have a higher metabolic rate, which
can exacerbate the effects of insulin resistance, leading to earlier T2D
onset and it could also be a lifestyle factor whereby younger adults
might engage in riskier lifestyle behaviors (e.g., poor diet, lack of
exercise) that, combined with genetic predisposition, accelerate
the onset of T2D. Research by Dabelea et al. (2021) [23] shows an
increasing incidence of T2D among younger adults, particularly
those with a strong genetic predisposition while some studies argue
that environmental factors play a more significant role in younger
populations, with genetics being a secondary factor (Vandeweijer
et al., 2022) [24]. In the older age groups (e.g., 75-84 years, RR =
0.04893, p < 0.0001), Older individuals have a significantly lower
risk of developing T2D, suggesting that age-related factors may
provide some protective effects, or that the most at-risk individuals
have already developed the disease earlier in life. Older adults who
have not developed T2D may represent a population with protective
genetic traits or lifestyles that have prevented the disease, indicating
a form of survivor bias, aging is associated with changes in hormone
levels, such as decreased growth hormone and sex hormones, which
might reduce the risk of T2D by slowing metabolic processes and
with aging, the body’s ability to process glucose changes, and those
who maintain normoglycemia into older age may have inherently
better glucose regulation mechanisms. Studies have shown that while
the incidence of T2D is higher in middle-aged groups, the prevalence
can decrease in older age groups due to survivor effects (Akushevich
et al., 2018) [25-28]. Disagreeing studies (Bradly and Hsueh, 2018)
suggest that T2D risk continues to increase with age due to cumulative
exposure to risk factors, challenging the notion of a protective effect
in older age. These findings indicate that age plays a crucial role in the
manifestation and risk of T2D among individuals with the CDKN/2A
gene, with younger individuals at higher risk due to potential early
onset and genetic factors, while older individuals may exhibit reduced
risk due to survivor bias and age-related physiological changes.
Conclusion
Compelling evidence has shown that there are several notable
relationships and differences among various factors in Type 2 diabetic
subjects, particularly concerning CDKN2A gene predisposition,
dietary habits, lifestyle choices, and demographic factors. Complex
interactions influenced by dietary, lifestyle, and genetic factors are
shown by the analysis of relationships among biomarkers in CDKN2A
gene predisposed Type 2 diabetic patients. It is imperative to adopt
individualized dietary plans and lifestyle interventions tailored to the
specific needs and genetic predispositions of Type 2 diabetic patients
should be considered by healthcare professionals especially, those
with CDKN2A gene predisposition.