
Advances in Diabetes & Endocrinology
Download PDF
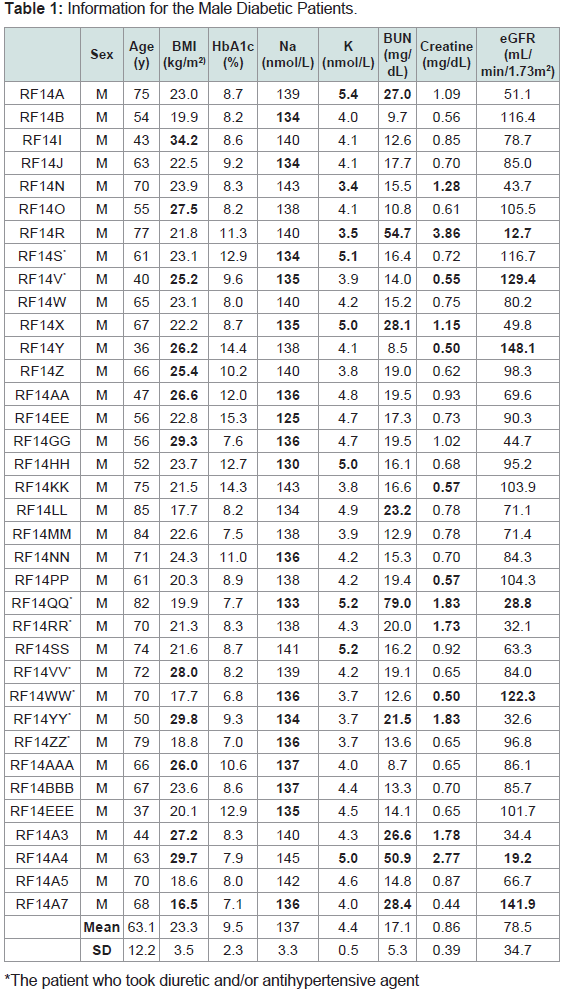 Table 1: Information for the Male Diabetic Patients.
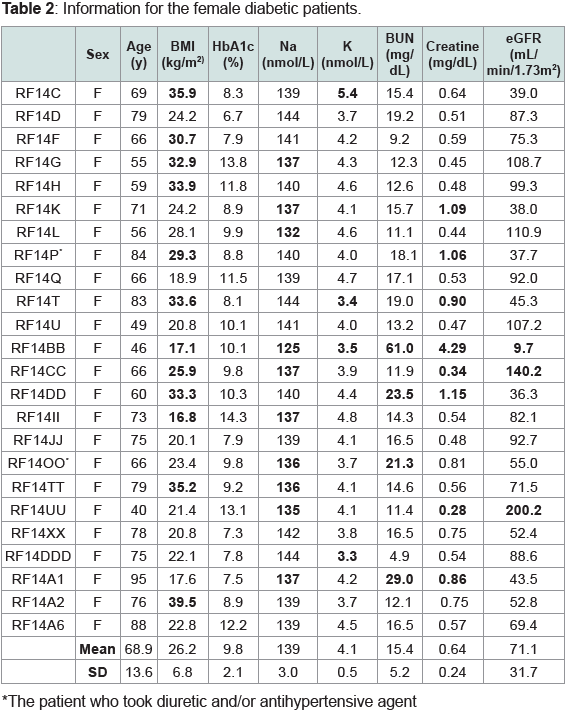 Table 2: Information for the female diabetic patients.
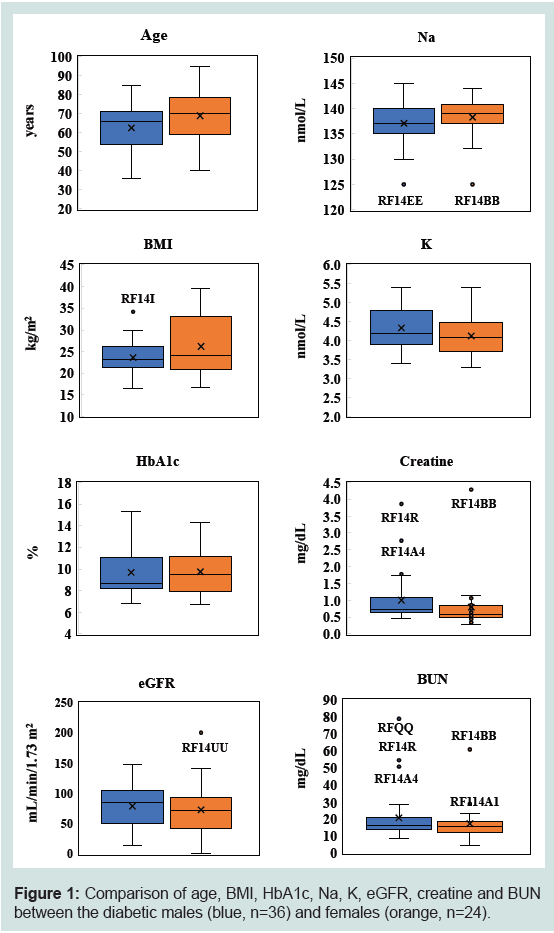 Figure 1: Comparison of age, BMI, HbA1c, Na, K, eGFR, creatine and BUN
between the diabetic males (blue, n=36) and females (orange, n=24).
Figure 1: Comparison of age, BMI, HbA1c, Na, K, eGFR, creatine and BUN
between the diabetic males (blue, n=36) and females (orange, n=24).
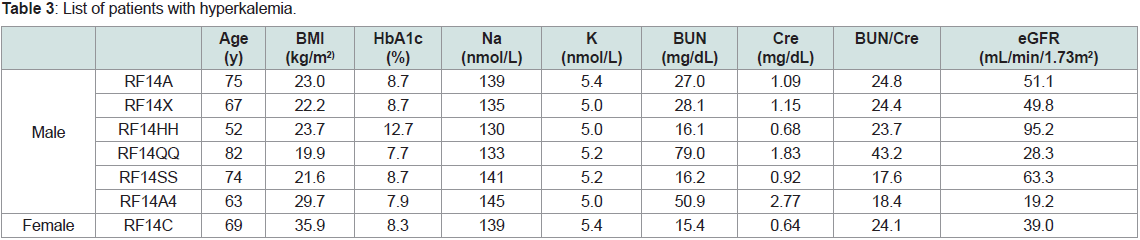 Table 3: List of patients with hyperkalemia.
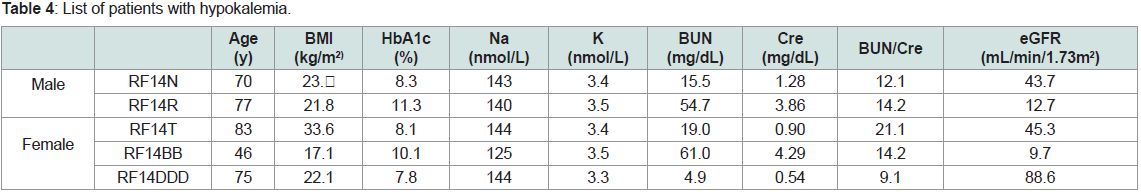 Table 4: List of patients with hypokalemia.
 Table 5: List of patients with hyperfiltration.
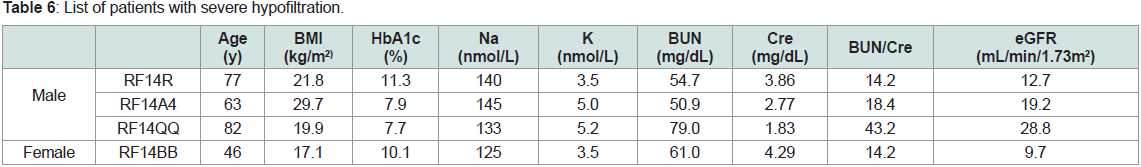 Table 6: List of patients with severe hypofiltration.
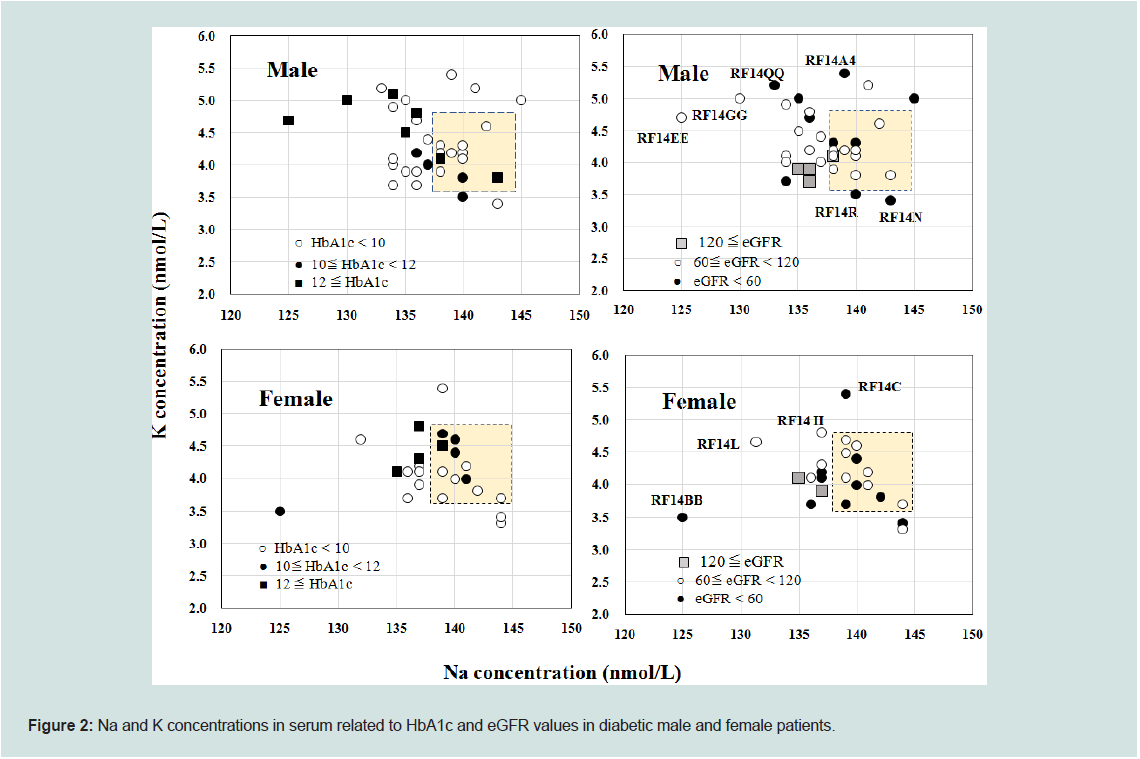 Figure 2: Na and K concentrations in serum related to HbA1c and eGFR values in diabetic male and female patients.
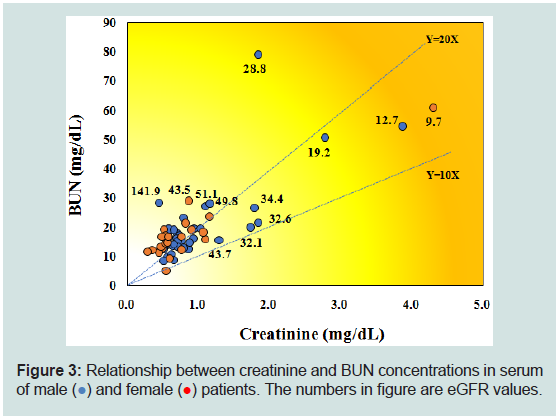 Figure 3: Relationship between creatinine and BUN concentrations in serum
of male (●) and female (●) patients. The numbers in figure are eGFR values.
Figure 3: Relationship between creatinine and BUN concentrations in serum
of male (●) and female (●) patients. The numbers in figure are eGFR values.
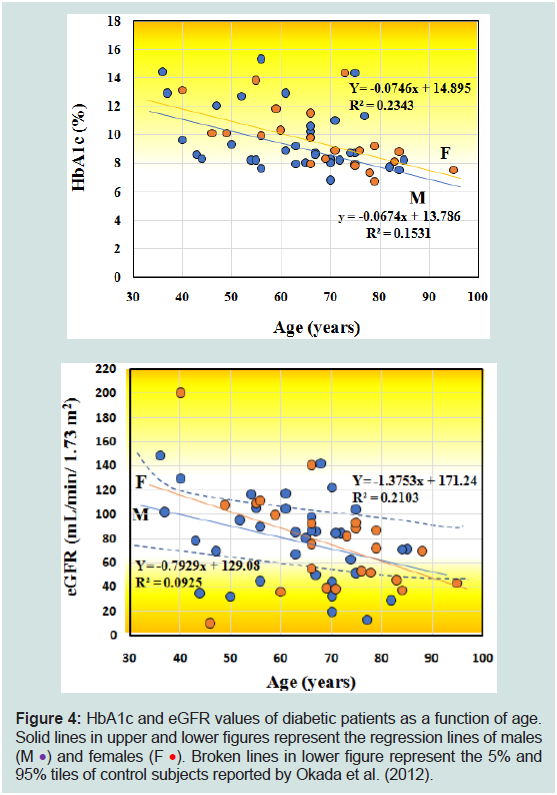 Figure 4: HbA1c and eGFR values of diabetic patients as a function of age.
Solid lines in upper and lower figures represent the regression lines of males
(M •) and females (F •). Broken lines in lower figure represent the 5% and
95% tiles of control subjects reported by Okada et al. (2012).
Figure 4: HbA1c and eGFR values of diabetic patients as a function of age.
Solid lines in upper and lower figures represent the regression lines of males
(M •) and females (F •). Broken lines in lower figure represent the 5% and
95% tiles of control subjects reported by Okada et al. (2012).
Research Article
Hyperfiltration in Diabetic Patients Associated With Mild Hyponatremia
Kimura O1, Fujino R2, Satoh E2, Hotta Y3, Hayasaka M1 and Endo T1*
1School of Pharmaceutical Science, Health Sciences University of
Hokkaido, 1757 Kanazawa, Ishikari-Tobetsu, Hokkaido 061-0293,
Japan
2Nikko Memorial Hospital, 1-5-13 Shintomi-cho, Muroran,
Hokkaido 051-8501, Japan
3Hokusei Hospital, W3-2-10-1, Sinkawa, Kita-Ku, Sapporo,
Hokkaido 001-0933, Japan
*Address for Correspondence:
Endo T, School of Pharmaceutical Science, Health Sciences University of
Hokkaido, 1757 Kanazawa, Ishikari-Tobetsu, Hokkaido 061-0293, Japan;
Phone & Fax: +81 090-7655-5403; E-mail: endotty531115@gmail.com
Submission: 29 March, 2022
Accepted:25 April, 2022
Published: 30 April, 2022
Copyright: © 2022 Kimura O, et al. This is an open access article
distributed under the Creative Commons Attribution License, which
permits unrestricted use, distribution, and reproduction in any medium,
provided the original work is properly cited.
Abstract
Glomerular hyperfiltration found in diabetic patients is recognized
as an early renal alteration and reversible stage of kidney damage, but
details have not yet been studied. We investigated the relation among
estimated glomerular filtration rate (eGFR) and many factors such as
age, HbA1cvalue, blood urea nitrogen (BUN) concentration, Na and K
concentrations in serum of Japanese diabetic patients to investigate
the characteristics of hyperfiltration [1]. Hyperfiltration (eGFR ≥ 120 ml/
mini/1.73 m2) was found in six among 60 diabetic patients investigated,
and Na concentrations in five patients with hyperfiltration were slightly
lower than the reference range of Na concentration (138-145 nmol/L),
whereas their K concentrations were within the reference range (3.6-
4.9 nmol/L), but significantly lower than those of diabetic patients with
normal- and hypofiltration. In contrast, the Na and K concentrations
in more than half of patients with normal-and hypofiltration have
low Na concentration and high K concentration as compared with
these reference ranges. Thus, mild hyponatremia with a relatively
lower concentration of K seems to be the characteristic symptoms
of hyperfiltration among diabetic patients [2]. BUN concentrations in
five patients with hyperfiltration were normal level (below 20 mg/dL),
whereas those in the patients with severe hypofiltration (eGFR < 30 ml/
mini/1.73 m2, n=4) were higher than 50 mg/dL. Thus, renal dysfunction
estimated by BUN concentration could not be seen in most patients
with hyperfiltration, whereas the patients with severe hypofiltration are
thought to have chronic kidney disease [3]. No correlation was found
between eGFR and HbA1c values of the patients with hyperfiltration.
These results are consistent with previous findings that renal dysfunction
of diabetic patients with hyperfiltration is mild, an early stage and
recoverable.
Keywords
Diabetes; Hyperfiltration; eGFR; Hyponatremia; Hypokalemia;
HbA1c; BUN
Introduction
Diabetes mellitus (DM), commonly known as diabetes, is a group
of metabolic disorders characterized by a high blood sugar level over
a prolonged period of time. There are two main types of diabetes: type
1 (T1 DM) and type 2 (T2 DM). T1 DM results from the pancreas’s
failure to produce enough insulin due to the loss of beta cells in the
pancreas. T2 DM begins with insulin resistance, a condition in which
the cells fail to respond to insulin properly, and a lack of insulin may
also develop as the disease progresses.
Glomerular filtration rate (GFR) in healthy subjects generally
declines with an increase of age. The 5th and 95th percentiles of
estimated GFR (eGFR), calculated from control subjects of Japanese
without pre-diabetes and pre-hypertension, decrease 0.5-0.6 mL/
min/1.73 m2 per year, during 20 and 89 years [4-7]. In contrast, the
decrease of eGFR is faster in diabetic patients (1.34 mL/min/1.73
m2 per year) than healthy subjects, and resulted in subsequent
kidney damage which is characteristic of hypofiltration in chronic
kidney disease (CKD) and end-stage renal disease [1,7,12].
Glomerular hyperfiltration is well-recognized as an early renal
alteration and reversible stage of kidney damage, which precedes the
onset of albuminuria, following the decline of GFR and CKD [19].
Hyperfiltration is frequently found in T1 DM and T2 DM [1,8,15,19], and prevalence of hyperfiltration occurred in T1 DM and T2 DM
were 27 % and 16 %, respectively [19]. There is no widely accepted
threshold of hyperfiltration: so far we know, the lowest threshold is
above 120 ml/min/1.73 m2, and the highest threshold is above 140
ml/min/1.73 m2 [19]. Mechanisms underlying the hyperfiltration in
DM have not yet been well understood [8,16,19], but one plausible
mechanism is increased proximal tubular reabsorption of glucose and
Na [1,15,16].
As glucose is an osmotically active substance, hyperglycemia
increases serum osmolarity, resulting in movement of water out of
the cells and subsequently in a decrease of serum Na concentration
by dilution, where glucosuria-induced osmolarity increases serum
K concentration by the redistribution of K from the intracellular
to the extracellular compartment [9,18]. The alteration of Na and
K concentrations in the serum of diabetic patients is closely linked
to one another, namely hyponatremia with hyperkalemia, and
hypernatremia with hypokalemia, and those changes are found
in the patients before tight control of glycemic levels [18]. On the
other hand, so far we know, the changes of Na and K concentrations
owing to hyperfiltration, which occurred in an early stage of renal
disfunction, have not yet been reported.
Hyperkalemia is associated with not only hyperglycemia but
also reduced glomerular filtration of K due to acute kidney injury
and CKD [9]. Furthermore, taking drugs of antihypertensive and
potassium-sparing diuretics which decrease the K excretion induce
hyperkalemia, whereas some diuretic drugs increase the K excretion
resulting in hypokalemia and taking exogenous insulin can induce
mild hypokalemia. In contrast, taking drugs such as hypoglycemics,
and diuretics could induce hyponatremia [9].
Blood urea nitrogen (BUN) and creatinine (Cre) are useful
and simple biomarkers used as indexes of diabetic nephropathy
[2,3,22]. According to Chutani and Pande (2017), BUN and Cre concentrations are correlated with the HbA1c values. The ratio of
BUN to Cre concentration (BUN/Cre) is used to estimate the type
of azotemia: This ratio of more than 20 indicates the possibility of
prerenal failure, the ratio between 10 and 20 indicates the possibility
of normal or postrenal failure, and below 10 indicates the possibility
of renal failure [4,20].
In the present study, we investigated the medical chart of 60
diabetic patients, calculated their eGFR from the Cre concentrations
in serum, and classified to t he patients with hyper-, normal- and
hypofiltration. We compared many factors, such as the Na, K, BUN,
and Cre concentrations, BMI and HbA1c values in serum, and age of
the patients with hyper-, normal-, and hypofiltration, respectively,
and investigated the typical symptom related to the hyperfiltration.
Material and Methods
Ethics statement:
This research p roject and associated consent procedures were
approved by the Human Research Ethics Committee of the Graduate
School of Pharmaceutical Sciences, Health Sciences University of
Hokkaido (No.15P004), and the Nikko Memorial Hospital (No. 80).
All participants of DM provided their written informed consent to
participate in this study.
Diabetic patients:
Surveys from medical charts of diabetic patients from males
(n=36) and females (n=24) were conducted mostly in August 2014
from Nikko Memorial Hospital (Hokkaido prefecture, Japan).
Information on diabetic males and females is shown in supplemental
Table 1 and 2, respectively. All patients investigated were T2 DM,
but the duration of DM therapy was unknown. Most DM patients
participated in our previous studies of hair analyses [5]. All patients
except for one (RF14B, see Table 1) took an antihyperglycemic drug,
and some patients took the diuretic and/or antihypertensive drugs.
eGFR was calculated by serum Cre concentration (mg/dL) and
age (years), according to the following equation for Japanese [11].
eGFR = 194 x Cre-1.094 x Age-0.287 (x 0.739 if the subject is female)
The values o f eGFR were considered “very low” (severe
hypofiltration) and “very high (hyperfiltration)” when eGFR was less
than 30 mL/min/1.73 m2 and above 120 mL/min/1.73m-2, respectively
[2,5,17].
Statistical analyses:
Data were analyzed by student-t test using the Statcel 2 program
(add-in software on E xcel, OMS, Japan), with a value of p<0.05
considered to be significant. Data were expressed by the mean ± S.D.
with outlier (s).
Results
General information:
Figure 1 illustrates the data of male and female patients (age, BMI,
HbA1c, eGFR, Na, K, Cre, and BUN) using box plots with outlier
(s) which are listed in Table 1 and 2. Patients with outliers in K
concentration and eGFR value are listed in Tables 3-6. No significant
difference between male and female patients was observed in those
items, even considering some outliers.
The ages of male and female patients were 63.1 ± 12.2 (36-85, n=36)
years and 68.9 ± 13.6 (40 -95, n=24) years, respectively (Figure 1).
The BMI of female patients (16.8-39.5 kg/m2) was widely ranged
than that of male patients (16.5-34.2 kg/m2): The BMI of males was
23.3 ± 3.5kg/m2 (n=35) with an outlier (RF14I, 34.2kg/m2) and that
of females was 26.2 ±6.8 (n=24) kg/m2, respectively; twelve males
and eleven females exceeded the reference range of BMI
(17.5-25.0 kg/m2), respectively. Especially, one male and eight
females exceeded 30 kg/m2. On the other hand, one male (RF14A7,
16.5 kg/m2) and two females (RF14II, 16.8 kg/m2; RF14BB, 17.1
kg/m2) were below the reference range.
The HbA1c values of male and female patients were 9.5 ± 2.3 (6.8-
15.3, n=36) % and 9.8 ± 2.1 (6.7-14.3, n=24) %, respectively; eleven
males and nine females exceeded 10 %, and the highest value was
found in the male patient at 15.3 % (RF14EE).
The Na concentrations in serum of male patients were 137±3.3
(n=35) nmol/L with an outlier (RF14EE, 125nmol/L) and those of female patients were 139±3.0 (n=23) nmol/L with an outlier (RF14BB,
125 nmol/L); nineteen males and ten females including RF14EE and
RF14BB were below the reference range of Na concentration (138-145
nmol/L). On the other hand, none of patients exceeded the reference
range of Na concentration.
The K concentrations in serum of male and female patients were
4.4± 0.5 (3.4-5.4, n=36) nmol/L and 4.1 ± 0.5 (3.3-5.4, n=24) nmol/L,
respectively; seven males and one female exceeded the reference
range of K concentration (3.6 -4.9 nmol/L), whereas two males and
three females were below the reference range. Those patients with
hyper- and hypokalemia were listed in Table 3 and 4, respectively.
The eGFR v alues of male patients, calculated from their Cre
concentrations, were 79 ± 35 (12.7-148, n=36) mL/min/1.73 m2, and
those of female patients were 71 ± 32 (9.7-140, n=23)mL/min/1.73 m2
with an outlier (RF14UU, 200.2mL/min/1.73 m2).
Hyperfiltration (eGFR ≥120 mL/min/1.73 m2) was found in four
male and two female patients (Table 5). The highest eGFR value
(200.2mL/min/1.73m2) was found in the youngest female patient with
HbA1c value and Na concentration being 13.1 % and 135 nmol/L
(RF14UU, 40 years), respectively, and the second highest (148.1mL/
min/1.73m2) was found in the youngest male patient with HbA1c
and BMI values being 14.4% and 26.2 kg/m2 (RF14Y, 36 years),
respectively. The HbA1c values of patients with hyperfiltration (n=6)
scattered a relatively wide range of 6.8-14.4 % (Table 5).
Hypofiltration (less than 60 mL/min/1.73 m2) was found in 10
male and 10 female patients. Especially, severe hypofiltration (less than 30 mL/min/1.73m2) was found in three male patients and one
female patient (Table 6), and their HbA1c values were scattered
relatively in a narrow range (7.7-11.3 %). The lowest eGFR value
at 9.7 mL/min/1.73 m2 was found in the female patient (RF14BB):
BUN concentration and HbA1c value in her serum were 61.0 mg/dL
and 10.1 %, respectively, but she hadn’t had artificial dialysis yet.
The BUN concentrations of male patients were 17.1 ± 5.3 mg/
dL (n=33) with three outliers (RF14A4, 50.9mg/dL; RF14R, 54.7 mg/
dL; RF14QQ, 79.0 mg/dL) and those of female patients
were 15.4 ± 5.2 (n=22) with two outliers (RF14A1,29.0 mg/dL;
FR14BB, 61.0 mg/dL). Among those five outliers, nine were the
same patients with hypofiltration as listed in Table 4. Nine male and
four female patients exceeded the upper range of BUN
concentration (8-20 mg/dL). On the other hand, the lowest BUN
concentration (4.9 mg/dL) was found in a female patient
(RF14DDD) with K concentration being 3.3 mg/dL (hypokalemia)
and the ratio of BUN to Cre (BUN/Cre) is being 9.1.
The Cre concentration of male patients was 0.86 ± 0.39 mg/
dL(n=34) with two outliers (RF14A4, 2.77 mg/dL; RF14R, 3.86mg/dL) and that of female patients was 0.64 ± 0.24 mg/dL (n=23) with
an outlier (RF14BB, 4.29mg/dL). Seven males were below the lower
range of Cre concentration for males (0.6-1.1 mg/dL), and two
females were below that of females (0.4-0.8 mg/dL); as a matter of
course, most of those patients having low Cre concentrations were
the patients with hyperfiltration (Table 5).
Sodium and potassium concentrations in serum of diabetic patients and classified by HbA1c and eGFR values:
Figure 2 shows the scatter plot of Na and K concentrations in
serum of male and female diabetic patients. The dotted square
indicates the normal ranges of Na concentration (138-145 nmol/L)
and K concentration (3.6-4.9 nmol/L) in serum, and the
plotted patients were classified by HbA1c levels (left figure) and
eGFR levels (right figure).
Male and female patients tended to have low Na concentration
(hyponatremia), and many male patients and one female patient have
high K concentration (hyperkalemia): Twenty-three among 36 male
patients and 13 among 24 female patients were scattered outside of
the square. Some male patients with HbA1c value exceeded 10% were
distributed outside the upper left corner of the square (hyponatremia and hyperkalemia), whereas one female patient with HbA1c value
which exceeded 10% was distributed outside the low- left corner
of the square. Negative correlations (p < 0.05) were found between
Na concentration and HbA1c value of both male patients and female
patients. A positive correlation (p < 0.05) was found between K
concentration and HbA1c value of female patients, but not of male
patients.
Of the four male patients with hyperfiltration (above 1 2 0 mL/
min/1.73m2, Table 5), three were distributed outside of the low left
corner of the square (RF14V, RF14WW and RF14A7) and one
was distributed inside of the low-left corner of the square (RF14Y).
Similarly, two female patients with hyperfiltration distributed outside
of the low left corner of the square (RF14CC and RF14UU). The Na
concentrations in the patients with hyperfiltration (n = 6) and those
with normal- and hypofiltration (n =54) were similar (136 ± 1.1 vs
137 ± 4.1 nmol/L), whereas the K concentrations in the patients with
hyperfiltration (n = 6 ) was significantly lower th an those (n =54)
(3.9± 0.1 vs 4.3 ± 0.5 nmol/L).
The Na concentrations of male (RF14EE) and female (RF14BB)
patients were very low (125 mmol/L) which were shown as the outliers of Na concentration (Figure 1). This male patient (RF14EE)
had the highest HbA1c value (15.3 %), and the female patient
(RF14BB) had the lowest eGFR value (9.7 mL/min/1.73 m2). The male
patient took insulin preparation, biguanide and sulfonylurea drugs
and the female patient took DPP-4 inhibitor, without any diuretic
and antihypertensive drugs.
Relationship among Cre, BUN and eGFR:
Figure 3 shows scatter plot of Cre and BUN concentrations of
male and female patients and the numbers shown in this figure are
eGFR values (mL/min/1.73m2). In both male and female patients,
strong positive correlations were found between Cre and BUN
concentrations (p <0.01), whereas, as data not shown in Figure,
strong negative correlations were found between BUN concentration
and eGFR value (p <0.01) and between Cre concentration and eGFR
value (p <0.01).
All patients except for one (RF14BB) distributed the above area of
the line of Y=10X (BUN/Cre>10), and about half were distributed the
above area of the line of Y=20X (BUN/Cre>20).
All patients with severe hypofiltration (eGFR values of
RF14BB, RF14R, RF14A4 and RF14QQ were 9.7, 12.7, 19.2 and 28.8
mL/min/1.73m2, respectively) were distributed at the outside of
normal ranges of Cre concentration (below 1.1 mg/dL for males and
0.8 mg/dL for females) and BUN concentration (below 20 mg/dL),
and the ratios of BUN/Cre in those patients were 14.2-43.2.
All patients with hyperfiltration except for one (RF14A7, 141.9
mL/min/1.73m2) were distributed in the normal ranges of BUN and
Cre concentrations.
Of seven patients having high K concentration (5 ≤nmol/mL,
Table 3), five were distributed in the area above the line of Y=20X
(BUN/Cre > 20), and two were distributed in the areas lightly below
this line. On the other hand, the patients having low K concentration
(3.5 > nmol/mL, Table 4) were distributed in the area between two
lines (Y = 10X and Y = 20 X). The ratios of BUN/Cre in both male
patients and female patients have significantly correlated their K
concentrations (p < 0.05).
Age-dependent decreases of HbA1c and eGFR values, and hyperfiltration:
The age-dependent decreases of HbA1c and eGFR values in male
and female diabetes are shown in upper and lower figures, respectively
(Figure 4).
The HbA1c values of both male and female patients decreased
with ages (upper figure, p <0.05 and 0.01, respectively); about 0.7%
of HbA1c values decreased per decade in male and female patients.
The eGFR of male and female patients shown by the solid lines
decreased with the ages (lower figure). However, the slope of females
(Y = -1.38X + 171, p <0.05) was slightly steeper than that of males
(Y = -0.79X + 129, p <0.10). The dotted lines indicate the 5th and
95th percentiles of eGFR of combined control subjects from male and female at 20-89 years without pre diabetes and pre hypertension
(Okada et al., 2012). Those dotted lines showing the 5th and 95th
percentiles of control subjects decreased slightly with age; those
slopes were about from -0.5 to -0.6 mL/min/1.73 m2/year. The slopes
of diabetic patients of males and females in this study (-1.38 mL/
min/1.73 m2/year and -0.79 mL/min/1.73 m2/year, respectively) were
apparently steeper than those of 5th and 95th percentiles of control
subjects.
Seven male patients and three female patients exceed the dotted
line of 95th percentile of eGFR value, of which included three males
(RF14KK, RF14B and RF14S had 103.9, 116.4 and 116.7 mL/min/
1.73m2, respectively) and one female (RF14G had 108.7 mL/min/
1.73m2), although their eGFR values were below 120 mL/
min/1.73m2. On the other hand, ten male and seven female
patients were below the dotted line of the 5th percentile of
eGFR value, respectively, although the eGFR values of seven
males and six females were above30 mL/min/1.73m2, respectively.
Discussion
All patients with hyperfiltration exceeded 120 mL/min/1.73
m2 (four males and two females) characteristically have low Na
concentration (135-138 nmol/L) (mild hyponatremia, whereas the K
concentrations in the patients with hyperfiltration were normal
range of K concentration, but significantly lower than those with
normal- and hypofiltration (Figure 2). Three of six patients with
hyperfiltration took antihyperglycemic drug (DPP-4 inhibitor, SGL2
inhibitor and/or metformin) and the other three took both insulin
preparation and diuretic drug (furosemide, spironolactone and/or
tolvaptan), and most of the patients with normal- and hypofiltration
took the same or similar drugs. Thus, mild hyponatremia with a
relative lower K concentration in the serum seems to be the
characteristic symptoms of diabetes with hyperfiltration. So far we
know, we first report the symptoms of hyperfiltration. The low Na
concentration and high K concentration in serum were observed in
many diabetic male patients (Figure 2). In agreement, Ishikawa et al.
(1994) and Saito et al. (1999) found the hyponatremia with
hyperkalemiaor the hypernatremia with hypokalemia in the
patients of uncontrolled hyperglycemia.
The highest hyperfiltration was found in the youngest female, 40
years old (RF14UU, 200.2 mL/min/1.73m2) among 24 female
patients who participated in this study (40-90 years), and the second highest
was youngest male, 36 years old (RF14Y, 148.1 mL/
min/1.73m2) among 36 male patients (36-85 years). In agreement,
Jerums et al. (2010) reported that the prevalence of
hyperfiltration is markedly higher in T2 DM under 40 years than
that over 65 years.
References
Citation
Kimura O, Fujino R, Satoh E, Hotta Y, Hayasaka M, et al. Hyperfiltration in Diabetic Patients Associated With Mild Hyponatremia. Adv Diabetes
Endocrinol 2022;6(1): 7.