
Research Article
*Address for Correspondence: Mohamed I. Sakran, Department of Biochemistry, Faculty of Science, Tabuk University, Saudi Arabia; E-mail: msakran@ut.edu.sa
Citation: Al-Duais MA, Sakran MI, Shalaby KA, Habib SA, Khamis AA. Diagnostic Value of Serum Adenosine Deaminase in Type II Saudi Diabetic Patients. Adv Diabetes Endocrinol 2015;1(1): 5.
Copyright © 2015 Al-Duais MA, et al. This is an open access article distributed under the Creative Commons Attribution License, which permits unrestricted use, distribution, and reproduction in any medium, provided the original work is properly cited.
Advances in Diabetes & Endocrinology | Volume: 1, Issue: 1
Submission: 31 July, 2015 | Accepted: 26 August, 2015| Published: 31 August, 2015
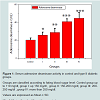
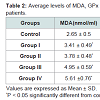
The level of serum ADA was found significantly (P < 0.05) increased by 26%, 41.6%, 100.5%, and 118.6% respectively in all diabetic groups with respect to control group (Figure 1). As presented in table the levels of MDA were increased by 28.6% in group I up to 111.7 % in group IV compared with controls. These increases are directly proportional to the increases in the levels of glucose from group I to Group IV. However, highly significant decreases (P < 0.001) are found in the mean erythrocytes GPX and erythrocytes SOD activities of the patients of the four diabetic groups compared to the controls. These decreases are inversely proportional to the increases in the levels of glucose from group I to group IV (Table 2).
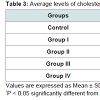
The levels of cholesterol were significantly (P < 0.05) increased from group I to group IV diabetic by 56.3%, 53.2%, 63.5% and 88.9% respectively compared with control group. Similar elevations were observed in the levels of triglycerides from 50.5% in group I up to 78.4% in group IV diabetic group compared to controls. The level of glycosylated hemoglobin (HbA1c) was significantly (P < 0.05) increased from 53% in group I up to 88% in group IV. These increases are directly proportional to the increases in the levels of glucose from group I to Group IV (Table 3).
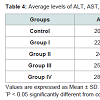
The levels of serum ALT and AST were increased by 8.2% and 11.3% respectively in diabetic group I up to 38.1% and 41.6% respectively in diabetic group IV comparing with control group. The levels of uric acid, creatinine, and urea were increased by 20.7%, 13.6% and 17.1% respectively in diabetic group I up to 31.8% , 40.8% and 74.2% respectively in diabetic group IV comparing with control group. The levels of MDA were increased by 28.6% in group I up to 111.7% in group IV compared with controls. These increases are directly proportional to the increases in the levels of glucose from group I to Group IV. However, highly significant decreases (P < 0.0001) are found in the mean erythrocytes GPX and erythrocytes SOD activities of the patients of the four diabetic groups compared to the controls. These decreases are inversely proportional to the increases in the levels of glucose from group I to group IV (Table 4).
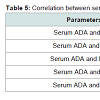
Level of Serum ADA was significantly (P < 0.001) and positively correlated with FBS, MDA and HbA1c concentration in type 2 diabetes, However, negative significant correlation (P < 0.001) were found in the mean erythrocytes GPX and erythrocytes SOD activities of the patients of the diabetic groups (Table 5).
Diagnostic Value of Serum Adenosine Deaminase in Type II Saudi Diabetic Patients
Mohammed A. Al-Duais1,2, Mohamed I. Sakran1,3*, Kamal A. Shalaby1,4, Salem A. Habib1 and Abeer A. Khamis3
- 1Department of Biochemistry, Faculty of Science, Tabuk University, Saudi Arabia
- 2Department of Chemistry, Faculty of Science, Ibb University, Yemen
- 3Department of Chemistry, Faculty of Science, Tanta University, Egypt
- 4Department of Biochemistry, Faculty of Science, Ain Shams University, Egypt
*Address for Correspondence: Mohamed I. Sakran, Department of Biochemistry, Faculty of Science, Tabuk University, Saudi Arabia; E-mail: msakran@ut.edu.sa
Citation: Al-Duais MA, Sakran MI, Shalaby KA, Habib SA, Khamis AA. Diagnostic Value of Serum Adenosine Deaminase in Type II Saudi Diabetic Patients. Adv Diabetes Endocrinol 2015;1(1): 5.
Copyright © 2015 Al-Duais MA, et al. This is an open access article distributed under the Creative Commons Attribution License, which permits unrestricted use, distribution, and reproduction in any medium, provided the original work is properly cited.
Advances in Diabetes & Endocrinology | Volume: 1, Issue: 1
Submission: 31 July, 2015 | Accepted: 26 August, 2015| Published: 31 August, 2015
Abstract
Background: Diabetes mellitus (DM) is one of the most causative important factors of mortality in the developing countries. Adenosine deaminase (ADA) is a purine metabolizing enzyme that catalyzes the deamination of adenosine to inosine. The aim of the work was to evaluate the diagnostic value of serum ADA and its association with hyperglycemia in type II Saudi diabetic patients in Tabuk region at Kingdom of Saudi Arabia. Seventy one Type II Saudi diabetic patients and twenty two healthy controls were enrolled in this study. The diabetic patients were divided into four groups according to their fasting blood sugar. Serum levels of ADA, total cholesterol (TC), triglycerides (TG), glycosylated hemoglobin (HbA1c), alanine amino transferase (ALT), aspartate amino transferase (AST), urea, creatinine, uric acid, Malondialdhyde (MDA), Glutathione Peroxidase (GPx) and Superoxide dismutase (SOD) were measured.Results: There was a significant increase (p < 0.05) in serum ADA, TC, TG, HbA1c, ALT, AST, urea, creatinine, uric acid and MDA in diabetic groups compared to the controls, while the levels of GPx and SOD were significantly decreased (p < 0.05) in diabetic groups compared to the controls.
Conclusion: The increasing of serum activity of adenosine deaminase was found as a good diagnostic marker for type II Saudi diabetes where it is highly significantly correlated with the glycemic status.
Introduction
Diabetes mellitus (DM) is one of the most causative important factors of mortality in the developing countries where it affects more than 170 million persons all over the world [1]. It is characterized by insulin deficiency either in secretion or action or both which leads to hyperglycemia and the disturbances of carbohydrate, lipid, and protein metabolism [2]. Hyperglycemia leads to increased oxidative stress by forming free radicals and superoxide ions and increases adenosine deaminase (ADA) activity [3]. ADA is a purine metabolizing enzyme that catalyzes the deamination of adenosine to inosine regulating intracellular and extracellular adenosine concentration [4]. ADA may play a role in insulin effect and glycemic control as adenosine acts directly to stimulate insulin activity via several processes such as glucose transport, pyruvate dehydrogenase activity, lipid synthesis, leucine oxidation and cyclic nucleotide phosphodiesterase activity [5]. Therefore, the activity of ADA in Type 2 DM is a marker for prognosis in Type 2 DM. Several studies have demonstrated the increase in adenosine deaminase in patients with type 2 diabetes mellitus. Insulin administration has been shown to reduce the elevated ADA activity in type 2 diabetics [6,7]. ADA has been shown to impair the insulin sensitivity for glucose transport and antilipolysis by inactivating extracellular adenosine, which adipocytes release spontaneously. ADA activates lipolysis and increase in cyclic AMP accumulation due to noradrenaline [8].The aim of this study is to assess the diagnostic value of serum ADA and other biochemical parameters such as lipid profile, and liver enzymes in type 2 Saudi diabetics and normal controls. This will help ascertain a correlation between serum ADA and glycemic status in type 2 DM.
Subjects and Methods
Study subjectsSeventy one Saudi patients both males and females in the age range of 40-65 years on oral hypoglycemic drugs, having uncomplicated type 2 diabetes mellitus were divided into four groups according to the level of their serum fasting sugar. The group I in sugar level up 150 mg/dl, group II in sugar range 150-200 mg/dl, group III in sugar range 200-250 mg/dl and group IV their sugar level more than 250 mg/dl in addition to twenty two non-diabetic healthy individuals as control group, both males and females in the same age range. They were recruited from the local community in Tabuk city. The study was conducted at King Khalid Hospital at Tabuk City, Kingdom of Saudi Arabia between March to July 2014. All subjects gave written informed consent to participate. The study was approved by the Local Ethics Committee. All subjects were interviewed for details of their age, weight, height, and smoking. Also, blood pressure and body mass index (BMI) were measured for each subject.
Exclusion criteria: Individuals with diabetic complications (neuropathy/retinopathy /nephropathy/vascular complications etc.), hypertension/acute or chronic infection disease. Any medications other than the ones used for diabetic therapy/addictive habits/ pregnancy will be excluded from the study [9].
Diagnostic criteria for type II diabetes mellitus: Thorough clinical examination with appropriate investigations will be done before selecting the cases & controls for the study [10].
Biochemical assays
Fasting blood samples were obtained from the patients as well as the controls. The blood sample was divided into two parts: the first part without anticoagulant to obtain serum and the second part was transferred into heparinized tube to obtain whole blood. Serum samples were frozen in dry ice prior to being stored at -80 °C and blood sample in refrigerator at 4 °C. The level of serum adenosine deaminase (ADA) was determined using a spectrophotometer based on the method by Giusti and Galanti [11]. Adenosine deaminase hydrolyses adenosine to inosine and ammonia. Ammonia then reacts with a phenol and hypochlorite in an alkaline medium to form a colored blue indophenol complex, using sodium nitroprusside as a catalyst. The degree of blue indophenol complex is directly proportional to the activity of ADA in the sample. The absorbance was read against water at 635 nm using a spectrophotometer. One unit of ADA is defined as the amount of enzyme required to release 1 mmol of ammonia per minute from adenosine at standard assay conditions.
The following biochemical parameters were determined using available Biodiagnostic kits (Randox): serum fasting blood sugar (FBS), Glycosylated hemoglobin (HbA1c), cholesterol, triglycerides, aspartate aminotransferase (AST), alanine aminotransferase (ALT), urea, uric acid, creatinine. Lipid peroxidation was estimated by measuring malondiadehyde (MDA), superoxide dismutase (SOD) and Glutathione-peroxidase (GPx).
Statistical analysis
The statistical analysis was performed using students’ t’ test to compare mean values of variables in control and different groups of type 2 diabetes mellitus. The correlations were assessed by Pearson rank correlation coefficient. Differences were considered statistically significant when p < 0.05 and highly significant when p < 0.001.
Results
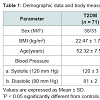
The basal characteristics of the study groups are shown in (Table 1). There were no significant differences between diabetic patients and controls for almost variables. Non-significant differences were observed between the two groups in cystolic or diastolic blood pressure, while slightly significant decrease was observed in BMI in type 2 DM group compared to the control group.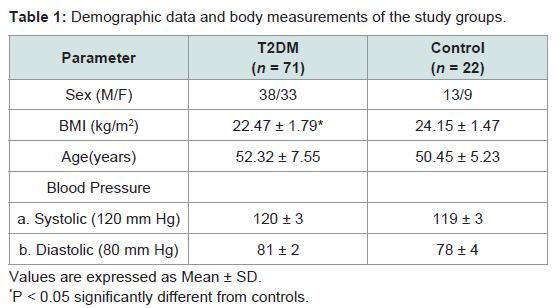
Table 1: Demographic data and body measurements of the study groups.
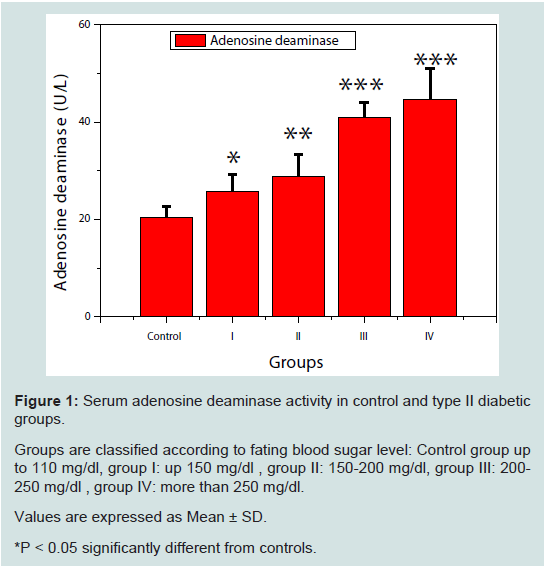
Figures 1: Serum adenosine deaminase activity in control and type II diabetic groups.
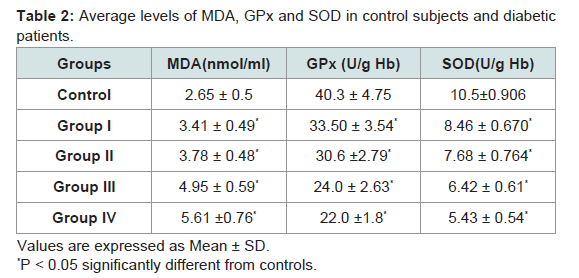
Table 2: Average levels of MDA, GPx and SOD in control subjects and diabeticpatients.
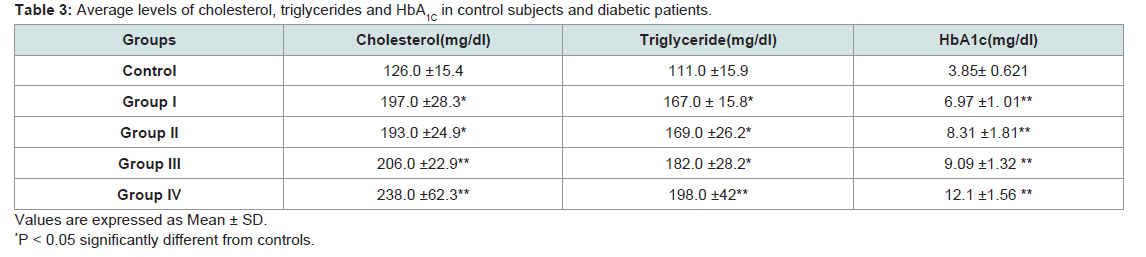
Table 3: Average levels of cholesterol, triglycerides and HbA1C in control subjects and diabetic patients.
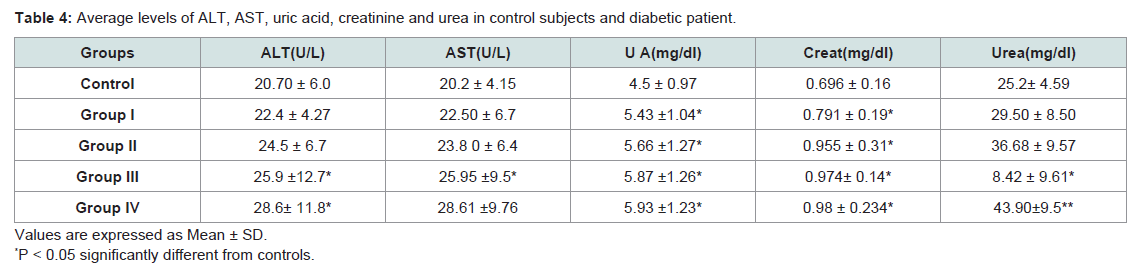
Table 4: Average levels of ALT, AST, uric acid, creatinine and urea in control subjects and diabetic patient.
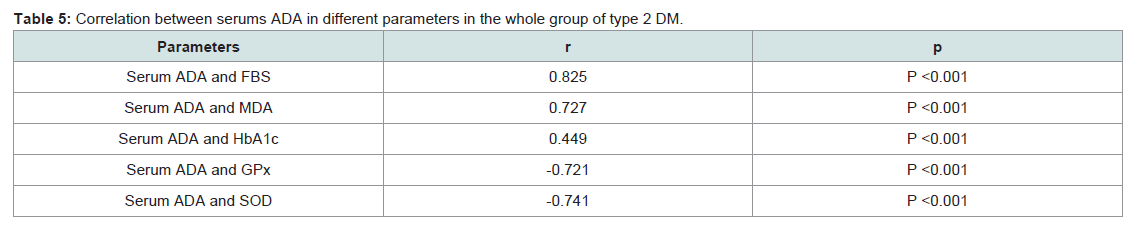
Table 5: Correlation between serums ADA in different parameters in the whole group of type 2 DM.
Discussion
Diabetes mellitus is type 2 is a heterogeneous disease characterized by altered carbohydrate, fat and protein metabolism secondary to insulin resistance. It is characterized by hyperglycemia leading to increased oxidative stress and dyslipidemia. Identifying the resistance of insulin helps in minimizing the complications at an early stage. ADA estimation as a simple, inexpensive marker which can identify insulin resistance without actually requiring estimation of serum insulin is required in current methods for measuring insulin resistance.All subjects were interviewed for details of their age, weight, height, and smoking. Also, blood pressure and body mass index (BMI) were measured for each subject.
Individuals with uncomplicated Type 2 DM with a BMI in the range of 19-25 kg/m2 were included in our study.Our results show, that adenosine deaminase (ADA) activities were significantly increased in all the four diabetic groups as compared to control group (Figure 1). This increase was more than two times in 3rd and 4th diabetic groups with respect to controls. It was a positive significant correlation between FBS and serum ADA as shown in Table 5.
Our results were in agreement with results obtained in previous studies that concluded the increased in adenosine content make similar effect to insulin on glucose and lipid metabolism in adipose tissue [12,13]. The increasing of Serum ADA levels in our study may be due to insulin resistance or increased secretion of adenosine [14]. Decreased tissue adenosine levels is due to increased ADA activity which is related to the degree of hyperglycemia and lipid peroxidation in diabetes mellitus due to insulin resistance in the target organs and also the increased in production of free radicals and oxidative stress. In other words the increase in ADA activity may lead to the decrease in adenosine content that requires to formation of ATP for the first step in glycolysis, therefore the level of glucose increases in the blood [15]. Our results showed a significant increase in HbA1c among all the four diabetic groups (Table 2); in addition to positive correlation between HbA1c and ADA (Table 4). These results are in accordance with other studies [16,17].
Our results showed that the oxidative stress parameters such as MDA, GPx and SOD were significantly increased in all diabetic groups compared with the healthy controls (Table 4). These observations were similar to that obtained by other investigators [18-22]. The observed high levels of plasma MDA in diabetic groups reflected lipid peroxidation resulted from oxidative stress. We also found significant decreases in glutathione peroxidase (GPX) and superoxide dismutase (SOD) activities in all diabetic groups compared to the controls. These results are in agreement with other reports reported by other authors [23]. These disturbances in these parameters may result in a number of deleterious effects due to the accumulation of superoxide radicals and hydrogen peroxides [24]. The increase in the level of MDA correlated directly with hyperglycemia in these patients because of auto oxidation of glucose, which causes the generation of free radicals. Hence complications of diabetes may be a result of the elevations in levels of free radicals and the reduction in antioxidant defenses (GSH, GPx, GR and SOD) [25].
Adenosine binds to its receptors on various tissue cells then stimulates glycogenolysis, gluconeogenesis leading to hyperglycemia that is associated with the increase inactivity of ADA, which is one of the factors that lead to the increase in production of oxidative stress by generation of reactive oxygen species [26].
Hyperglycemia affected the liver functions. The values of the liver enzymes AST and ALT in our study show that, these enzymes were significantly higher in all diabetic groups than of the controls. This is accordance with Idris et al. [32].
As can be seen from the present study, the serum level of uric acid was significantly increased in diabetic patients compared to the healthy individuals. This is similar to Kuo-Liong suggesting a positive association between the plasma concentration of uric acid and the incidence of type 2 diabetes Chinese individuals [33].
The significant increase of serum urea and creatinine in our study was in accordance with results of Viswanathan [34], who reported a positive association between these parameters and diabetic disease. Hyperuricemia is a strong predictor of stroke events in middle-aged patients with type 2 diabetes independently of other cardiovascular risk factors [35]. Our results show that the values of cholesterol and triglycerides were higher in diabetics compared with the normal individuals. It was reported that dyslipidemia is a an important distributor to the increased cardio-vascular disease (CVD) risk in patients with type 2 diabetes and is characterized by elevated levels of triglycerides and low levels of HDL cholesterol [36].
Conclusion
The increasing of serum activity of adenosine deaminase was found as a good diagnostic marker for type II Saudi diabetes where it is highly significantly correlated with the glycemic status.Acknowledgements
The Authors extend their appreciation to the Deanship of Scientific Research at Tabuk University for funding the work through the research group Project No. S-0046-1435.References
- Nathan DM, DCCT/EDIC Research Group (2014) The diabetes control and complications trial/epidemiology of diabetes interventions and complications study at 30 years: overview. Diabetes Care 37: 9-16.
- Bobb A, Gale D, Manmohan S, Mohammed A, Seetahal F, et al. (2008) The impact of the chronic disease assistance plan (CDAP) on the control of type 2 diabetes in Trinidad. Diabetes Res Clin Pract 80: 360-364.
- Havilah P, Vinodh BP, Prasad KD (2013) Adenosine deaminase activity in type-2 diabetes mellitus-An independent marker of glycemic status and stimulator of lipid peroxidation. Int J Chem Life Sci 2: 1175-1178.<
- Kouzu H, Miki T, Tanno M, Kuno A, Yano T, et al. (2015) Excessive degradation of adenine nucleotides by up-regulated AMP deaminase underlies afterload-induced diastolic dysfunction in the type 2 diabetic heart. J Mol Cell Cardiol 80: 136-145.
- Admyre T, Amrot-Fors L, Andersson M, Bauer M, Bjursell M, et al. (2014) Inhibition of AMP deaminase activity does not improve glucose control in rodent models of insulin resistance or diabetes. Chem Biol 21: 1486-1496.
- Thakur M, Javarappa D (2014) Adenosine deaminase and malondialdehyde levels in type-2 diabetes mellitus-a short study. Glob J Med Res 14.
- Zhang W, Wang J, Wang H, Tang R, Belcher JD, et al. (2010) Adenosine inhibits tissue factor induction and thrombus formation by activating the phosphoinositide 3-kinase/Akt signaling pathway. Arterioscler Thromb Vasc Biol 30: 1000-1006.
- Khemka VK, Bagchi D, Ghosh A, Sen O, Bir A, et al. (2013) Raised serum adenosine deaminase level in nonobese type 2 diabetes mellitus. Scientific WorldJournal: 404320.
- Erbağc Ab, Akin M, Köylüoğlu O, Özdemir Y, Tarakçıoğlu M, et al. (2000) Elevated adenosine deaminase activity is not implicated in microvascular complications of type 2 diabetes mellitus except HbA1c. Turkish J Endocrinol Metabol 4.
- American Diabetes Association (2009) Diagnosis and classification of diabetes mellitus. Diabetes Care 32 (Suppl 1): S62-S67.
- Giusti G, Galanti B (1984) Colorimetric method. Adenosine deaminase. In: H. U. Bergmeyer, Ed., Methods of enzymatic analysis, 3rd edition, Verlag Chemie, Weinheim, Germany, pp. 315-323.
- Ramani NS, Krishnamurthy N, Prasad BN, Ashakiran S, Sumathi ME, et al. (2012) Role of adenosine deaminase to predict glycemic status in type 2 diabetes mellitus. J Clin Biomed Sci 2: 123-133.
- Prakash MS, Chennaiah S, Murthy YS, Anjaiah E, Rao SA, et al. (2006) Altered adenosine deaminase activity in type 2 diabetes mellitus. J Indian Acad Clin Med 7: 114-117.
- Ogbu IS, Nebo NC, Onyeanusi JC (2006) Adenosine deaminase activities and fasting blood glucose in obesity. J Coll Med 11: 115-119.
- Gitanjali G, Sudeep G, Neerja GM, Deepak A (2010) The effect of hyperglycaemia on some biochemical parameters in diabetes mellitus. J Clin Diagn Res 4: 3181-3186.
- Singh P, Khan S, Kumar MR (2013) Adenosine deaminase activity and its relation with glycated hemoglobin and uric acid in type 2 diabetic patients. Iran J Diabetes Obes 5: 1-6.
- Choi HK, Ford ES (2008) Haemoglobin A1c, fasting glucose, serum C-peptide and insulin resistance in relation to serum uric acid levels--the Third National Health and Nutrition Examination Survey. Rheumatology (Oxford) 47: 713-717.
- Okoduwa SI, Umar IA, Ibrahim S, Bello F (2013) Relationship of oxidative stress with type 2 diabetes and hypertension. J Diabetol 1: 1-10.
- Khanna HD, Sinha MK, Khanna S, Tandon R (2008) Oxidative stress in hypertension: association with antihypertensive treatment. Indian J Physiol Pharmacol 52: 283-287.
- Hu FB (2007) Obesity and mortality: watch your waist, not just your weight. Arch Intern Med 167: 875-876.
- Torre JJ, Bloomgarden ZT, Dickey RA, Hogan MJ, Janick JJ, et al. (2006) American Association of Clinical Endocrinologists medical guidelines for clinical practice for the diagnosis and treatment of hypertension. Endocr Prac 12: 193-222.
- Mahreen R, Mohsin M, Nasreen Z, Siraj M, Ishaq M (2010) Significantly increased levels of serum malonaldehyde in type 2 diabetics with myocardial infarction. Int J Diabetes Dev Ctries 30: 49-51.
- Ozdemır G, Ozden M, Maral H, Kuskay S, Cetınalp P, et al. (2005) Malondialdehyde, glutathione, glutathione peroxidase and homocysteine levels in type 2 diabetic patients with and without microalbuminuria. Ann Clin Biochem 42: 99-104.
- Gönenç A, Erten D, Aslan S, Akinci M, Şimşek B, et al. (2006) Lipid peroxidation and antioxidant status in blood and tissue of malignant breast tumor and benign breast disease. Cell Biol Int 30: 376-380.
- Pasupathi P, Bakthvathsalam G, Saravanan G, Latha R (2009) Evaluation of oxidative stress and antioxidant status in patients with diabetes mellitus. J Appl Sci Res 5: 770-775.
- Sozmen EY, Sozmen B, Delen Y, Onat T (2001) Catalase/superoxide dismutase (SOD) and catalase/paraoxonase (PON) ratios may implicate poor glycemic control. Arch Med Res 32: 283-287.
- Kumawat M, Pahwa MB, Gahlaut VS, Singh N (2009) Status of antioxidant enzymes and lipid peroxidation in type 2 diabetes mellitus with micro vascular complications. Open Endocrinol J 3: 12-15.
- Salem M, Kholoussi S, Kholoussi N, Fawzy R (2011) Malondialdehyde and trace element levels in patients with type 2 diabetes mellitus. Arch Hell Med 28: 83-88.
- Thakur M, Javarappa D (2014) Adenosine deaminase and malondialdehyde levels in type-2 diabetes mellitus–a short study. Glob J Med Res 14.
- de Ferranti S, Mozaffarian D (2008) The perfect storm: obesity, adipocyte dysfunction, and metabolic consequences. Clin Chem 54: 945-955.
- Hajer GR, van Haeften TW, Visseren FL (2008) Adipose tissue dysfunction in obesity, diabetes, and vascular diseases. Eur Heart J 29: 2959-2971.
- Idris AS, Mekky KF, Abdalla BE, Ali KA (2011) Liver function tests in type 2 Sudanese diabetic patients. Int J Nutr Met 3: 17-21.
- Chien KL, Chen MF, Hsu HC, Chang WT, Su TC, et al. (2008) Plasma uric acid and the risk of type 2 diabetes in a Chinese community. Clin Chem 54: 310-316.
- Viswanathan V, Snehalatha C, Kumutha R, Jayaraman M, Ramachandran A (2004) Serum albumin levels in different stages of type 2 diabetic nephropathy patients. Indian J Nephrol 14: 89-92.
- Khalaf SJ (2010) Study of some biochemical markers in diabetic patients. Tikrit Med J 16: 84-87.
- Haffner SM (1998) Management of dyslipidemia in adults with diabetes. Diabetes Care 21: 160-178.