
Journal of Oral Biology
Download PDF
Research Article
*Address for Correspondence: Tadashige Nozaki, Department of Pharmacology, Osaka Dental University, 8-1 Kuzuhahanazono-cho, Hirakata, Osaka 573-1121, Japan, Tel: +81-72-864-3058; Fax: +81-72-864-3158; E-mail: nozaki@cc.osaka-dent.ac.jp
Citation: Nozaki T, Nishiitsutsuji R, Ohura K. Stem Cell-like Molecular and Morphological Properties in a Subpopulation of Human Oral Cancer Cells. J Oral Bio. 2016; 3(1): 4.
Copyright © 2015 Nozaki T. This is an open access article distributed under the Creative Commons Attribution License, which permits unrestricted use, distribution, and reproduction in any medium, provided the original work is properly cited.
Journal of Oral Biology | ISSN: 2377-987X | Volume: 3, Issue: 1
Submission: 11 December, 2015 | Accepted: 27 January, 2016 | Published: 03 February, 2016
Assessment of sphere-formation capacity
Induction of AP activity
Stem Cell-like Molecular and Morphological Properties in a Subpopulation of Human Oral Cancer Cells
Tadashige Nozaki*, Rie Nishiitsutsuji and Kiyoshi Ohura
- Department of Pharmacology, Osaka Dental University, Osaka, Japan
*Address for Correspondence: Tadashige Nozaki, Department of Pharmacology, Osaka Dental University, 8-1 Kuzuhahanazono-cho, Hirakata, Osaka 573-1121, Japan, Tel: +81-72-864-3058; Fax: +81-72-864-3158; E-mail: nozaki@cc.osaka-dent.ac.jp
Citation: Nozaki T, Nishiitsutsuji R, Ohura K. Stem Cell-like Molecular and Morphological Properties in a Subpopulation of Human Oral Cancer Cells. J Oral Bio. 2016; 3(1): 4.
Copyright © 2015 Nozaki T. This is an open access article distributed under the Creative Commons Attribution License, which permits unrestricted use, distribution, and reproduction in any medium, provided the original work is properly cited.
Journal of Oral Biology | ISSN: 2377-987X | Volume: 3, Issue: 1
Submission: 11 December, 2015 | Accepted: 27 January, 2016 | Published: 03 February, 2016
Abstract
Background: Side population (SP) cells are present in many human cancers and cancer cell lines, including human oral cancer SCC-4 cells. SP cells were identified as a side branch of Hoechstlow cells existing in a fraction darker than cells in G0/G1 phase. The ratio of isolated SP cells accounted for approximately 1.5% of the SCC-4 cell population. Here, we describe the stem cell-like properties of this subpopulation of SCC-4 cancer cells.Methods: The expression levels of the stem cell markers OCT4, SOX2 and NANOG in SP cells were measured and compared with those of non-SP cells as indicators of pluripotency. Additionally, sphere formation ability and alkaline phosphatase activity were investigated as indicators of self-renewal and undifferentiated state, respectively.
Results: OCT4 and NANOG levels were significantly higher in SP cells than in non-SP cells, while SOX2 levels did not differ between the two cell types. After induction for 2 weeks, sphere formation was notably observed and alkaline phosphatase activity was detected in spheres of SP cells.
Conclusions: Our findings reveal that SP cells have stem cell-like properties including pluripotency, self-renewal, and retention of undifferentiated state. These results suggest that a subpopulation of oral cancer cells has the potential to act as stem cells. The stem cell-like properties revealed in this study could be useful in future applications targeting intractable cancer stem cells.
Keywords
Alkaline phosphatase; Gene expression; Oral cancer; Pluripotency; Self-renewal; Sphere formation; SCC-4; Stem cells.Introduction
Cancer stem cells comprise a small subset of tumor cells and possess self-renewal potency and pluripotency to differentiate into heterogeneous lineages within a tumor, resulting in the generation and maintenance of phenotypic heterogeneity among cancer cells [1]. Although cancer stem cells have properties resembling those of normal stem cells, it is not obvious whether cancer stem cells arise through transformation from multipotent adult stem cells or conversion of cancer cells to undifferentiated stem-like cells. It is known that factors secreted from various cancer cell lines can promote the formation of cancer stem cells from induced pluripotent stem cells [2]. Moreover, tumor-derived extracellular vesicles have the potential to induce cancer stem cell properties in normal stem cells [3]. The cancer stem cells in skin, brain, and intestinal tumors are able to differentiate into cancer cells [4-6]. Because cancer stem cells have been recognized as tumor-initiating cells or tumorigenic cells, these cells represent a critical target in cancer treatment for killing cancer cells or preventing cancer recurrence [7].OCT4 (also known as POU5F1), SOX2 and NANOG are transcription factors expressed at high levels in embryonic stem (ES) cells, and the downregulation of these transcription factors is correlated with the loss of pluripotency and self-renewal [8-12]. All three transcription factors are highly expressed in pluripotent cells and are considered to be markers of primitive stem cells. To extend the knowledge of stem cell-like cancer cells, we examined here the expression of OCT4, SOX2, and NANOG in side population (SP) cells as a small subset of cancer cells. Sphere formation ability can demonstrate self-renewal potency and alkaline phosphatase (AP) activity is a specific indicator for the undifferentiated state [13-15]. To verify the stem cell-like properties of SP cells, we compared stem cell-like cancer cells with normal stem cells in this study, and examined the sphere formation ability and AP activity of SP cells.
Materials and Methods
Isolated SP cell cultureThe human cancer cell line SCC-4 (ATCC CRL-1624) was purchased from DS Pharma Biomedical (Suita, Japan). The cells were cultured in basic medium, comprising DMEM/F12 (Cat. 11330-032; Gibco, Life Technologies) supplemented with 10% fetal bovine serum (Cat. 2917354; MP Biomedicals) and 0.4 μg hydrocortisone/mL (MP Biomedicals). The method for flow cytometry isolation was described previously [16]. Briefly, 7 × 10⁷ cells were analyzed and separated using FACS. Hoechst 33342 was added to a final concentration of 5 μM, and the cells were incubated for 45 min at 37 °C with occasional agitation, followed by the addition of 5 μM reserpine (Cat. R0875, Sigma-Aldrich) to inhibit ABC transporters. Non-SP and SP cells were sorted and harvested by ReproCELL using a FACS Vantage SE (Becton Dickinson). The sorted non-SP and SP cells were cultured in basic medium.
RNA extraction
Total RNA was isolated from the cells by acid guanidinium thiocyanate-phenol-chloroform extraction using Isogen (Cat. 315-02504; Nippon Gene Co.) in accordance with the manufacturer’s instructions. Briefly, cells were homogenized in Isogen (5 × 10⁶ cells / mL), followed by a primary extraction with 200 μL of chloroform and a secondary extraction with 650 μL of chloroform. The RNA was then precipitated with 1 mL of isopropanol and washed with 1 mL of 70% ethanol. All centrifugation steps were performed at 12,000 × g at 4 °C. The extracted RNA was dissolved in UltraPure DNase/RNase-free distilled water (Cat. 10977-015; Invitrogen), and the concentration of total RNA was measured using a NanoDrop spectrophotometer (Thermo Fisher Scientific).
Quantitative real-time RT-PCR
First-strand cDNAs were synthesized from the total RNA using SuperScript VILO Master Mix (Cat. 11755050; Invitrogen, Life Technologies) according to the manufacturer’s instructions. Specific PCR primer sets were designed using a Perfect Real Time Support System (Takara Bio). The primer sets were as follows:
5’-GCAATTTGCCAAGCTCCTGAA-3’ and 5’-GCAGATGGTCGTTTGGCTGA-3’ for OCT4;5’-GTGAGCGCCCTGCAGTACAA-3’ and 5’-GCTGCGAGTAGGACATGCTGTAG-3’ for SOX2;5’-TCCAACATCCTGAACCTCAGCTA-3’ and 5’-AGGTTCCCAGTCGGGTTCAC-3’ for NANOG;5’-TTTGCGAGTACTCAACACCAACATC-3’ and 5’-GAGCATATCTTCGGCCCACAC-3’ for ribosomal protein S18 (RPS18)
Real-time RT-PCR was performed using Power SYBR Green PCR Master Mix (Cat. 4368577; Applied Biosystems, Life Technologies) to examine the expression levels of each marker. The PCR amplifications were performed using a StepOne Plus System(Applied Biosystems) with an initial denaturation step at 95 °C for 20 s, followed by 40 cycles of 95 °C for 3 s and 60 °C for 30 s, and a final automatic melting curve stage. RPS18 was amplified as an internal control to correct the quantitative analyses. The expression levels were presented as the foldchange values after induction compared with those before induction, and were calculated using the ΔΔCT method [17].
Sphere formation assay
Non-SP and SP cells were inoculated at a density of 1000 cells/mL in serum-free basic medium containing N2 Max Media Supplement (Cat. AR009; R&D Systems), 10 ng human recombinant FGFb/mL (Cat. PHG00244; Invitrogen), and 10 ng EGF/mL (Cat. PHG0314; Invitrogen), and each cell line was seeded in four wells of a low cell binding microplate (Cat. 145387; Nunc) for approximately 2 weeks. The formed spheres derived from non-SP cells and SP cells were counted on representative phase-contrast images for each well. The average size of sphere diameter was calculated by measuring the length and breadth of a particle in each sphere.
AP staining
Spheres from non-SP cells and SP cells were stained with AP Live Stain (Cat. A14353; Life Technologies), according to the manufacturer’s instructions. Briefly, the medium was removed, and the spheres were washed with pre-warmed DMEM/F-12 for 3 min. An appropriate amount of 1 × AP Live Stain solution was directly applied to the culture dishes and the spheres were incubated for 20 min. After two 5-min washes with basic medium, basal medium was added and the fluorescently labeled spheres were visualized by fluorescence microscopy using a standard FITC filter (BZ-9000; Keyence). Living spheres were observed. A representative fluorescent image for each well was analyzed. Counterstaining was performed with 4’, 6-diamidino-2-phenylindole (DAPI, Cat. D21490; Invitrogen).
Statistical analysis
Mean values for relative mRNA expression levels were calculated using Relative Quantity (RQ) Study Software and represented the statistical variability in the calculations of each sample’s RQ value. Differences in data were statistically analyzed by the Mann-Whitney U test using SPSS software. Differences in the diameter of each sphere also were statistically analyzed by the Mann-Whitney U test using SPSS software. P values of < 0.05 were considered to indicate statistical significance.
Results
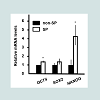
Expression levels of stem cell markers in SP cellsExpression levels of OCT4, SOX2, and NANOG were detected in both non-SP and SP cells. The value ± standard error of expression levels was calculated for each gene. The expression levels of OCT4 and NANOG in SP cells were increased by 1.5-fold and 4.5-fold, respectively, at 2 weeks after induction of sphere formation when compared with non-SP cells. The expression level of SOX2 was increased slightly in SP cells compared with non-SP cells; however, this change was not statistically significant (Figure 1).
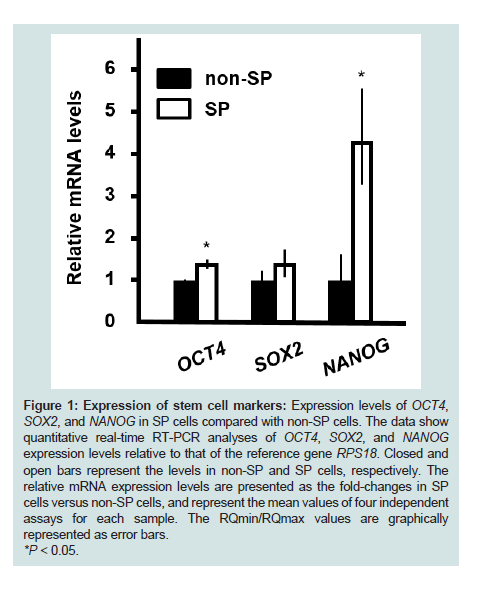
Figure 1: Expression of stem cell markers: Expression levels of OCT4, SOX2, and NANOG in SP cells compared with non-SP cells. The data show quantitative real-time RT-PCR analyses of OCT4, SOX2, and NANOG expression levels relative to that of the reference gene RPS18. Closed and open bars represent the levels in non-SP and SP cells, respectively. The relative mRNA expression levels are presented as the fold-changes in SP cells versus non-SP cells, and represent the mean values of four independent assays for each sample. The RQmin/RQmax values are graphically represented as error bars.*P < 0.05.
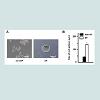
SP cells formed spheres 1 week after induction, and these spheres grew to more than 100 μm in diameter following 2 weeks of culture on low-binding dishes. Conversely, sphere formation by non-SP cells was incomplete, and numerous spheres containing small cells were observed (Figure 2A ). In total, 35 spheres were detected in non-SP cell cultures and three spheres were found in SP cell cultures excluding non-spherical shapes. The average diameter ± standard error for spheres derived from non-SP cells was 41.0 ± 5.7 μm, and 141.3 ± 16.7 μm for spheres derived from SP cells. This difference in sphere diameter was statistically significant (P < 0.05) (Figure 2B ).
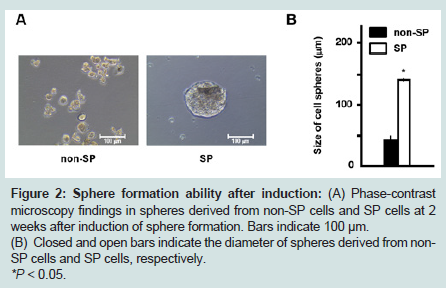
Figure 2: Sphere formation ability after induction: (A) Phase-contrast microscopy findings in spheres derived from non-SP cells and SP cells at 2 weeks after induction of sphere formation. Bars indicate 100 μm.(B) Closed and open bars indicate the diameter of spheres derived from non- SP cells and SP cells, respectively.*P < 0.05.
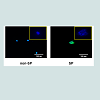
Strong AP activity was detected in spheres derived from SP cells at 2 weeks after induction of sphere formation. Contrastingly, there was less AP activity in spheres derived from non-SP cells at this time. Nuclei were detected in spheres of both non-SP and SP cells (Figure 3).
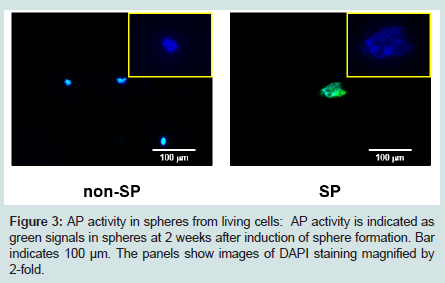
Figure 3: AP activity in spheres from living cells: AP activity is indicated as green signals in spheres at 2 weeks after induction of sphere formation. Bar indicates 100 μm. The panels show images of DAPI staining magnified by 2-fold.
Discussion
To effectively target cancer stem cells, it is necessary to first isolate them. However, specific cancer stem cell markers have not yet been identified. Fluorescent dye efflux assays can indicate the capacity of a cell to excrete drugs through ABC transporters. We used such an assay to isolate a sub population of cells with extremely low fluorescence areas, which are gated as a side branch of Hoechst low cells by FACS. These SP cell fractions within low-fluorescence areas may be enriched in stem cells, because the cells in this area can maintain the capacity for self-renewal in G0/G1 phase. The phenotype of isolated SP cells was determined based on the ability to excrete dye through ABC membrane transporters such as ABCG2. We isolated SP cells dependent upon ABCG2 upregulation. However, positive ABCG2 expression has been previously associated with tumor progenitor cells, and stem-like cancer cells were included in the population of ABCG2 negative cells [18]. Therefore, SP cells are a heterogeneous population that may not necessarily include cancer stem cells. We previously reported that the gene expression signatures in SP cells derived from the oral cancer cell line SCC-4 show similar features to cancer stem cells using profiling by DNA array analysis [18]. In the present study, SP cells isolated from the SCC-4 were evaluated, and were shown for the first time to possess the biological properties of stem-like cells.Although no difference in cell morphology was observed between the isolated non-SP and SP cells (data not shown), the SP cells exhibited remarkable differences in their stem-like state compared with non-SP cells. Specifically, OCT4 and NANOG mRNA expression levels were significantly higher in SP cells than in non-SP cells. The transcription factors OCT4, SOX2, and NANOG are master regulators of pluripotency in ES cells [19]. OCT4, SOX2, and NANOG function together to regulate a significant proportion of their target genes in ES cells [12]. In mouse ES cells, OCT4 is regulated via two parallel signaling pathways: the Jak–Stat3 cascade, which activates SOX2 but not NANOG, and the PI (3) K-AKT pathway, which does activate NANOG [20]. OCT4, SOX2, NANOG and BMI1 are normal stem cell markers. Furthermore, BMI1 is a critical regulator of SOX2-mediated maintenance of self-renewal in normal mesenchymal stem cells [21]. Moreover, knockdown of BMI1 inhibits cellular migration and invasion, suggesting a role for BMI1 in the regulation of cancer stem cells in oral cancer [22]. Additionally, expression levels of OCT4 and NANOG but not BMI1 and SOX2 were higher in SP cells than non- SP cells derived from oral cancer cell lines [23]. OCT4 and NANOG play critical roles in maintaining the cancer stem cell state and escape from conventional chemotherapy [24]. However, the underlying molecular mechanism by which OCT4 and NANOG mediate drug resistance remain incompletely understood. OCT4 and NANOG expression might be critical factors of the development of cancer stem cell resistance to chemotherapy. Interestingly, no differences in SOX2 levels were identified when comparing SCC-4 derived non-SP and SP cells. Notably, overexpression of NANOG supports self-renewal of mouse ES cells without SOX2 activity [20]. SOX2 is expressed in response to diverse environmental cues for stem cell maintenance in different types of stem cells [25]. It is possible that the lack of change in SOX2 expression in SP cells derived from SCC-4 might have some significant biological function. Further studies focused on the regulation of these transcription factors are necessary.
Spheres formed by SP cells were well-developed at 2 weeks after induction, while those formed by non-SP cells were poorly-developed. Notably, SP cell-derived spheres exceeded 100 μm diameters, suggesting that SP cells were maintained in an undifferentiated state by self-renewal. Because the growth of spheres is affected by the ability to self-renew, a larger size reflects the possession of stem cell-like properties in head and neck cancer cells [26]. Therefore, we detected AP activity in spheres derived from SP cells to identify the extent of the undifferentiated state of SP cells. While we have performed qualitative observations in this present study, quantitative and sequential analyses of AP activity in spheres should be further examined. Because AP is a phenotypic marker of pluripotent stem cells including undifferentiated ES cells, induced pluripotent stem cells, and embryonic germ cells [15,27-29], SP cells exhibiting AP activity have the potential to differentiate into several cell lineages.To reveal whether SP cells possess pluripotency, the tumor formation ability of SP cells should be further examined by subcutaneous injection into nude mice.
It is important to clarify the differences between stem-like cells derived from normal tissues and those from cancerous tissues. To decrease the targeted malignant cells, elucidation of the stem cell-like properties in a subpopulation of cancer cells will be a crucial factor for application to therapy. Based on our evidence supporting the presence of stem cell-like properties in a subpopulation of oral cancer cells, effective therapies should be developed to target these elusive and robust cells which exhibit resistance to treatment. We believe that the stem cell-like properties revealed in this study could be useful in future applications for intractable cancer.
Acknowledgements
This study was supported in part by grants from the Osaka Dental University Research Fund (15-01) and by Grants-in-Aid for Scientific Research from the Japan Society for the Promotion of Science (15K11283).References
- Clarke MF, Dick JE, Dirks PB, Eaves CJ, Jamieson CH, et al. (2006) Cancer stem cells-perspectives on current status and future directions: AACR Workshop on cancer stem cells. Cancer Res 66: 9939-9944.
- Chen L, Kasai T, Li Y, Sugii Y, Jin G, et al. (2012) A model of cancer stem cells derived from mouse induced pluripotent stem cells. PLoS One 7: e33544.
- Yan T, Mizutani A, Chen L, Takaki M, Hiramoto Y, et al. (2014) Characterization of cancer stem-like cells derived from mouse induced pluripotent stem cells transformed by tumor-derived extracellular vesicles. J Cancer 5: 572-584.
- Driessens G, Beck B, Caauwe A, Simons BD, Blanpain C (2012) Defining the mode of tumour growth by clonal analysis. Nature 488: 527-530.
- Chen J, Li Y, Yu TS, McKay RM, Burns DK, et al. (2012) A restricted cell population propagates glioblastoma growth after chemotherapy. Nature 488: 522-526.
- Schepers AG, Snippert HJ, Stange DE, van den Born M, van Es JH, et al. (2012) Lineage tracing reveals Lgr5+ stem cell activity in mouse intestinal adenomas. Science 337: 730-735.
- Reya T, Morrison SJ, Clarke MF, Weissman IL (2001) Stem cells, cancer, and cancer stem cells. Nature 414: 105-111.
- Nichols J, Zevnik B, Anastassiadis K, Niwa H, Klewe-Nebenius D, et al. (1998) Formation of pluripotent stem cells in the mammalian embryo depends on the POU transcription factor Oct4. Cell 95: 379-391.
- Avilion AA, Nicolis SK, Pevny LH, Perez L, Vivian N, et al. (2003) Multipotent cell lineages in early mouse development depend on SOX2 function. Genes Dev 17: 126-140.
- Chambers I, Colby D, Robertson M, Nichols J, Lee S, et al. (2003) Functional expression cloning of Nanog, a pluripotency sustaining factor in embryonic stem cells. Cell 113: 643-655.
- Mitsui K, Tokuzawa Y, Itoh H, Segawa K, Murakami M, et al. (2003) The homeoprotein Nanog is required for maintenance of pluripotency in mouse epiblast and ES cells. Cell 113: 631-642.
- Boyer LA, Lee TI, Cole MF, Johnstone SE, Levine SS, et al. (2005) Core transcriptional regulatory circuitry in human embryonic stem cells. Cell 122: 947-956.
- Reynolds BA, Rietze RL (2005) Neural stem cells and neurospheres reevaluating the relationship. Nat Methods 2: 333-336.
- Pastrana E, Silva-Vargas V, Doetsch F (2011) Eyes wide open: a critical review of sphere-formation as an assay for stem cells. Cell Stem Cell 8: 486-498.
- O’Connor MD, Kardel MD, Iosfina I, Youssef D, Lu M, et al. (2008) Alkaline phosphatase-positive colony formation is a sensitive, specific, and quantitative indicator of undifferentiated human embryonic stem cells. Stem Cells 26: 1109-1116.
- Nishiitsutsuji R, Nozaki T, Ohura K (2015) Gene expression profile of side population cells in human oral cell line SCC-4. J Osaka Dent Univ 49: 205-217.
- Livak KJ, Schmittgen TD (2001) Analysis of relative gene expression data using real-time quantitative PCR and the 2(-Delta C (T)) method. Methods 25: 402-408.
- Patrawala L, Calhoun T, Schneider-Broussard R, Zhou J, Claypool K, et al. (2005) Side population is enriched in tumorigenic, stem-like cancer cells, whereas ABCG2+ and ABCG2- cancer cells are similarly tumorigenic. Cancer Res 65: 6207-6219.
- De Los Angeles A, Loh YH, Tesar PJ, Daley GQ (2012) Accessing naïve human pluripotency. Curr Opin Genet Dev 22: 272-282.
- Niwa H, Ogawa K, Shimosato D, Adachi K (2009) A parallel circuit of LIF signalling pathways maintains pluripotency of mouse ES cells. Nature 460:118-122.
- Seo E, Basu-Roy U, Zavadil J, Basilico C, Mansukhani A (2011) Distinct functions of Sox2 control self-renewal and differentiation in the osteoblast lineage. Mol Cell Biol 31: 4593-4608.
- He Q, Liu Z, Zhao T, Zhao L, Zhou X, et al. (2015) Bmi1 drives stem-like properties and is associated with migration, invasion, and poor prognosis in tongue squamous cell carcinoma. Int J Biol Sci 11: 1-10.
- Habu N, Imanishi Y, Kameyama K, Shimoda M, Tokumaru Y, et al. (2015) Expression of Oct3/4 and Nanog in the head and neck squamous carcinoma cells and its clinical implications for delayed neck metastasis in stage I/II oral tongue squamous cell carcinoma. BMC Cancer 15: 730-733.
- Huang ZJ, You J, Luo WY, Chen BS, Feng QZ, et al. (2015) Reduced tumorigenicity and drug resistance through the downregulation of octamerbinding protein 4 and Nanog transcriptional factor expression in human breast stem cells. Mol Med Rep 11: 1647-1654.
- Adachi K, Nikaido I, Ohta H, Ohtsuka S, Ura H, et al. (2013) Contextdependent wiring of Sox2 regulatory networks for self-renewal of embryonic and trophoblast stem cells. Mol Cell 52: 380-392.
- Bu LL, Zhao ZL, Liu JF, Ma SR, Huang CF, et al. (2015) STAT3 blockade enhances the efficacy of conventional chemotherapeutic agents by eradicating head neck stemloid cancer cell. Oncotarget 6: 41944-41958.
- Andrews PW, Meyer LJ, Bednarz KL, Harris H (1984) Two monoclonal antibodies recognizing determinants on human embryonal carcinoma cells react specifically with the liver isozyme of human alkaline phosphatase. Hybridoma 3: 33-39.
- Pera MF, Reubinoff B, Trounson A (2000) Human embryonic stem cells. J Cell Sci 113: 5-10.
- Shamblott MJ, Axelman J, Wang S, Bugg EM, Littlefield JW, et al. (1998) Derivation of pluripotent stem cells from cultured human primordial germ cells. Proc Natl Acad Sci U S A 95: 13726-13731.