
Journal of Nutrition & Health
Download PDF
Research Article
*Address for Correspondence: Marcia Magnus Department of Dietetics & Nutrition, The Robert Stempel College of Public Health & Social Work, Florida International University, FL, USA, Tel: 305-348-1989; E-mail: magnus@fiu.edu
Citation: Magnus M, Ortegon J, Matamala A. Child Weight Perception among Miami Cuban American WIC Mothers. J Nutri Health. 2016;2(2): 7.
Copyright © 2016 Magnus et al. This is an open access article distributed under the Creative Commons Attribution License, which permits unrestricted use, distribution, and reproduction in any medium, provided the original work is properly cited.
Journal of Nutrition and Health | ISSN: 2469-4185 | Volume: 2, Issue: 2
Submission: 18 July, 2016 | Accepted: 03 October, 2016 | Published: 08 October, 2016
 Procedure
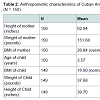
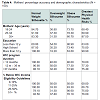
 While mean BMI of mothers was 26.84 ± 5.91 (overweight), mean BMI of children was 16.90 ± 2.55 (normal) (Table 2).
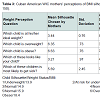
 Although only 35% of mothers accurately identified overweight status in children, 89% accurately identified children who were at their ideal body weight (Table 3).
 Child weight perception and marital status
Marital status and preference of child weight status
 Maternal preference for child weight status
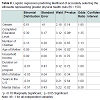
 There was a statistically significant difference at the p < 0.05 in BMI and weight status of the mother and the 3 groups, F(2,147) = 3.60, F(2,147) = 2.83, respectively. Post-hoc comparisons using the Tukey HSD test indicated that the weight of the mother and BMI of mother for the group that wanted their child to weigh more was significantly different from the group that wanted their child to weigh less. Mothers who weighed more (M = 177, SD = 64.51) preferred their children to weigh less. Mothers who wanted their child to weigh more had a lower weight (M = 141.75, SD = 22). Similarly, mothers who preferred that their children weigh less had a significantly higher BMI (M = 30.60, SD = 90.06, obese) compared to those mothers who preferred their child to weigh more (M = 25.40, SD = 3.40, borderline overweight).
Child Weight Perception among Miami Cuban American WIC Mothers
Marcia Magnus*, Jennifer Ortegon and Alejandra Matamala
- Department of Dietetics & Nutrition, The Robert Stempel College of Public Health & Social Work, Florida International University, FL, USA
*Address for Correspondence: Marcia Magnus Department of Dietetics & Nutrition, The Robert Stempel College of Public Health & Social Work, Florida International University, FL, USA, Tel: 305-348-1989; E-mail: magnus@fiu.edu
Citation: Magnus M, Ortegon J, Matamala A. Child Weight Perception among Miami Cuban American WIC Mothers. J Nutri Health. 2016;2(2): 7.
Copyright © 2016 Magnus et al. This is an open access article distributed under the Creative Commons Attribution License, which permits unrestricted use, distribution, and reproduction in any medium, provided the original work is properly cited.
Journal of Nutrition and Health | ISSN: 2469-4185 | Volume: 2, Issue: 2
Submission: 18 July, 2016 | Accepted: 03 October, 2016 | Published: 08 October, 2016
Abstract
Objective: To assess maternal perception of child weight status and factors associated with perception of child weight status, and satisfaction of child’s weight among WIC mothers who are of Cuban descent by using child figure silhouettes.Methods: A cross-sectional design was used to assess weight perception. A convenience sample of 150 WIC mothers in Miami-Dade County were interviewed using child silhouettes. Height and weight of mothers were measured and demographics were extracted from their WIC chart. Children’ weight and height were extracted from WIC charts. Data were collected for a 12-month period.
Results: Students’ t-tests, cross tabulations, correlations, and logistic regression revealed that on average, mothers perceived their children’ BMI to be about two points lower than actual BMI. As the age and education level of the mother increased, the higher the likelihood that she correctly identified the silhouette that represented the child of weight status with the greatest risk for health problems. WIC mothers were 22 times more likely to accurately select a normal female silhouette. Furthermore, 82.6% of mothers with overweight children were satisfied with their children’s’ weight. Mothers who preferred their children to weigh less had a significantly higher weight and BMI than mothers who wanted their child to weigh more.
Implications: Public health and nutrition professionals need to identify culturally sensitive strategies that help WIC mothers to overcome the barrier of weight misperception among WIC mothers.
Introduction
The tripling of childhood obesity rates among America’s preschool children and the disproportionately higher obesity among Non-White children [1], has led to numerous assessment of maternal perception of child’s weight status [2-10] especially since adult obesity rates continue to increase along with pediatric rates [11].In Miami, Florida unlike the rest of the country, the Hispanic population is 50.4% Cuban American and 2.9% Mexican American [12]. In Miami, Florida the Cuban population compromises 50.4% of the population making it the largest sub-group of Hispanics within the city [12]. Only 15.6% of Cubans residing in the U.S live below the poverty level and their average family size is 3.24 compared to Mexicans (26.3% poverty level, 4.07 family size), Puerto Ricans (19.8% poverty level, 3.43 family size), and all other Hispanic (18.9% poverty level, 3.66 family size) [13].
Among Non-Whites, weight perception has been documented among mostly Mexican American and African-American populations [4,6,8-10]. Among 192 non-pregnant mothers of Texas Head Start children, 49% of the mothers perceived their child to be thinner than their actual body mass index size [14]. Among German mothers, 58.1% accurately recognized overweight status in child figure silhouettes, but 79.8% of mothers with overweight children failed to recognize overweight status in their own children [5]. Approximately 79% of 344 multiracial WIC Kentucky mothers failed to describe their overweight children as overweight [6], and low education was identified as the primary reason behind misperception [6]. However, among 38 mostly Mexican-American Southern Nevada WIC mothers, maternal perception of their child’s weight was independent of educational level [8]. When Hackie and Bowels replicated the Myers and Vargas study with 38 mostly Cuban and Puerto Rican population in a Southern Nevada WIC program, 61% of mothers did not recognize their children as being overweight [8]. Approximately 35% of 200 Hispanic parents of obese children at a Virginia WIC clinic did not perceive that their child was obese, and 45% of parents mistakenly indicated that their obese child’s weight was “fine” [9]. Another study showed that only 10% of 60 California mothers and 82% of 314 Mexican mothers accurately choose the silhouette that represented their children’ weight status [10].
Maternal obesity [2,3], mothers’ educational level [4-6], dietary acculturation--the process that occurs when an immigrant adopts new dietary practices in their new environment [7] may increase a child’s risk for developing obesity. Higher fruit and vegetable consumption has been reported among non-US born Latinos than US-born Latinos [15], less acculturated Hispanics versus more acculturated [16]; along with more sugary fluids among more acculturated Hispanics compared to less acculturated [17-19]. Popkin and Udry found that Hispanic adolescents born in the U.S. (Mexican, Cuban, Puerto Rican, Central/South American, and other Hispanics), are more than twice as likely to be obese as are first-generation residents of the 50 states [14].
Since studies have used different methods to better understand maternal perception of child’s weight among Mexican American, African American, and non-Hispanic White mothers, this study assessed child weight perception among Cuban American WIC women in Miami. The hypotheses under investigation include:
1) Misperception of child weight status will be greater among Cuban American WIC mothers of lower income versus (higher income), lower education, who have lived in the US for more than five years, mothers who are overweight and obese (versus ideal weight mothers), their own children (versus the silhouette of an unknown child), girls (versus boys).
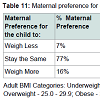
2) Compared to mothers who are underweight, mothers who are at normal weight, at risk of overweight, and overweight children will report a stronger preference for their child to be heavier.
Methods
SampleA convenience sample of mothers of Cuban descent was derived from Women, Infants, and Children program (WIC) clinics throughout Miami-Dade County. The WIC program serves low income pregnant, postpartum, and breastfeeding women, infants, and children up to age 5. Participants were mothers with children ages 3-5 years old. Exclusion criteria included: participants under the age of 18 and caregivers who are not mothers. Sample size calculations indicate that a minimum of 54 mothers in this ethnic group are required to determine statistical significance for a medium effect size (d = 0.5), p < 0.05 with 80% power for a paired samples t-test. To determine significance for a 3 x 3 cross tabulation of satisfaction of child’s weight by weight status using p < 0.05, 80% power and an effect size (w = 0.2) samples sizes of n = 299 for the ethnic group are required. A medium effect size of (w = 0.5), sample sizes of n = 133 for the ethnic group are required. Therefore 150 WIC Cuban American mothers were recruited.
Instrument
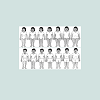
Killion et al. developed and tested pictorial child silhouettes that represent Hispanic boys and girls and were adopted for this study. To test the reliability of the child silhouettes, several interviews with Hispanic and African-American parents were conducted to make sure the child silhouettes were appropriate in ethnicity, age and size [3]. Based on the feedback from the parents, the silhouettes were then adjusted to better reflect the 4-5 year old children. To estimate BMI for each child silhouette, two experts in body composition and young children’s growth were used and compared results utilizing Pearson’s correlation. The two ratings were highly correlated (r = 0.96; p < 0.001). Seven questions used by Warschburger, Kroller and Killion et al. and Rosas et al. will be modified and used to determine mothers’ perceptions of child weight status. These questions will include mother’s perception of child figure silhouettes that best represent their child, ideal weight, overweight, physical health risks, and satisfaction of their child’s body size. The instrument was translated and back translated into Spanish to better serve this population. Figure 1 presents the child figure silhouettes by Killion et al. Appendix 1 presents the modified questions which were used in this study.
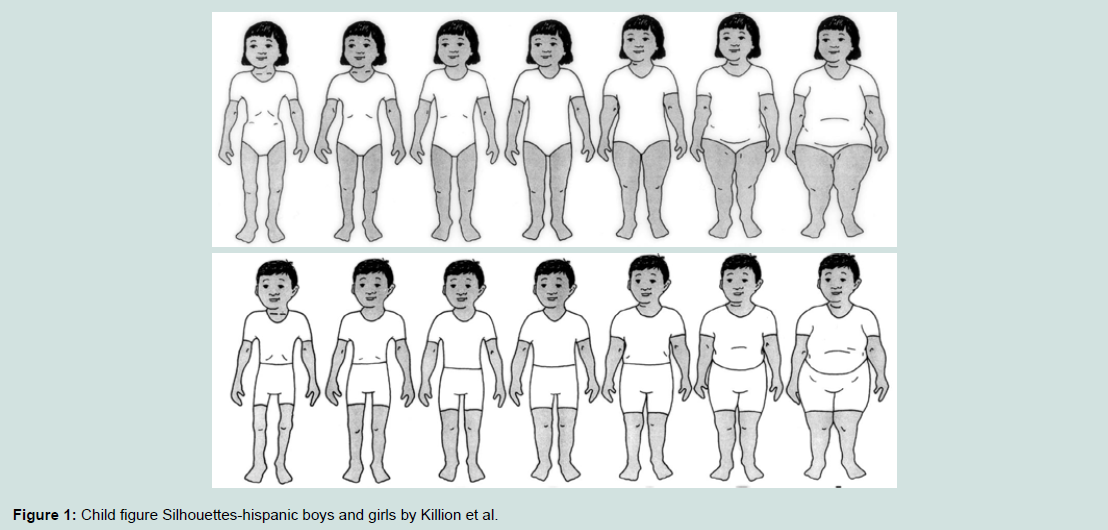
Figure 1: Child figure Silhouettes-hispanic boys and girls by Killion et al.
Prior to data collection, application was made to the Institutional Review Boards of Florida International University, Miami-Dade Health Department, and Florida State Health Department. Based on the Miami-Dade WIC ethnicity report, the top three clinics with the highest percentages of Cuban population were selected for interviews. Participants were asked to complete the survey and were invited to sign the consent form by the interviewer. Height and weight of mothers were measured with the existing WIC wall chart (The Standard Stadiometer, Prospective Enterprises, Portagem, MI) and electronic scale (BW B800S Doctors scale, Tanita Corp of America, Alrington Heights, IL). Participants were weighed by the interviewer in a secluded area to ensure privacy. Child height and weight data were extracted from the WIC chart by the interviewer. Mothers’ age, ethnicity, educational level, marital status, household size, and income level were obtained from the WIC chart. Demographic questions on mothers’ ethnic origin and number of years in the United States were added to the questionnaire by the interviewer.
WIC mothers were approached by the interviewer while they were waiting. Mothers were asked by the interviewer about their willingness to participate in the survey. Only one of 150 respondents declined to participate.
Statistical analysis
Data collected from the WIC clients were analyzed using descriptive and inferential testing. Cross tabulations were used to assess the association between socioeconomic and demographic variables and accuracy of weight child perception. A Chi-square test was used to test for significance between marital status and accuracy in identifying the normal, overweight, obese silhouette. A pairedsamples t-test was conducted to compare accuracy of maternal perception and actual of child weight status. A Pearson correlation coefficient was determined for the age of the mother and accuracy in identifying the normal silhouette. Logistic regression was used to assess the relationship between several demographic factors and accuracy of identifying an ideal weight silhouette. A one-way analysis of variance was conducted to explore differences in child BMI across different maternal preferences for weight status, and to examine differences in demographic factors across maternal preferences for weight status. Statistical Packages for the Social Sciences (SPSS) v.24.0, 2015 (Chicago, IL, USA) was used to analyze the data.
Results
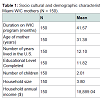
Weight perception was assessed among 150 Cuban American WIC mothers whose children were between 3 and 5 years of age. Thirtyone percent of WIC mothers were not married and approximately 50% of the children were boys.The average age of mother was 31.38 ± 6.07 years and had lived in the US for 12.10 ± 9.21 years (Table 1). Mothers’ average number of years of education was 11.82 ± 1.48. Mean duration on the WIC program was 41.57 ± 13.90 months. In the average household, annual income was $18,889.04 ± 14,388.68, with an average household size of 3.80 ± 1.01, with 2.01 children.
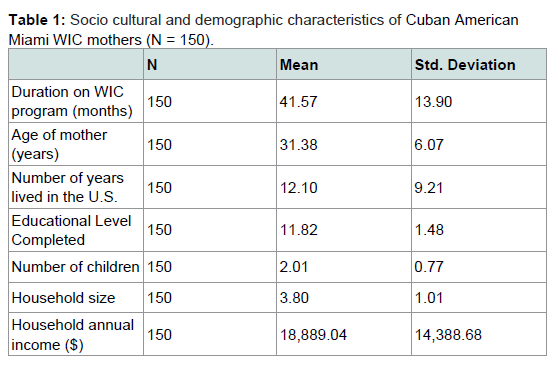
Table 1: Socio cultural and demographic characteristics of Cuban American Miami WIC mothers (N = 150).
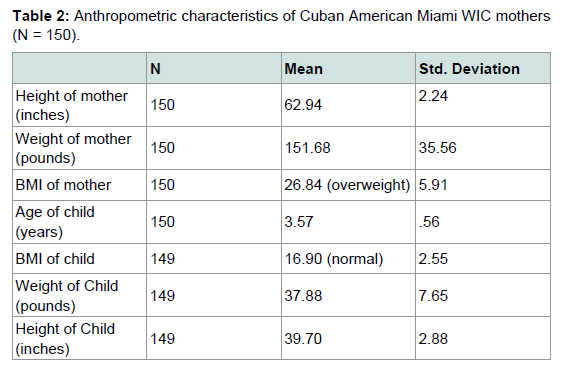
Table 2: Anthropometric characteristics of Cuban American Miami WIC mothers (N = 150).
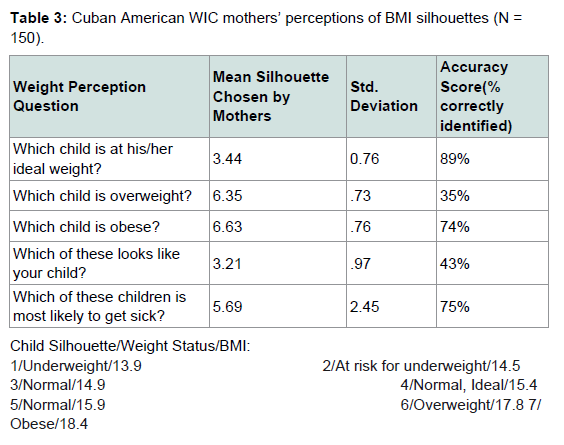
Table 3: Cuban American WIC mothers’ perceptions of BMI silhouettes (N = 150). Summary of protein levels following the addition of RI.
There was no significant association between marital status and accuracy in identifying the normal, overweight, obese silhouette. However, there was marginal significance between marital status and accuracy in identifying and the silhouette that represented the most health risks, X2 (1, n = 150) = 3.24, p = 0.57, (p < 0.10). Eighty percent of single mothers and 66% of married mothers accurately identified the silhouette that represented the most health risks. There was a significant association between gender of child and accuracy in identifying the normal and obese silhouette, X2 (1, n = 150) = 13.71, p = 0.00, (p < 0.5), X2 (1, n = 150) = 4.20, p = 0.03, (p < 0.5), respectively. Mothers accurately identified normal (98.7%) and obese (81.3%) girls, but only 80% of normal and 66.7% obese boys. There were no significant differences in gender of child and accuracy in identifying the overweight silhouette and the silhouette that represented greater physical health risks.
Child weight perception and age of mother
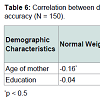
The Pearson correlation coefficient between age of the mother and accuracy in identifying the normal silhouette was weak and negative, r = -0.16, p < 0.05. As age of the mother increased, accuracy detecting the normal silhouette decreased. There was a weak positive correlation between age of the mother and education (r = 0.18, p < 0.05) and likelihood that she would select the silhouette that represents the greatest risk for health problems, (r = 0.18 p < 0.05). As the age and education level of the mother increased, the higher the likelihood that she correctly identified the silhouette that best represents the child of weight status with the greatest risk for health problems.
Child weight perception and child weight status
A paired-samples t-test was conducted to compare accuracy of maternal perception and actual of child weight status. There was a statistically significant difference in perceived BMI (M = 15.04, SD = 0.50) when compared to actual BMI (M = 16.90, SD = 2.55); t(148) = 9.81, p < 0.05 (two-tailed). Mothers perceived their children’ BMI to be about two points lower than actual BMI. A two-point variation along the BMI continuum could represent the difference between being classified as overweight and obese or on the other end between being underweight and normal.
Accuracy of ideal weight silhouette and demographic factors
Direct logistic regression was performed to assess the relationship between several demographic factors and accuracy of identifying an ideal weight silhouette. The model contained nine independent variables. The full model containing all predictors was statistically significant, X2 (9, N = 150) = 27.62, p < 0.05, indicating that the model was able to distinguish between respondents who correctly identified the ideal silhouette and those who did not. The model as a whole explained between 17% (Cox and Snell R square) and 34% (Nagelkerke R squared) of the variance in accuracy, and correctly classified 90% of normal. As shown in Table above, the strongest predictor for accurately identifying the normal silhouette was gender of child recording an odds ratio of 21.94. Cuban American WIC mothers were 22 times more likely to accurately select the normal silhouette if the child was female, controlling for all other factors.
Accuracy of most unhealthy silhouette and age of mother
The strongest predictor for accurately identifying the silhouette that represented the most physical health risks was age of the mother recording an odds ratio of 1.09 (Tables 4-8). This indicated the mothers who were older were slightly likely to accurately select the silhouette that represented the most health risks controlling for all other factors. The odds ratio increases as the age increment increases. For example, a mother who is 30 years old was two times more likely to accurately select the silhouette that represented the most health risks than a mother who was 20 years old. Additionally, mothers were almost half as likely to choose the correct silhouette if they were married (p < 0.5). None of the other variables were significant. There were no significant predictors for mothers’ identification of the overweight or obese silhouette.
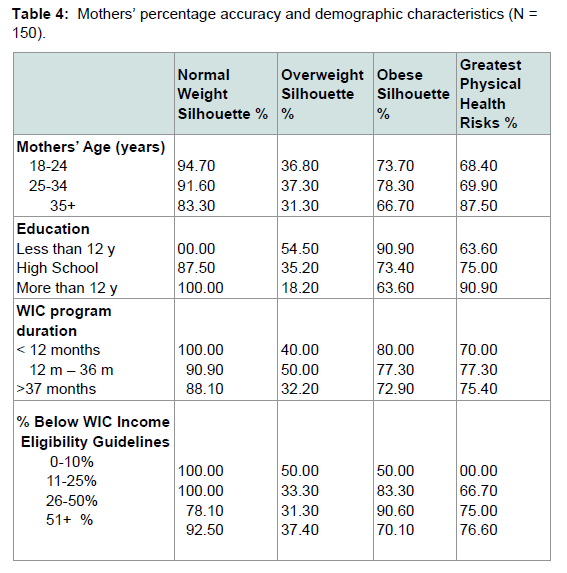
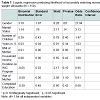
Table 4: Mothers’ percentage accuracy and demographic characteristics (N =150).
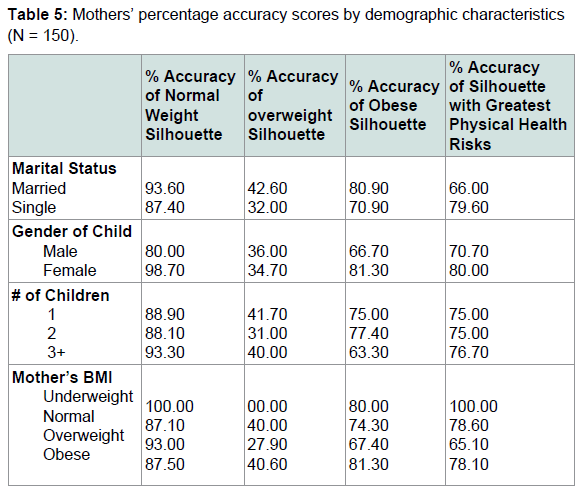
Table 5: Mothers’ percentage accuracy scores by demographic characteristics (N = 150).
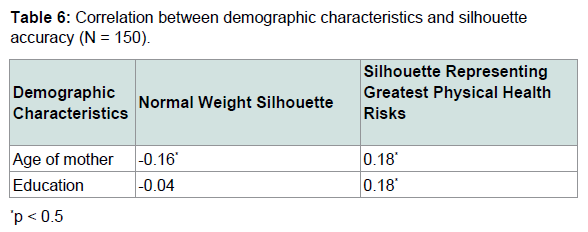
Table 6: Correlation between demographic characteristics and silhouetteaccuracy (N = 150).
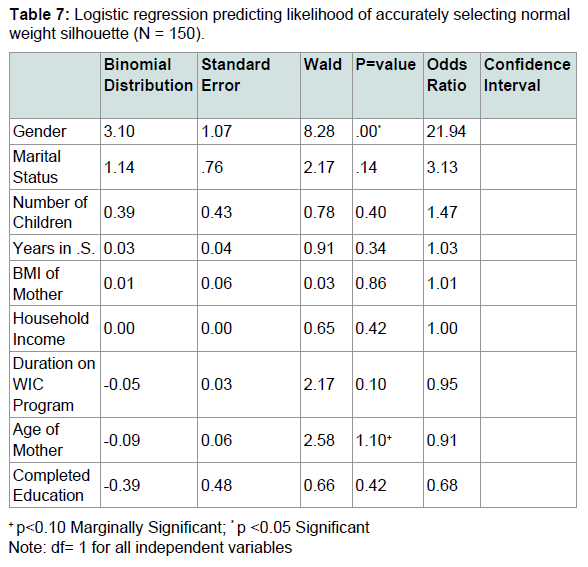
Table 7: Logistic regression predicting likelihood of accurately selecting normal weight silhouette (N = 150).
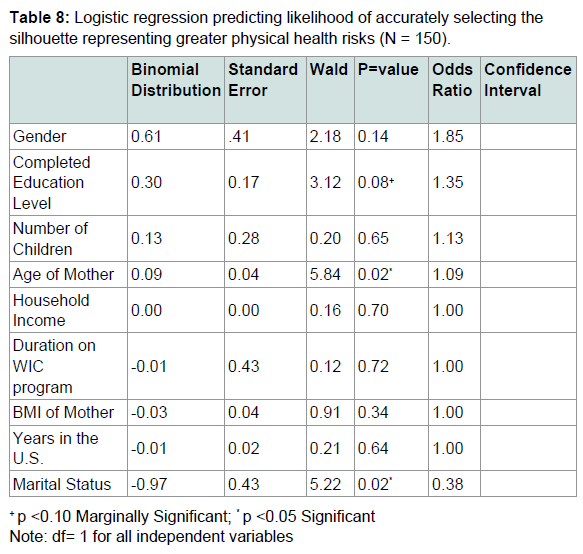
Table 8: Logistic regression predicting likelihood of accurately selecting the silhouette representing greater physical health risks (N = 150).
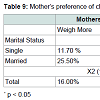
Mothers’ marital status was significantly associated with preference of child weight status. Mothers who were single were significantly more likely to want their children to maintain their weight (83.50%) compared 63.80% of mothers who were married. Married mothers (25.50%) were two times more likely to express a desire for their children to weigh more than single mothers X2 (1, n = 150) = 7.12 p < 0.05.
Preference of child weight status and marital status
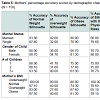
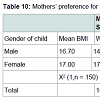
A Chi-square for independence indicated significant association between marital status and preference of child weight status X2 (1, n = 150) = 7.12, p = 0.3 (p < 0.5). The majority of single and married mothers wanted their children to maintain their weight (77.30%). There was no significant association between gender of child and preference of child weight status. The majority of women with both girls and boys wanted their children to maintain their weight (75% and 80%, respectively). Among the 77.30% of mothers who wanted their children to maintain their weight, the mean BMI of boys and girls was normal (16.7, 17.0, respectively). This indicates the children were in a normal weight range and the mother was satisfied with their weight status. However, 17% of mothers wanted their daughters who had a mean BMI of 16.3 (normal) to weigh more. This indicates mothers with daughters who were at normal weight, wanted them to weigh more (Table 9).
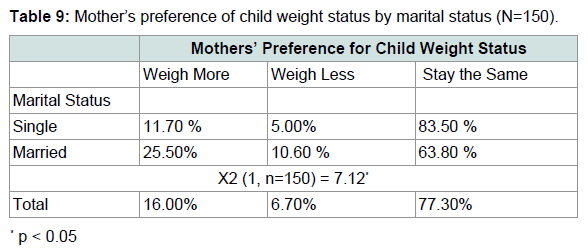
Table 9: Mother’s preference of child weight status by marital status (N=150).
Mothers were divided into three groups according to their preference for their child’s weight status (Group 1: prefer child to weigh less, Group 2: prefer child stay the same, Group 3: prefer child to weigh more). There was a statistically significant difference in BMI for the three groups F (2,146) = 10.81, P < 0.05. Post-hoc comparisons using the Tukey HSD test indicated that the mean BMI for Group 1 (preference to weigh less) (M = 19.85 (obese children), SD = 4.51) was significantly higher than Group 2 (preference for weight to stay the same) (M = 16.90 (normal weight children), SD = 2.02) and Group 3 (preference to weigh more) (M = 15.67 (normal weight children), SD = 2.86). Mothers who preferred their child’s weight to stay the same had children whose mean BMI was considered normal. Mothers who preferred their child to weigh more had children whose mean BMI was also considered normal, and mothers who wanted their child to weigh less had children who mean BMI was considered obese. Mothers who wanted their child to weigh less had children with significantly higher BMIs than those mothers who wanted their child to weigh more or weigh less (Tables 10 and 11).
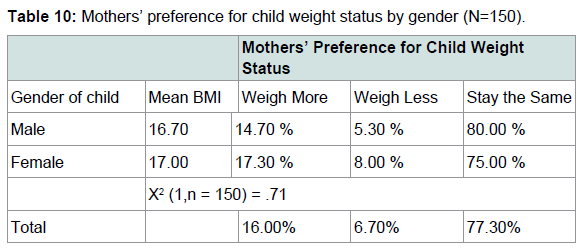
Table 10: Mothers’ preference for child weight status by gender (N=150).
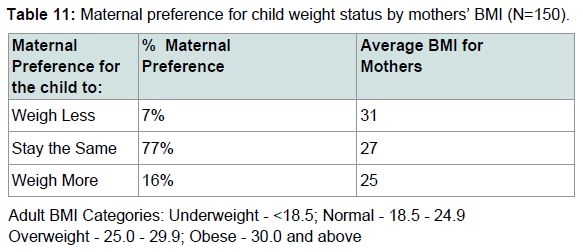
Table 11: Maternal preference for child weight status by mothers’ BMI (N=150).
Discussion
This study has several limitations. The results cannot be generalized to the entire Cuban American population living in the US since a convenience sample of Cuban American WIC participants was derived. Recruitment took place at WIC clinics throughout Miami-Dade County. Since the WIC program primarily serves a low-income population, this excludes Cuban Americans who are not on the WIC program. The survey was conducted in English and in Spanish because the majority of Cubans living in Miami prefer Spanish. Although the survey was translated and back translated, misinterpretation of the questions is always of risk when administered in different languages. Furthermore, child figure silhouettes are not an accurate representation of actual children. Although it gives the investigator a better idea of what the mothers perceive, it is only a tool to measure maternal perception.
The limitations do not represent major threats to the value of this study. The study’s strengths are represented in its major findings which outweigh the limitations. The rate of child weight perception among Cuban American Miami WIC has been quantified at 57% and this facilitates comparison with other population groups. The hypothesis was confirmed in this study that in general, 57% of Cuban American WIC mothers perceived their children to be thinner than their actual size, in support of previous studies showing that other Hispanic mothers underestimate the weight status of their children. Child weight misperception averaged 90% among Mexican American mothers in California [10]; 79% among overweight children among non-Whites and Blacks [9]; 61% of Cuban and Puerto Rican mothers that did not recognize their children as being overweight [8]; 49% among African American mothers [4]; and 35% among Hispanic parents of obese children [6].
Mothers were 21 times more likely to accurately identify a normal silhouette if they had a girl. The hypothesis that mothers of all weight statuses will want their child to weigh more was not supported by the findings. One surprising finding was that as mothers’ body mass index increased, they were less likely to prefer their children to be heavier. Future research may need to explore the factors which are associated with this preference. Obese WIC Cuban American mothers may be more aware to the health risks associated with obesity and prefer their obese children to weigh less. However, 77% of mothers with overweight and obese children were satisfied with their child’s weight. This is of particular concern because mothers may choose not to believe that their child is at an unhealthy weight status. This is supported by other studies which have theorized that parents may feel the need to be considered a ‘good parent’ and this could be acting to distort the reality of their perception [20] or it could be directly related to culture.
Mothers who preferred their children to weigh more had children with a normal BMI. Mothers who wanted their children to weigh less tended to have obese children. When both mother and child were obese, mothers were more likely to accurately recognize their child’s weight status and the consequences of a larger body size. Twenty one percent of mothers with obese children preferred their child to weigh less. However no mothers of overweight children wanted their child to weigh less, confirming Killion et al. findings with African American mothers [4].
An unexpected finding in this study was that only 48% of mothers were able to distinguish the difference between the overweight and obese silhouette. Furthermore, when mothers were asked to identify the obese silhouette, 23% of mothers chose a smaller silhouette. Approximately 29% of mothers accurately chose the obese silhouette when asked to distinguish between the overweight and obese silhouette. While many mothers were able to correctly identify the overweight silhouette, it is of major concern that 51% were not able to distinguish between the terminology “overweight” and “obese”.
Mothers’ perceptions of children’s body size could have an impact on the lifestyle habits which they promote among their children. Public health and nutrition professionals need to identify culturally sensitive strategies which help WIC mothers to overcome the barrier of weight misperception among WIC mothers. If a mother does not perceive her overweight child to be too heavy, providing nutrition education will be meaningless if she feels her child does not have a health risk. Furthermore, the terminology between overweight and obese must be communicated to parents so that the severity of the obesity problem is understood. This becomes of importance in public health since the term “obesity” is used very widely. Programs, such as Women Infants and Children, should take more initiative to relay this type of information since there is an opportunity to educate mothers.
References
- Ogden C, Carrol M (2010) Prevalence of obesity among children and adolescents: United States Trends 1963-1965 through 2007-2008. National Center for Health Statistics.
- Kral TV, Rauh EM (2010) Eating behaviors of children in the context of their family environment. Physiol Behav 100: 567-573.
- Wang Y, Beydoun MA (2007) The obesity epidemic in the United States--gender, age, socioeconomic, racial/ethnic, and geographic characteristics: a systematic review and meta-regression analysis. Epidemiol Rev 29: 6-28.
- Killion L, Hughes SO, Wendt JC, Pease D, Nicklas TA (2006) Minority mothers’ perceptions of children’s body size. Int J Pediatr Obes 1: 96-102.
- Warschburger P, Kroller K (2009) Maternal perception of weight status and health risks associated with obesity in children. Pediatrics 124: e60-e68.
- Baughcum AE, Chamberlin LA, Deeks CM, Powers SW, Whitaker RC (2000) Maternal perceptions of overweight preschool children. Pediatrics 106: 1380-1386.
- Satia-Abouta J (2003) Dietary acculturation: definition, process, assessment, and implications. Int J Hum Ecol 4: 71-86.
- Hackie M, Bowles CL (2007) Maternal perception of their overweight children. Public Health Nurs 24: 538-546.
- Myers S, Vargas Z (2000) Parental perception of the preschool obese child. Pediatr Nurs 26: 23-30.
- Rosas LG, Harley KG, Guendelman S, Fernald LC, Mejia F, et al. (2010) Maternal perception of child weight among Mexicans in California and Mexico. Matern Child Health J 14: 886-894.
- CDC (2011) Adult obesity facts. Center for Disease Control and Prevention.
- (2016) Comprehensive Assessment for Tracking Community Health for Hispanic Population of Miami-Dade County. Miami-Dade Health Department Web site.
- United State Census Bureau Selected Characteristics of the Cuban-American Population (1990) U.S. Census, 2000 Current Population Survey and 2000 U.S. Census.
- Popkin BM, Udry JR (1998) Adolescent obesity increases significantly in second and third generation U.S. immigrants: the National Longitudinal Study of Adolescent Health. J Nutr 128: 701-706.
- Sharma S, Murphy SP, Wilkens LR, Shen L, Hankin JH, et al. (2004) Adherence to the food guide pyramid recommendations among African Americans and Latinos: results from the Multiethnic Cohort. J Am Diet Assoc 104: 1873-1877.
- Neuhouser ML, Thompson B, Coronado GD, Solomon CC (2004) Higher fat intake and lower fruit and vegetables intakes are associated with greater acculturation among Mexicans living in Washington State. J Am Diet Assoc 104: 51-57.
- Cullen KW, Ash DM, Warneke C, de Moor C (2004) Intake of soft drinks, fruit-flavored beverages, and fruits and vegetables by children in grades 4 through 6. Am J Public Health 92: 1475-1478.18.
- Himmelgreen DA, Bretnall A, Perez-Escamilla R, Peng Y, Bermudez A (2005) Birth place, length of time in the U.S., and language are associated with diet among inner-city Puerto Rican women keywords. Ecol Food Nutr 44: 105-122.
- Bermudez OI, Falcon LM, Tucker KL (2000) Intake of food sources of macronutrients among older Hispanic adults: association with ethnicity, acculturation, and length of residence in the United States. J Am Diet Assoc 100: 665-673.
- Straus M (1964) Measuring families. In: Christensen H (Ed). Hand book of marriage and the family. Rand McNally, Chicago, USA.