
Journal of Nutrition & Health
Download PDF
Research article
*Address for Correspondence: Maria Gisele dos Santos, Department of Physical Education, Federal University of Paraná, Curitiba - PR, Brazil, E-mail: mariagisele@yahoo.com
Citation: Salgueirosa FdM, Santos MGd, Kreider R. Influence of Insulin Resistance on the Balance between Carbohydrate and Fat Utilization at Rest and in progressive Intensity Exercise. J Nutri Health. 2016;2(1): 5.
Copyright © 2016 Salgueirosa FDM. This is an open access article distributed under the Creative Commons Attribution License, which permits unrestricted use, distribution, and reproduction in any medium, provided the original work is properly cited.
Journal of Nutrition and Health | ISSN: 2469-4185 | Volume: 2, Issue: 1
Submission: 14 April, 2016 | Accepted: 26 April, 2016 | Published: 02 May, 2016
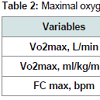
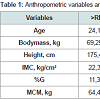 Table 2 shows the maximum oxygen consumption (VO2 max), where no significant difference was observed both in relative consumption (ml/kg/min) as in the absolute consumption (L/min), showing that both groups met with similar levels of cardiorespiratory fitness.
 The >RI group showed a significantly higher concentration of insulin than the < RI group, which reflected a significantly higher level of insulin resistance (Table 3).
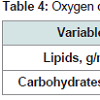
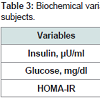 No differences concerning glucose concentrations (Table 3) were observed, demonstrating that both groups showed similar glucose tolerance, differing only in insulin resistance. Still, about glucose, all participants had concentrations within the normal range (>110) according to the Brazilian Diabetes Society [17].Table 4 shows the results of the analysis at rest. No significant differences were observed concerning the total oxidation of lipids and carbohydrates.
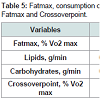
 No significant differences were observed in the total oxidation of lipids and carbohydrates at the intensity corresponding to Fatmax (Table 5). Furthermore, no significant correlation was observed among insulin resistance and total oxidation of lipids and carbohydrates and rest and exercise.
Influence of Insulin Resistance on the Balance between Carbohydrate and Fat Utilization at Rest and in progressive Intensity Exercise
Fabiano de Macedo Salgueirosa, Maria Gisele dos Santos* and Richard Kreider
- Department of Physical Education, Federal University of Paraná, Curitiba - PR, Brazil
*Address for Correspondence: Maria Gisele dos Santos, Department of Physical Education, Federal University of Paraná, Curitiba - PR, Brazil, E-mail: mariagisele@yahoo.com
Citation: Salgueirosa FdM, Santos MGd, Kreider R. Influence of Insulin Resistance on the Balance between Carbohydrate and Fat Utilization at Rest and in progressive Intensity Exercise. J Nutri Health. 2016;2(1): 5.
Copyright © 2016 Salgueirosa FDM. This is an open access article distributed under the Creative Commons Attribution License, which permits unrestricted use, distribution, and reproduction in any medium, provided the original work is properly cited.
Journal of Nutrition and Health | ISSN: 2469-4185 | Volume: 2, Issue: 1
Submission: 14 April, 2016 | Accepted: 26 April, 2016 | Published: 02 May, 2016
Abstract
Purpose: Analyze the influence of insulin resistance on the balance between carbohydrate and fat utilization at rest and in progressive intensity exercise.Methods: Twelve sedentary male subjects were divided into two groups (>RI and < RI) according with their insulin resistance index (HOMA-IR). Using indirect calorimetry were analyzed: carbohydrate and fat utilization at rest, the crossover point, the exercise intensity that elicits a maximal fat oxidation (Fatmax), carbohydrate and fat utilization at Fatmax. All variables were compared using the MANNWHITNEY test.
Results: There were no significant differences between the group in Fatmax (37,35±7,99 vs. 39,81±3,84%VO2 max) and the Crossover point (40,08±7,19 vs. 40,67±5,12%VO2 máx). Also had not been observed any significant difference in the substrate balance at rest (0,095±0,009 vs. 0,069±0,028 g/min, 0,244±0,082 vs. 0,250±0,073 g/ min, fat and carbohydrate, respectively) and at Fatmax (0,397±0,087 vs. 0,230±0,076 g/min, 0,689±0,229 vs. 0,867±0,222 g/min, fat and carbohydrate, respectively).
Conclusions: Insulin resistance did not influence the Crossover point and the Fatmax, as well as the substrate balance at rest and at Fatmax.
Keywords
Insulin resistance; Fat; Carbohydrates; ExerciseIntroduction
Diabetes Mellitus (DM) is touted today as one of the greatest problems concerning public health. It is estimated that in 2030 approximately 366 million people will be suffering from some form of DM [1]. Diabetes mellitus type 2 (DM2) is caused primarily by insulin resistance, defined as “medical condition in which it is observed a normal or elevated concentrations of insulin that produces an attenuated biological response [2].Prior to the onset of the symptoms of diabetes type 2, despite insulin resistance being observed for years before, an increase in insulin secretion occurred, or even compensatory hyperinsulinemia, maintaining normal glucose levels until occurring dysfunction in beta-cells and inability to control blood glucose levels, and thus leads to the diagnosis of DM2 [3].
Different researchers have observed that subjects with insulin resistance show changes in their energy metabolism, as in a study conducted with overweight women where the group of insulin resistant oxidized less carbohydrates than the control group [4]. In another study [5] in obese subjects with DM2, was observed a reduced oxidation of plasma fatty acids, but no differences in the total fat and carbohydrate oxidation, compared to the control group. When not obese DM2 patients were analyzed it was not found any alteration in fat oxidation or carbohydrates [6]. In the last two studies cited above should be observed that the subjects were patients DM2, therefore hyperglycemic.
In many studies that measured the balance of substrate in subjects with insulin resistance, diabetes and obesity, it is a common feature the use of a fixed percentage of maximum VO2 for intensity-control. However studies have shown significant inter-individual differences in the use of lipids during exercise, as in the study by Achten et al. where was found that cyclists reached the maximum rate of lipid oxidation (Fatmax) at intensities ranging from 42 to 84% (64±4%) of maximum VO2 [7].
Achten and Jeukendrup measured the Fatmax in triathletes and cyclists and linked them with plasma lactate. The Fatmax intensity was found at 63±9% and the lactate threshold at 61±5%, with no significant differences between them [8].
Considering the results, we can speculate the possibility of Fatmax occurring at different intensities in people with insulin resistance, but the absolute oxidation of fats and carbohydrates is not different in people sensitive to insulin, when exercise intensity is controlled by Fatmax or anaerobic threshold.
Some studies provide support for this hypothesis [9] observing that the crossover point (the point where the relative contribution of carbohydrate metabolism exceeds the fats in energy production) occurs at significantly lower intensities in overweight individuals when compared to subjects with a normal weight, and also Fatmax occurs at significantly lower intensities.
This study aims to analyze the influence of insulin resistance on lipid and carbohydrate utilization at rest and in continuous exercise with progressive intensity.
Methods
This study protocol was approved by the Human Research Ethics Committee of the Department of Health Sciences, Federal University of Paraná (UFPR). Before performing any procedure related to the study was obtained the Instrument of Consent from all the study subjects.This study evaluated 12 male subjects, volunteers, aged 20 to 30 years, divided into 2 groups: >IR (n=6), formed by subjects with higher insulin resistance; and < IR (n=6), formed by subjects with a lower insulin resistance.
The inclusion criterion established was that individuals should have a BMI less than or equal to 25 kg/m2 and be classified as sedentary, i.e. in other words, those who did not comply with the conditions recommended by the US Department of Health and Human Services consisting in 30 minutes of physical activity most days of the week [10]. The following subjects will be excluded from the study: the ones presenting diabetes, coronary heart disease, hypertension, peripheral vascular disease, infections or other possible health problems, or using any continuous medication.
The subjects performed under protocol for the measurement of substrate utilization at rest. Immediately after the collection at rest, it was applied the protocol for measuring substrate uptake during the exercise. That same day was performed measurements of anthropometric variables and body composition [11-14] and the completion of the procedures.
Another day (with a maximum interval of 10 days of the first session) was collected blood samplings to determine the level of insulin resistance (HOMA).
The sessions took place at the same time of the day (between 8:00 a.m. and 10:00 a.m.) in order to avoid possible circadian variations with a period of fasting from 8 to 12 hours before the experimental protocols, to avoid possible influences from the food.
The supervision of a doctor was present during all the procedures.
Indirect calorimetry was used for the analysis of substrate utilization in different protocols (Fatmax, Substrate balance at rest, substrate balance in exercise and crossover point).
The calculation of the oxidation rate of lipid and carbohydrate was carried out from measurements of gaseous exchange through each breath, according to the not protein respiratory quotient [15].
The balance of the resting substrate was measured with the subject lying for 30 minutes from which were collected gases. For the purposes of calculations was used the average amount of the last 10 minutes.
For measurement of Fatmax and VO2 max it was used a modification of the protocol proposed by Achten et al. [16]. The test was performed on a treadmill (Reebok, model X-Fit 7) and started at 5 km/h with a slope of 1%, where the slope was increased by 2% every 3 minutes until reaching a respiratory quotient of 1.0. The consumption of carbohydrates and lipids was calculated by averaging the measurements of VO2 and VCO2 in the last two minutes of each stage and plotted in relation to the percentage of maximal oxygen consumption. The intensity at which the largest absolute intake of fat was observed was considered as the intensity of Fatmax. The heart rate of each participant was simultaneously measured throughout the test with a frequency of Polar brand, model S610.
To determine the crossover point, the relative contribution (%) of fat and carbohydrates were plotted during the exercise protocol in relation to the intensity of the exercise. We considered crossover point that point where the intensity contribution of fat and carbohydrates proved to be identical (50%).
Biochemical analyzes were performed at the Department of Clinical Analysis in the Clinical Hospital of the Federal University of Paraná.
The concentration of circulating glucose was analyzed by glucose hexokinase II (H II GLUT) method by Kit Glucose Hexokinase II and reactive ADVIA 1650 (Bayer).
Insulin was determined by immunometric immunoassay method, using the IMMULITE 2000 equipment where the necessary reagents for chemiluminescence reaction are permanently packed under refrigeration inside the machine.
For all comparisons between the groups (>RI and < RI) was used the non-parametric Mann-Whitney test, and Spearman correlation test was used to test the relationship between insulin resistance and the use of lipids and carbohydrates during rest and exercise.
For all analyzes was established the significance level of p< 0.05. Statistica 6.0 software was used for data analysis and Graph Pad Prism 4.0 software for the construction of graphs.
Results
Table 1 shows the anthropometric and body composition characteristics of the study subjects. No significant differences in age, weight, height, BMI, BF% and LBM were observed between the groups >RI and < RI.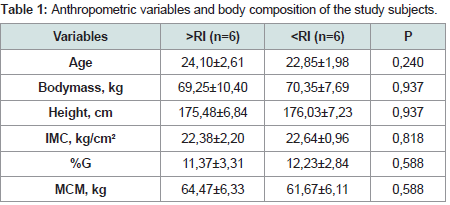
Table 1: Anthropometric variables and body composition of the study subjects.
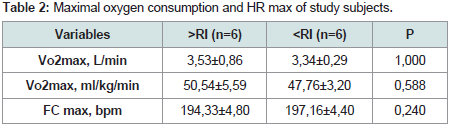
Table 2: Maximal oxygen consumption and HR max of study subjects.
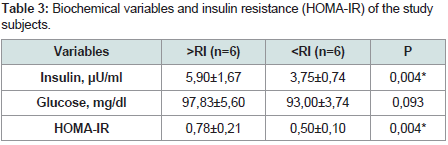
Table 3: Biochemical variables and insulin resistance (HOMA-IR) of the study subjects.
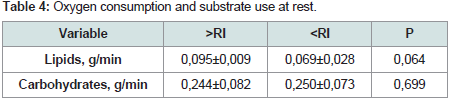
Table 4: Oxygen consumption and substrate use at rest.
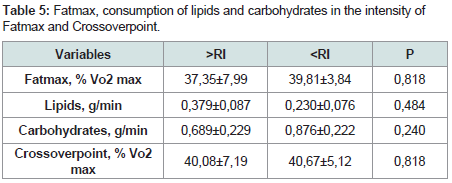
Table 5: Fatmax, consumption of lipids and carbohydrates in the intensity of Fatmax and Crossover point.
Discussion
Regarding BMI all subjects are classified as “eutrophic” according to the table of the World Health Organization [18]. This was an important control factor in this study, since excess of body fat, only by itself, can influence the use of fat and carbohydrates [4].The fact that no significant difference was found in maximal oxygen consumption (VO2 max), demonstrates that both groups present similar levels of cardiorespiratory fitness, important controlling factor, since the fitness level can influence the consumption of substrates [19].
The >RI group showed a significantly higher concentration of insulin compared with the < RI group and this result was expected, since the groups were divided according to the level of insulin resistance.
No significant differences were observed in the total oxidation of lipids and carbohydrates at rest. Other authors also observed no changes in the total oxidation of lipids and carbohydrates, as in obese T2DM compared with non-diabetic obese [5]; in T2DM non-obese compared with non-diabetics subjects [6]; in obese with impaired glucose tolerance compared with obese T2DM subjects and obese subjects with normal glucose [20]; and obese compared with nonobese subjects [21,22].
However, some of these studies using stable palmitate isotopes showed a reduced oxidation of plasma fatty acids in obese [5] presenting T2DM and non-diabetic obese subjects. In the latter was observed a negative correlation between the rate of oxidation of plasma fatty acids and central obesity, which showed a correlation with the insulin resistance. However, no one knows for sure, whether this fatty acid oxidation reduction, observed in both studies, is a cause or whether an effect of insulin resistance. Or even, if both are influenced by the increase of body fat. There is evidence that such fat metabolism disorders related to insulin resistance are not the effect of the body fat increase. Studies have shown an association between the content of intramyocellular triglycerides and insulin resistance even in individuals with a normal weight [23,24]. According to Kelley and Mandarino is possible to associate the decrease in the oxidation, observed in these studies, with an increased concentration of malonyl-CoA, an inhibitor of CPT complex activity, although this relationship has only been demonstrated in animals [25].
In the present study it was not possible to measure the contribution of the different sources for the total fat oxidation. However, it is possible that as well as in previously published studies, the RI group would have demonstrated a reduced plasma FA oxidation.
Although this study raised the hypothesis that disturbances in energy metabolism associated with insulin resistance could influence the exercise intensity where is showed an highest consumption of fats (Fatmax) and the intensity where the energy coming from carbohydrates begins to be predominant compared with the one derived from fats (crossover point) and also in the total amount of carbohydrates and lipids used in the intensity corresponding to Fatmax. Perez-Martin et al. demonstrated that obese showed the crossover point and Fatmax at intensities significantly lower than in non-obese individuals [9]. The authors argued that such changes could have occurred by several factors: BMI, absolute amount of fat, fat distribution, amount of visceral fat, diet, level of physical activity and insulin sensitivity. In the present study, the groups were similar in terms of body composition and physical activity level, differing only in the degree of insulin resistance and no differences were observed related to Fatmax and Crossoverpoint. Perhaps, the changes observed in the aforementioned study occurred due to other variables instead of insulin resistance, mainly because of the differences concerning the amount of body fat.
Fatmax occurred, in both groups, at lower intensities than reported in the study conducted by Achten et al. [16]. In this study the authors observed that the Fatmax for cyclists and runners occurred at an intensity of 659.2±2.8 % VO2 max. In addition, the absolute lipid utilization was also lower than in the cited study (0.65±0.05 g/ min). The rate of lipid oxidation was higher in the present because the sample consisted in athletes and because the training level influences such parameters [19].
No significant differences were observed in the total oxidation of lipids and carbohydrates at the intensity corresponding to the Fatmax. Furthermore, no significant correlations were observed among insulin resistance and total oxidation of lipids and carbohydrates and rest and exercise.
Goodpaster et al. studied the effect of obesity on the substrate balance during exercise comparing obese subjects with a non-obese control group [22]. Obese subjects showed a higher total fat oxidation and lower total carbohydrate oxidation (due to lower utilization of glycogen). The authors cited, among the possible causes, the presence of a smaller amount of glycogen andthe increased oxidation of intramyocellular triglycerides in the obese individuals. In this study, obese individuals were probably more resistant to insulin, since they showed an insulin concentration three times higher than in the control group. Thus, besides the amount of body fat, the individuals probably differed in insulin resistance and the changes observed in the balance of substrate could be associated with insulin resistance and not with obesity.
In another study Blaak et al. investigated the substrate oxidation using an indirect calorimetry and infusion of palmitate isotopes during the exercise (60 min of Cycle ergometer at 50% VO2 max) in obese type 2 diabetic patients and a control group of obese non diabetic [5]. There were no significant differences in total fat and carbohydrate oxidation at rest and in exercise. The group formed by diabetics showed a significantly lower plasma fatty acids and an increased oxidation of fatty acids derived from triglycerides, possibly due to the higher concentration of intramyocellular triglycerides. It was not measured in this study the contribution of different carbohydrate sources.
In order to eliminate the possible influence of obesity, Borghouts et al. studied not obese type 2 diabetics [6]. Those DM2 patients showed a significantly lower rate of glycogen oxidation and an oxidation of blood glucose greater than the control group during exercise (60 min of Cycle ergometer in the 40% of VO2 max). There were no significant differences in relation to the total rate of fats and carbohydrates oxidation.
Importantly, the last two studies cited that subjects were T2DM patients, therefore hyperglycemic, and the movement of glucose from the blood into the tissues may have been facilitated by the action of the body mass [4].
Aiming to study possible changes in substrate due to insulin resistance, without the influence of hyperglycemia and differences in body composition, Braun et al. studied insulin resistant women overweight and obese, but with normal blood glucose, during 50 minutes of walking on a treadmill at 45% VO2 max [4]. A significant decrease was observed in the total carbohydrate utilization in the group of individuals insulin resistant. With these results, the authors argued that changes in the balance of substrate can not be attributed to insulin resistance and the presence of fat in excess. Among the possible explanations the authors pointed out the possibility of the insulin resistant group having a higher concentration of intramyocellular triglycerides, so that the use of carbohydrates may have been reduced by the greater availability of fats.
In the present study were also checked the possible effects of obesity and hyperglycemia, but no significant differences were observed. There is a possible explanation if we compare to Braun et al. study, where differences in insulin resistance between groups were most striking than in the present study, since the authors included in the sample (using the index of insulin sensitivity) subjects with index 7 (insulin sensitive), eliminating individuals who had intermediate values [4]. In this study were included in the samples subjects with a smaller range of insulin resistance.
Moreover, were not included in the present study subjects presenting a severe insulin resistance. Stern et al. proposed the use of a cutoff point for classifying insulin resistance based on HOMA-IR > 4.65 [26]. Even in the RI group the highest value of HOMA-IR was 1, 2, still strongly below the cutoff point.
We observe, therefore, strong evidence that changes in the balance of the substrate, connected with insulin resistance, may be linked to an accumulation of intramyocellular triglycerides, observed in insulin resistant subjects.
It is possible that, in the sample of this study, the differences in relation to the levels of intramyocellular triglycerides have not been striking in order to reflect significant changes in the balance of substrate.
Conclusion
Considering the results in this sample we can conclude that:• There was no significant difference in utilization of fats and carbohydrates among subjects with higher insulin resistance (>RI) and subjects with lower insulin resistance (< RI) at rest.
• There was no significant difference in the intensities corresponding to the intersection point between energy sources (crossover point) and the maximum fat oxidation rate (Fatmax) between the groups >RI and < RI.
• There was no significant difference in the utilization of fats and carbohydrates at the intensity corresponding to Fatmax between the groups >RI and <RI.
References
- Wild S, Roglic G, Green A, Sicree R, King H (2004) Global prevalence of diabetes: estimates for the year 2000 and projections for 2030. Diabetes Care 27: 1047-1053.
- Hunter SJ, Garvey WT (1998) Insulin action and insulin resistance: diseases involving defects in insulin receptors, signal transduction, and the glucose transport effector system. Am J Med 105: 331-345.
- Cefalu WT (2001) Insulin resistance: cellular and clinical concepts. Exp Biol Med (Maywood) 226: 13-26.
- Braun B, Sharoff C, Chipkin SR, Beaudoin F (2004) Effects of insulin resistance on substrate utilization during exercise in overweight women. J Appl Physiol (1985) 97: 991-997.
- Blaak EE, van Aggel-Leijssen DP, Wagenmakers AJ, Saris WH, van Baak MA (2000) Impaired oxidation of plasma-derived fatty acids in type 2 diabetic subjects during moderate-intensity exercise. Diabetes 49: 2102-2107.
- Borghouts LB, Wagenmakers AJ, Goyens PL, Keizer HA (2002) Substrate utilization in non-obese Type II diabetic patients at rest and during exercise. Clin Sci (Lond) 103: 559-566.
- Achten J, Gleeson M, Jeukendrup AE (2002) Determination of the exerciseintensity that elicits maximal fat oxidation. Med Sci Sports Exerc 34: 92-97.
- . Achten J, Jeukendrup AE (2004) Relation between plasma lactate concentration and fat oxidation rates over a wide range of exercise intensities. Int J Sports Med 25: 32-37.
- Perez-Martin A, Dumortier M, Raynau E, Brun JF, Fedou C, et al. (2001) Balance of substrate oxidation during submaximal exercise in lean and obese people. Diabetes Metab 27: 466-474.
- Qu US_Department_of_Health_and_Human_Services (1996) Physical activity and health: A Report of the surgeon general. US Dept of Health and Human Services, Centers for Disease Control and Prevention, National Center for Chronic Disease Prevention and Health Promotion.
- Gordon CC, Chumlea WC, Roche AF (1988) Stature, recumbent length, and weight. In: Lohman TG, Roche AF, Martorell R (Eds). Anthropometric standardization reference manual. Champaign: Human Kinetics.
- Harrison GH, Buskirk ER, Carter JE, Johnston FE, Lohman TG, et al. (1988) Skin fold thicknesses and measurement technique. In: Lohman TG, Roche AF, Martorell R (Eds). Anthropometric standardization reference manual.Champaign: Human Kinetics.
- Jackson AS, Pollock ML (1978) Generalized equations for predicting body density of men. Br J Nutr 40: 497-504.
- Siri WE (1961) Body composition from fluid space and density. In: Brozek J, Hanschel A (Eds). Techniques for measuring body composition. Washington: National Academy of Science.
- Peronnet F, Massicotte D (1991) Table of nonprotein respiratory quotient: an update. Can J Sport Sci 16: 23-29.
- Achten J, Venables MC, Jeukendrup AE (2003) Fat oxidation rates are higher during running compared with cycling over a wide range of intensities. Metabolism 52: 747-752.
- Sociedade Brasileira de Diabetes (2003) Consenso brasileiro sobre diabetes 2002: Diagnóstico e classificacao do diabetes melito e tratamento do diabetes melito do tipo 2. Rio de Janeiro, Diagraphic Editora, Maio.
- . (2000) Obesity: preventing and managing the global epidemic. Report of a WHO consultation. World Health Organ Tech Rep Ser 894: 1-253.
- Brooks GA, Mercier J (1994) Balance of carbohydrate and lipid utilization during exercise: the “crossover” concept. J Appl Physiol (1985) 76: 2253-2261.
- Mensink M, Blaak EE, van Baak MA, Wagenmakers AJ, Saris WH (2001) Plasma free Fatty Acid uptake and oxidation are already diminished in subjects at high risk for developing type 2 diabetes. Diabetes 50: 2548-2554.
- Colberg SR, Simoneau JA, Thaete FL, Kelley DE (1995) Skeletal muscle utilization of free fatty acids in women with visceral obesity. J Clin Invest 95: 1846-1853.
- Goodpaster BH, Wolfe RR, Kelley DE (2002) Effects of obesity on substrate utilization during exercise. Obes Res 10: 575-584.
- Krssak M, Falk Petersen K, Dresner A, DiPietro L, Vogel SM, et al. (1999) Intramyocellular lipid concentrations are correlated with insulin sensitivity in humans: a 1H NMR spectroscopy study. Diabetologia 42: 113-116.
- Perseghin G, Scifo P, De Cobelli F, Pagliato E, Battezzati A, et al. (1999) Intramyocellular triglyceride content is a determinant of in vivo insulin resistance in humans: a 1H-13C nuclear magnetic resonance spectroscopy assessment in offspring of type 2 diabetic parents. Diabetes 48: 1600-1606.
- Kelley DE, Mandarino LJ (2000) Fuel selection in human skeletal muscle in insulin resistance: a reexamination. Diabetes 49: 677-683.
- Stern SE, Williams K, Ferrannini E, Defronzo RA, Bogardus C, et al. (2005) Identification of individuals with insulin resistance using routine clinical measurements. Diabetes 54: 333-339.