
Journal of Food Processing & Beverages
Download PDF
Research Article
*Address for Correspondence: Jan Yperman, Research group of Applied and Analytical Chemistry, Hasselt University, Agoralaan Building D, Diepenbeek, Belgium, Tel: +3211268320; E-mail: jan.yperman@uhasselt.be
Citation: Sariol HC, Peacok TM, Yperman J, Sauvanell AB, Carleer R, et al. Characterization of Granular Activated Carbons Used in Rum Production by Immersion “Bubblemetry” in a Pure Liquid. J Food Processing & Beverages. 2016;4(1): 10.
Copyright © 2016 Sariol HC, et al. This is an open access article distributed under the Creative Commons Attribution License, which permits unrestricted use, distribution, and reproduction in any medium, provided the original work is properly cited.
Journal of Food Processing & Beverages | ISSN: 2332-4104 | Volume: 4, Issue: 1
Submission: 02 July, 2016 | Accepted: 30 September, 2016 | Published: 10 October, 2016
Few seconds after completing the total immersion process, the bubbles appear as the result of air escaping from the GAC pores and slits. Bubbles of different size are formed and some of them coalescence. The formed bubbles slowly appear from the solid but remain separately trapped by the glass cover in the liquid. The first produced bubbles are gently pushed away by the next one. The viscosity of glycerol guaranties a slow motion process and diminishes the bubble coalescence. When all the bubbles have been formed, which can last 3-10 min, depending on the exhausting level of the measured GAC particle), the combination of the glycerol properties (viscosity and surface tension) and the used glass cover position retains all formed bubbles.
Length measurement
Data processing: Forty (40) particles (one by one) per GAC sample were independent analysed by immersion “bubblemetry”. The size and the number of the formed bubbles were determined and its volume in cm3 was calculated. In order to express the volume of air bubbles released per gram of GAC in cm3/g (in analogy to express the VT, VDR and Vmes) a weight calibration curve was recorded. Differentamounts of particles (previously prepared according to (3.3.1) per GAC sample were weighed: i.e. 25, 50, 75, 100, 125, 150 and 175 (Np). The used data are given in Table 1.
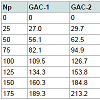
The number of particles (Np) per GAC sample was plotted versus the total weight of GAC and a linear correlation was obtained (Figure 4).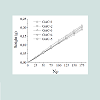
The slope value is the main weight for a single GAC particle: w S (in g/GAC particle), being more accurate than weighing particle individually. The specific weight for a single GAC particle w S is comparable with each other (Table 2).
Bubble shape analysis
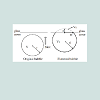
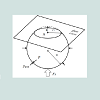
We can accept that the flattening process is equivalent to a formation of a new spherical bubble of fictitious radius: 1 "r " and fictitious volume: "VF". An equivalent spherical sector of volume: "SV", with base radius: "r2" and altitude: “a” can be assumed as the loss section of the fictitious spherical bubble (Figures 5 and 6). As the volume of air inside of the original bubble does not change by deformation, the relation between volumes of original and flattened bubble can be expressed as:
 V =VF −VS (1)eq. (1) can be rearranged and expressed in term of radius relation as:
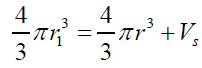 (2) where: r1>rThe external static pressure of the liquid: "Pext" is equal to the pressure "P" of the air inside of the flattened bubble also in equilibrium with the bubble ascending force "FA" according to Arquimedes and Pascal laws as follows:
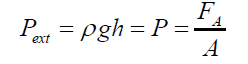 (3)Being “A” the circular area of deformation which is the basis of the equivalent spherical sector Vs, ρ the liquid density, g the acceleration of gravity and h the immersion depth of the bubble (Figure 7).
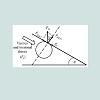 As the gas density is much smaller than the liquid density, according to the Arquimedes law, the ascending force on a formed bubble is expressed as:
 (4) Combining eqs. (3) and (4) gives:
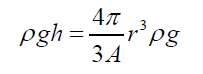 (5) Simplifying and reordering eq. (5)
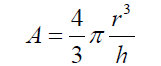 (6) As the basis of the spherical sector “A” can be considered as circular, eq. (6) can be expressed as :
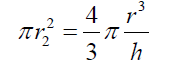 (7) Thus
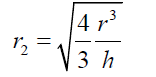 (8) The volume of the spherical sector can be calculated as:
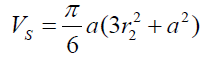 (9) where
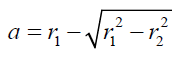 (10) Combining equations (2) and (9) gives:
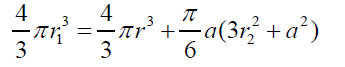 (11) Combining eqs. (8) and (11), after simplifying gives:
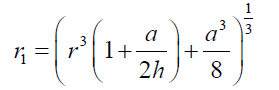 (12) also combining equations (10) and (8):
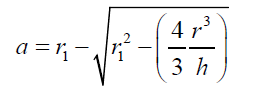 (13) Equations (12) and (13) give the mathematical model to determine the radius r1 , of the flattened bubble. The radius of the flattened bubble depends on the size of the original bubble and the immersion depth. By calculating r1 , it is possible to know how much larger the radius of the flattened bubble is in comparison with the original spherical bubble initially formed. The volume obtained by measuring the fictitious bubble dimension can now be corrected into a real bubble volume with radius r.Some possible bubble radiuses of original bubbles were proposed and the radiuses of its correspondent flattened formed bubbles were calculated according to eqs. (12) and (13). Results are presented in Table 3. For h, a value of 6 mm depth was considered according to the liquid level in the bubbling cuvette (Figure 1).The percent of error (Error (%), was calculated as:
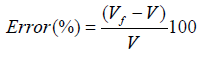 According to the results presented in Table 3, original bubbles with radiuses lower than 0.5 mm do not present significant differences in comparison with the radius and volume of its flattened version. Additionally, for an original bubble radius into the range of 1 to 2.5 mm the experimental error increases, however, for bubble radius less than 2 mm the involved error is less than 5 %. In conclusion, the bubble flattening process does not affect considerably the bubble size measurement below 1 mm in radius. According to the experimental error involved, the fact to consider “spherical” shapes for the observedbubbles is quite correct in the explored radius range of 0-1 mm. Indeed, bubble radius measured maximize for all GACs investigated at around 0.15 mm (see further).
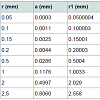 The presented bubble shape analysis was done considering flat position of the glass cover: θ = 0 ; in this case using glycerol, the retention angle θ = 11.3° diminishes also the flattening process.Figure 7 presents a forces diagram when the retention angle “θ” is different from zero. In this case, the ascending force on the bubble is just a component of the total Arquimedes force: (FA); according to the diagram, the force that dominates the bubble deformation degree is: FA(y)=FA cos θ < FA . The bubble is retained statically in a specific position due to the equilibrium between the viscous and tensional forces of the liquid (Fυ) and the component of the Arquimedes force FA(x); thus this equilibrium mathematically can be expressed as: FA(x) = Fυ. Concluding, as FA(y) < F the flattening processdiminishes when θ ≠ 0 in comparison with the flat position: θ = 0 , which is the critical condition (maximal) for bubble deformation. The greater θ , the smaller the deformation. Using different immersing liquids, the flat position of the glass cover has to be adapted and can give extra information on the pore sizes and total volume in the GAC.Total volume of released bubblesThe total volume of released bubbles per gram of GAC: VT"imm" (in cm3/g) was obtained as follows:The bubble diameter (Di) was previously measured in pixel (px), and transformed in mm multiplying by the conversion factor (in mm/px). For determining the bubble volume, measuring the bubble diameter is more accurate than the measuring of the bubble radius. To locate the center of the bubble introduces more errors. The best option therefore is to measure the bubble diameter instead of its radius. According to this, the representative dimension of the bubble size is the diameter as the original measured parameter.1- The volume of a spherical single bubble (Vi (in cm3)) can be calculated as:
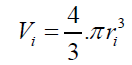 (14) 2- The total volume of air contained in a number of experimentally counted “k” bubbles released (VTb(in cm3)) per GAC samples was determined as:
 (15) 3- The immersion total volume of released bubbles per gram of GAC (VT”imm” (in cm3/g)) was determined as:
 (16) being Np : number of GAC particles, in this case 40.
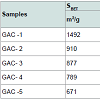 Figure 8 gives an example of different bubbling patterns for immersed GAC particles. Cases (a) and (b) are typical patterns observed for samples GAC-1, GAC-2 and GAC-3; (c) and (d) are typical bubbling patterns for samples GAC-4 and GAC-5.
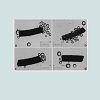 Figure 9 gives the GACs bubble diameter distribution. No significant differences are found between the plots of the five GAC samples. The majority of formed bubbles are distributed around 0.2 - 0.4 mm in diameter using glycerol as immersing liquid (25 °C).
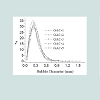 Table 5 shows the fitting parameters of Gaussian model obtained for the different GAC plots. According to the regression coefficient, the Gaussian model fits quite well the found bubble diameter distribution. When comparing the parameters , c x w and A no significant differences between GAC bubbles diameter distribution can be found, confirming the graphical comparison.
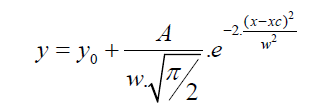
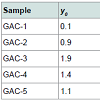 Table 6 presents the results of immersion “bubblemetry”. Each presented value was obtained by adding the total bubble volume of 40 independent particles per GAC sample analyzed individually. The high amount of total released bubbles “k” disables the bubble counting for more than one particle each (number “k” of counted bubbles varied between 565 ó 870).
 Additional, if too many bubbles are formed, they coalescence, overlap partially each other or are even invisible, leading to inaccurate count and measurement results. The values of total volume of the “k” experimentally counted bubbles (VTb) are different. For GAC-1 the highest value of VTb was found and correspondingly, the lowestvalue was observed for GAC-5, this feature match with the quality of “virgin” and “exhausted level” of both samples. For the samples GAC-2 to 4 again a clustered behavior is noticed. Their values fall within the two extreme data, but are closer to the value of the most exhausted GAC.The amount of the experimentally counted bubbles released by the forty particles per sample of GAC ("k") is quite high and characteristic for high-porous materials. The obtained VT”imm” values are comparable with the porous characteristics of GAC in terms of pore volume. The differences in total pore volume between the N2 sorption and immersion “bubblemetry” results are logical. Both methods are performed in totally different conditions.According to its molecular size, pressure and temperature applied, the N2 is capable to fill more pores than the glycerol. Therefore the total volume of pores found by N2 sorption is higher than VT”imm”. Byimproving the experimental conditions of the new technique and by using other suitable solvents the accuracy can certainly be improved and falls within normal technique development strategy.Figure 10 shows the linear correlation between VT”imm” and the porous characteristic VT in the studied porosity range (500-1500 m2/g and 0.3-0.8 cm3/g). According to the fitted linear model between VT”imm” and VT, VT”imm” represents approximately 65% of the total volume of pores (VT) determined by N2 sorption technique. Meaning that glycerol, at the presented experimental conditions, is capable to fill 65% of the available pores for N2.Experiment with an immersion liquid of smaller molecular size will result in higher VT”imm” values and will approximate more closely the values found for the N2 sorption. This can be proved as follows:Supposing that two immersing liquids (1) and (2) have different pores accessibility and considering that: (1) represents the liquid with higher accessibility; then the total volume of bubbles formed in both liquids (1) and (2) can be expressed according to eq. (15):
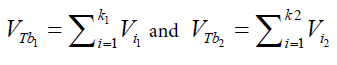 (17)k1;k2: number of experimentally counted bubbles with volume Vi1;Vi2 in liquids (1) and (2).Figure 11 presents a gas bubble into an immersing liquid of density “ρ”. The gas bubble is statically located at depth “h” under the liquid level.Vi1;Vi2: The volume of a single bubble formed in liquids (1) and (2).The gas pressure “P” inside of the bubble is equal to the external static pressure of the liquid ext P , therefore the gas pressure into the bubble can be calculated as:
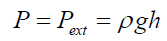 (18)according to the ideal gas law
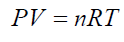 (19) For any single formed bubble Vi gives:
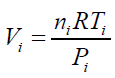 (20) Where ni is the amount of air (in mol) contained into a single bubble of volume Vi Combining eqs. (18) and (20) and considering the same conditions of T,ρ and depth h for all the formed bubbles suspended into an independent liquid:
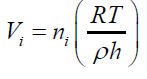 (21) The differences in the final results obtained by applying different immersing liquids (1) and (2) can be presented in form of ratio as:
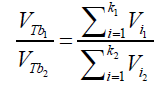 (22) Combining the equations (21) and (22):
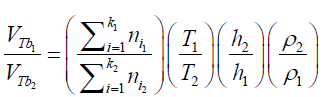 (23) The total amount of air (in mol) displaced by the liquid: (nT ) in form of “k” bubbles can be determined as:
 (24) Combining eq.(23) and (24) gives:
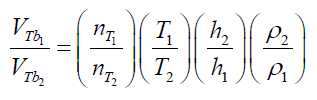 (25) Eq. (25) presents the parameters which can modify the final results using different immersing liquids and experimental conditions. In this case, analyzing the terms of the equations, the total volume ofreleased air by a particle depends on: 1) the pore accessibility of the liquid (related with the molecular size and viscosity of the liquid), 2) the work temperature, 3) the depth and 4) the liquid density.Using this equation, it is possible to predict the effect of changes using different immersing liquids and different experimental conditions in terms of the total volume of released bubbles andcorrespondently on the total volume of pores determined by immersion “bubblemetry”. The use of other liquids like water or ethanol to obtain the bubbles was also explored, but the results were not satisfactory. The bubbling process using these liquids is so fast that it was not possible to capture the bubbles in a picture. Due to their low viscosity, coalescence phenomena occur making the measurement of the sizes of produced bubbles impossible. Other liquids such as: phosphoric acid, lactic acid and paraffin were alsoresearched (they’re also transparent and their viscosity is higher than water), but again no satisfactory results were obtained: the counting process was quite difficult and not accurate because of the enormous number of produced bubbles, bubbles coalescence and attached on the GAC surface (see Figure 12).Further on, only one side of the particle is visible under the microscope; more bubbles remain hidden at the other side of the GAC being thus non-detected. Therefore, using these liquids, around 0-50% of the information about the number of produced bubbles and its volume is unknown/lost, introducing a significant error in the measurement process.Comparing the obtained features (Figure 12) with the images obtained using glycerol (Figure 9) as immersing liquid, these cited problems didn’t occur. Up to now glycerol is the best immersing liquid to detect and process the bubbles.However, the chemical and physical property of the liquids and the relationship with the GAC bubbling feature must be further studied. This correlation is not simple; liquids with similar physical properties (surface tension, density and viscosity) produce different bubbling patterns. The bubbling pattern of a GAC depends not only on the chemical-physical properties (or one individual property) of the used liquid but also on the chemical-physical characteristics of the GAC surface.
Characterization of Granular Activated Carbons Used in Rum Production by Immersion “Bubblemetry” in a Pure Liquid
Harold Crespo Sariol1, Thayset Mariño Peacok1, Jan Yperman 2*and Ángel Brito Sauvanell1, Robert Carleer2 and José Navarro Campa3
- 1Faculty of Chemical Engineering, Energetic Efficiency Center, Universidad de Oriente, Santiago de Cuba, Cuba
- 2Research group of Applied and Analytical Chemistry, Hasselt University, Agoralaan Building D, Diepenbeek, Belgium
- 3First Master of the Cuban Rum, Santiago de Cuba, Cuba
*Address for Correspondence: Jan Yperman, Research group of Applied and Analytical Chemistry, Hasselt University, Agoralaan Building D, Diepenbeek, Belgium, Tel: +3211268320; E-mail: jan.yperman@uhasselt.be
Citation: Sariol HC, Peacok TM, Yperman J, Sauvanell AB, Carleer R, et al. Characterization of Granular Activated Carbons Used in Rum Production by Immersion “Bubblemetry” in a Pure Liquid. J Food Processing & Beverages. 2016;4(1): 10.
Copyright © 2016 Sariol HC, et al. This is an open access article distributed under the Creative Commons Attribution License, which permits unrestricted use, distribution, and reproduction in any medium, provided the original work is properly cited.
Journal of Food Processing & Beverages | ISSN: 2332-4104 | Volume: 4, Issue: 1
Submission: 02 July, 2016 | Accepted: 30 September, 2016 | Published: 10 October, 2016
Abstract
Microscopic techniques have been widely used in many branches of science. However, almost no studies for the characterization of porous materials have been developed using optical microscopy. A new methodology has been developed in order to characterize granular activated carbons based on the microscopic analysis of its bubbles formed by immersion into a pure liquid. A new experimental set-up for the microscopic measurements of bubble size has been presented and results are correlated with the porous structure of carbons characterized by conventional N2 sorption. Five samples ofgranular activated carbons used in the rum production with different porous characteristics have been evaluated by both methods. Parameters as SBET and total volume of pores showed a linear correlation with the measured total volume of the produced bubbles using glycerol as immersing liquid at 25 °C. Found relationship givesthe possibility to predict and calculate porous characteristics of granular activated carbons. This new methodology approach opens possibilities in using optical microscopy for characterizing high-porosity materials at different pore levels complementary to other techniques.Keywords
Activated carbons; Immersion; Bubbles; Optical microscopy, PorosityIntroduction
Activated carbon (AC) adsorption is the most common technique for removing various pollutants due to its extended surface area, high pore volume, well developed porous structure and specific surface functional groups [1,2]. AC can be used powdered or granular (0.2-5 mm). Granular activated carbons (GAC) are widely employed for product purification (such as sugar refining, food processing and water treatment) [2]. In spirits and liquor production as rum industry, GACs are used to remove organic compounds that affect the sensorial quality of the final product [3]. Rums are a complex mixture of organic substances: 186 organic compounds have been identified [4,5]. When GACs become exhausted they are landfilled and replaced by fresh GACs. However, the landfilled GACs create a solid waste problem. For this reason a regeneration process should be applied and the effectiveness of GAC regeneration must be guaranteed. Up till now studies about the regeneration of exhausted GAC in rum production have not yet or very limited been reported, despite of its importance. A reason for this can be found in the economic and industrial secrecy involved in rum production processes as in the protected industrial applications of GAC. In order to determine the exhaustion level of GAC or the regeneration degree reached, a proper and fast analytical technique based on determination of specific surface area and porosity had to be applied [6,7]. Among the most commonly determined characteristics are: the surface group functionalities, the specific surface area (area per unit of mass), the specific pore volume (pore volume per unit of mass), and the pore size distribution. A full characterization of an activated carbon, using the techniques listed in the standardization procedures of the ASTM would be too expensive to be carried out and would take too long tobe completed in time [3,8] in view of a rum production process and technological facilities of rum producers are limited.At present, specialized rum taster experts determine when GAC need to be replaced based on the sensorial characteristics of the filtrated rum and not on the exhausted level of the GAC. The GAC qualitycontrol is done at industrial scale and is performed empirically. The GAC used is always provided by the same supplier, selected by the rum taste experts and only based on the sensorial characteristics of the filtrated rum. The surface group functionality and its relationship with the effectiveness to achieve the desirable taste and Cuban rum aroma have not yet been studied. The practical evidence gathered for years has been the main (only) criteria to accept the used kind of GAC. However, sensorial techniques cannot offer any qualitative nor quantitative information about the real exhaustion degree of the GAC. Additionally using fixed bed filters of GAC; the exhaustiondegree of GAC is different according to its location or position in the bed. It is found that a further characterization of the GAC in industrial rum filters gives the possibility to save part of the GAC. It can be reused in the rum production process if its exhaustion degree is quantified. As a quick action is needed from the moment the taste of the produced rum is not within an accepted high quality level, an alternative, fast and reliable method to measure the exhaustion level of GAC is more than welcome.
Structures in AC surfaces rarely are smooth on a molecular scale. A suggested alternative convention is to assume that the external surface includes all the prominences and any surface cracks that arewider than they are deep and are accessible for adsorptives. The latter restriction is a procedural condition that results in a demarcation between internal and external surfaces that depends, in practice, on the method of assessment and the nature of the pore size distribution. Pores and cracks smaller in dimension than the adsorptive may be, in effect, inaccessible [9-11]. On the other hand, pores that have a navigable channel of communication with the external surface of the body are described as open pores. Open pores are further classified into “through pores” and “blind pores.” Through pores have an open channel that begins at one location of the surface, extends into the particle, and re-emerges on the surface at a different location. Blind pores (also called dead-end or saccate pores) are open to the surface only at one end. While these small surface irregularities are technically blind pores, it is often more useful and convenient to consider them separately as part of a distinct attribute, called surface roughness. Some methods only have access to open pores (e.g. those methods using a fluid), whereas other methods may access both open and closed pores (e.g. methods using adsorption or scattering of electromagnetic radiation). Moreover, for a given method, the value determined experimentally depends on the size of the molecular probe (fluid displacement, adsorption) or of the gauge (stereology). Thus, a measured value of porosity is a reflection of both the physical state of the material and the experimental method used for its determination. To distinguish these three cases, it should be noted whether the specific pore volume, is due to the open pores (leading to the “open porosity”), the closed pores (leading to the “closed porosity”), or both types of pores together (leading to the “total porosity”) [12].
One of the fluid displacement techniques widely used is immersion calorimetry. When a solid is immersed into a non-reacting liquid, a given amount of heat is evolved. This “heat of immersion” or “heat of wetting” is related to the formation of an adsorbed layer of molecules of the wetting agent on the solid surface of the solid. The heats of immersion of a given solid into different liquids are usually different [13,14]. Characterization of microporous adsorbents by immersion calorimetry is not as straightforward as for non-porous adsorbents. Atkinson et al. measured the heat of immersion of a microporous carbon cloth and a microporous activated carbon in a series of organic liquids and, for a given solid, obtained a significant dependence of the heat of immersion with the liquid used. They concluded that the heat of immersion is a measure of the volume of pores accessible to the molecule of the immersing liquid, thus opening the possibility of using immersion calorimetry as a tool to obtain pore size distribution (PSD) in AC [1-15]. Furthermore, molecules larger than some pores will not be able to access internal surfaces as smaller molecules do. Thus, the use of liquids with different molecular sizes permits the estimation of the PSD of a porous solid. The shapes of the adsorbing molecule and pore shapes are also important factors [8,13-15]. Themost important feature is the assumption of simple proportionality between the surface area and the enthalpy of immersion, irrespective of the role played by micropores in the enhancement of the adsorption potential. It is established that, for slit-shaped micropores in whichonly one molecule of the wetting liquid can be accommodated, there is a twofold increase of the adsorption potential as compared with that in an open surface [8,13-15].
The immersion process can be performed according to various types of wetting. The four major types of wetting are as follows (the first three following Everett’s definitions, 1972) [16,17]:
1. Immersional wetting: (which we simply call immersion and denote by subscript ‘imm’) is a process in which the surface of a solid, initially in contact with vacuum or a gas phase, is brought in contact with a liquid without changing the interface area. Here, a solid-gas(or solid-vacuum) interface is replaced by a solid-liquid one of the same area.
2. Adhesional wetting: is a process by which an adhesional union is formed between two pre-existing surfaces (one of them being solid and the other liquid). Here, two initial interfaces (solid-gas and liquid-gas) are replaced by one (solid-liquid).
3. Spreading wetting: is a process in which a drop of liquid spreads over a solid substrate (the liquid and solid being previously in equilibrium with the vapour). Here, the solid-vapour interface is replaced by two new interfaces (solid-liquid and liquid-vapour) of the same area.
4. Condensational wetting: is a process in which a clean solid surface (initially in vacuum) adsorbs a vapour up to the formation of a continuous liquid film. Here, the solid-vacuum interface is replaced by two new interfaces (solid-liquid and solid-vapour) of the same area, as in spreading wetting. The difference between condensational and spreading wetting is the initial state, the liquid film being formed from a vapour in one case and from a drop in the other case.
If properly used, immersion wetting is a versatile, sensitive and accurate technique which has many advantages for the characterization of porous solids and powders [17].
When a particle of a porous material is immersed into a liquid, the air trapped in pores and cracks of the particle is removed in form of bubbles by the liquid which occupy the “empty” spaces in the particle. This behaviour was observed when particles of GAC used in the rum production were immersed in different liquids. The GAC is initially in contact with a gas phase (air), creating a solid-air interface, when putting in contact with the liquid the solid-gas interface is replaced by a solid-liquid one. This replacement occurs by the capillary action involved in filling the pores and slits in the GAC particle. In the interface replacement process, the air is removed in form of bubbles which escape through the bulk liquid. Measuring the size ofthe formed bubbles and calculating its volume, the total volume of released air and correspondently, the volume of with liquid occupied open pores and slits can be determined. The bubbles production rate and its characteristics, depend on the porous characteristics of the solid and the physical properties of the immersing fluid. In this case, glycerol was used as immersing liquid because of its physical properties (discussed later) permits to observe the formed bubbles at “slow motion” giving the possibility of fixing proper microscopicpictures of the bubbles, to be further analysed. In this work an optical microscope coupled to a digital camera was applied to determine the bubbles size and amounts produced in an immersing process with glycerol for GACs used in the rum production. The obtained results can be correlated with the GAC porous characteristics and can be compared with N2 sorption results at 77 K. This work is a first approach to use immersion bubblemetry for the study of porous characteristics of high-porous materials.
Materials and Methods
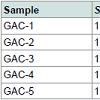
GAC samples and the immersing liquidFive samples of GAC (0.8 mm) were obtained from the major rum producer in Cuba: labelled as GAC-1, GAC-2, GAC-3, GAC-4 and GAC-5. The samples GAC-1 is a fresh GAC (virgin) and GAC-5 is the most exhausted GAC used in the rum production process. The others have different exhaustion levels ranging between them. The pure glycerol (C3H5(OH)3) (reactant quality) was supplied by Merck®.
Samples characterization
The porous structure of GACs was characterized by N2 adsorption at 77 K using ASAP2020 (Micromeritics). Before the analysis, the sample was degassed overnight at 300 °C. The specific surface area (SBET) was estimated by the BET equation. The amount of nitrogen adsorbed at the relative pressure of p/p0 = 0.96 was employed to determine the total volume of pores (VT). The micropore volume (VDR) was calculated by applying the Dubinin-Radushkevich equation. The difference between VT and VDR was taken as the mesopore volume(Vmes). The average micropore width L0 was calculated using the Stoeckli equation [7]. The quenched solid density functional theory (QSDFT) was used to determine the pore size distribution [6].To observe the morphology of GAC grains, a scanning electron microscope (SEM) (Vega®Tescan/ TS5130SB/SE Detector) was used.
Experimental conditions
Sample preparation: The samples were dried using Boxun BGZ series oven applying ASTM Standard Test Methods for Moisture in Activated Carbon [18]. Samples were refreshed in a silica-gel dryer during 2 h and for weighing, Sartorius analytical balance was used.
Bubble size measurement: A NSZ-606 optical microscope coupled with HDCE-50B digital camera was used to capture the microscopic images. The Scope Image Dynamic UTHSCSA-Image Tool software was used for measuring the bubbles size.
Experimental set-up description:
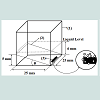
The bubbling cuvette: The GAC immersion “bubblemetry” experiments were performed in a “bubbling cuvette” (Figure 1) which consists of :
1- A glass cuvette (25x25x20 mm)
2- A glass cover (0.25 mm thickness) forming an angle θ=11.3° which is experimentally determined and function of the physical properties (viscosity, molecular size, surface tension, …) of the medium used in this case: glycerol. For other immersing liquids, θ must thus be determined.
3- An immersion liquid and GAC particle just trapped in the angle formed between the glass cuvette bottom and the glass cover.
3.75 mL of pure glycerol is injected in the cuvette, not only covering the GAC particle (one grain (rod) each time) within 3 s, but reaching a 6 mm of liquid level (Figure 1). Working temperature was 25 °C.
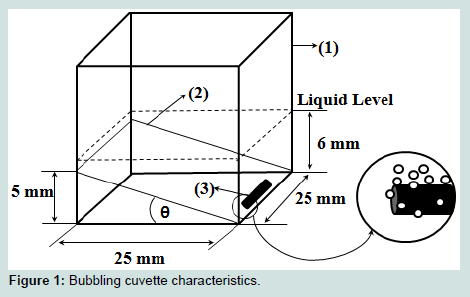
Figure 1: Bubbling cuvette characteristics.
The aim of the glass cover with specific slope is: 1) to block the bubble’s movement giving the possibility to do size measurement; 2) to retain separated bubbles and to diminish overlapping and coalescence effects; and 3) to fix properly the GAC particle in the ame position. In this way an optimal condition is realized to do correct microscopic observation of the bubble formation process.
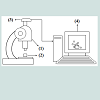
Description of the experimental set-up
The experimental set-up is presented in (Figure 2). (1) The optical microscope (2) is coupled with the digital camera (3) which is connected to the computer (4). A microscopic model ruler (0.1 mm scale) was used for calibrating the size of the bubbles in the microscopic images. The Scope Image Dynamic UTHSCSA-Image Tool software is used to transform the image dimension in pixels into mm using a conversion factor. When the GAC bubbling processis finished, a digital picture of all formed bubbles is taken and the bubble sizes and amounts are measured and counted. The volume of each bubble is determined and the total volume of air released can be obtained by knowing the number of formed bubbles and its sizes.
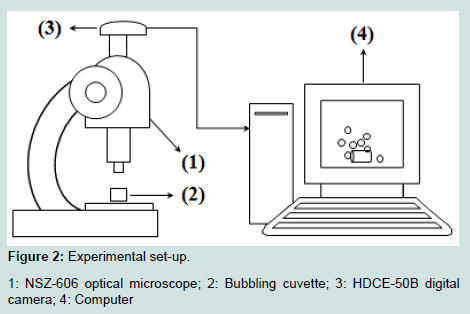
Figure 2: Experimental set-up.
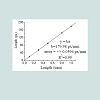
In order to determine the bubble size, the distance between two points on the digital image must be determined. The length measurements have to be done properly in order to obtain satisfactory results. The measurements need to be calibrated using a microscopic ruler .The ruler image was obtained using the same optical adjustment of the microscope to observe the GAC images.Different lengths measurement on the ruler were performed in order to obtain a calibration curve (Figure 3) which was used to determine the conversion factor to transform pixels in millimeter, including the error involved.
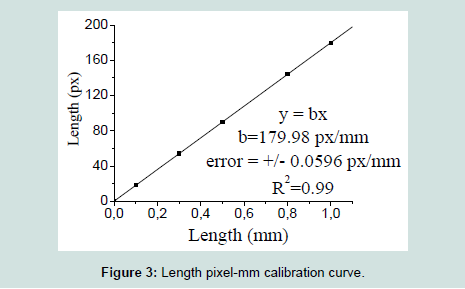
Figure 3: Length pixel-mm calibration curve
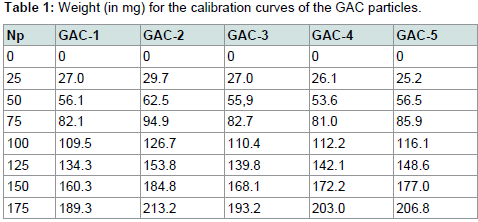
Table 1: Weight (in mg) for the calibration curves of the GAC particles.
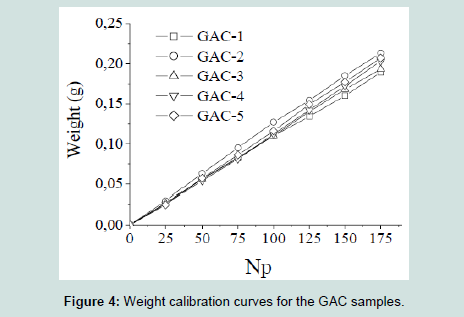
Figure 4: Weight calibration curves for the GAC samples.
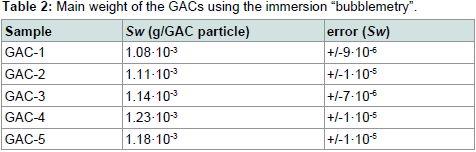
Table 2: Main weight of the GACs using the immersion “bubblemetry”.
Considering that the formed bubbles are captured using the glass cover (Figure 1), they suffer from a deformation (flattened), introducing errors in the real measured dimension of the bubble. In this condition bubbles are not totally spherical as the initial formed bubbles are freely suspended into the bulk glycerol.
An analysis about the differences between the radiuses of the original formed bubble and the flattened one is proposed. Nevertheless the observed bubbles can be considered as “spherical” as will be proved.
According to Figure 5 a simplified model of bubble deformation can be presented. An original free bubble of radius: "r " and volume: "V " escaping from the GAC ascends to reach the glass cover; resulting in a new deformed “flattened” bubble.
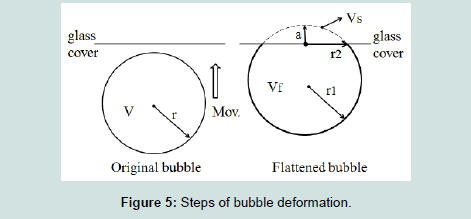
Figure 5: Steps of bubble deformation.
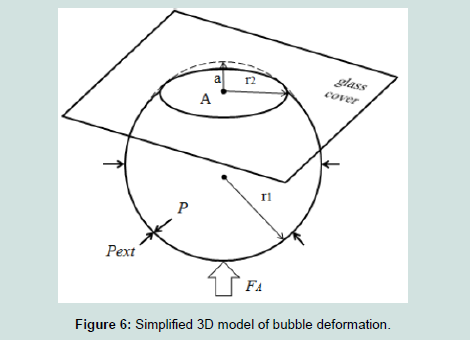
Figure 6: Simplified 3D model of bubble deformation.
(2) where: r1>rThe external static pressure of the liquid: "Pext" is equal to the pressure "P" of the air inside of the flattened bubble also in equilibrium with the bubble ascending force "FA" according to Arquimedes and Pascal laws as follows: (3)Being “A” the circular area of deformation which is the basis of the equivalent spherical sector Vs, ρ the liquid density, g the acceleration of gravity and h the immersion depth of the bubble (Figure 7).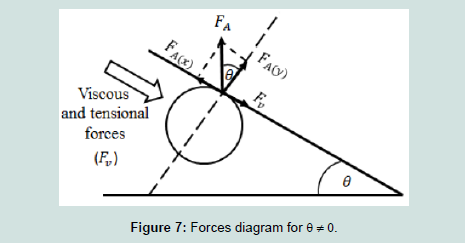
Figure 7: Forces diagram for θ ≠ 0
(4) Combining eqs. (3) and (4) gives: (5) Simplifying and reordering eq. (5) (6) As the basis of the spherical sector “A” can be considered as circular, eq. (6) can be expressed as : (7) Thus (8) The volume of the spherical sector can be calculated as: (9) where (10) Combining equations (2) and (9) gives: (11) Combining eqs. (8) and (11), after simplifying gives: (12) also combining equations (10) and (8): (13) Equations (12) and (13) give the mathematical model to determine the radius r1 , of the flattened bubble. The radius of the flattened bubble depends on the size of the original bubble and the immersion depth. By calculating r1 , it is possible to know how much larger the radius of the flattened bubble is in comparison with the original spherical bubble initially formed. The volume obtained by measuring the fictitious bubble dimension can now be corrected into a real bubble volume with radius r.Some possible bubble radiuses of original bubbles were proposed and the radiuses of its correspondent flattened formed bubbles were calculated according to eqs. (12) and (13). Results are presented in Table 3. For h, a value of 6 mm depth was considered according to the liquid level in the bubbling cuvette (Figure 1).The percent of error (Error (%), was calculated as: According to the results presented in Table 3, original bubbles with radiuses lower than 0.5 mm do not present significant differences in comparison with the radius and volume of its flattened version. Additionally, for an original bubble radius into the range of 1 to 2.5 mm the experimental error increases, however, for bubble radius less than 2 mm the involved error is less than 5 %. In conclusion, the bubble flattening process does not affect considerably the bubble size measurement below 1 mm in radius. According to the experimental error involved, the fact to consider “spherical” shapes for the observedbubbles is quite correct in the explored radius range of 0-1 mm. Indeed, bubble radius measured maximize for all GACs investigated at around 0.15 mm (see further).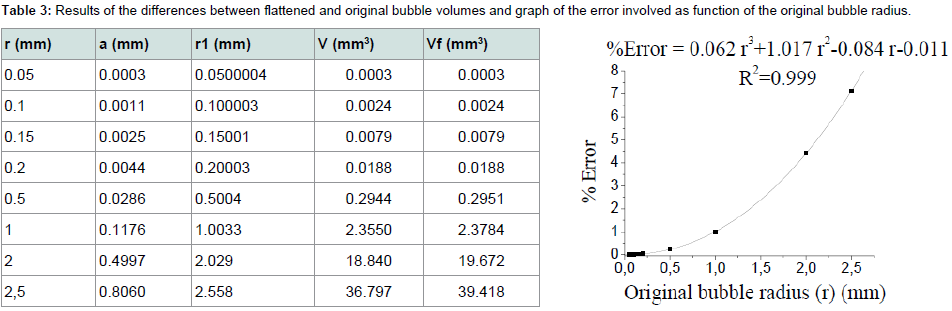
Table 3: Results of the differences between flattened and original bubble volumes and graph of the error involved as function of the original bubble radius
Figure 7: Forces diagram for θ ≠ 0
(16) being Np : number of GAC particles, in this case 40.Results and Discussion
Table 4 displays the porous structure of the five GAC samples as determined using N2 adsorption at 77 K [19]. For GAC-1, the highest specific surface area is measured and is almost 1500 m2/g. After being used in the rum production, the exhausted GAC (GAC-5) reveals carbon losses of about 60% of its specific surface area and 50% of its total volume compared to GAC-1. The three other GACs have surface area and pore volume in between.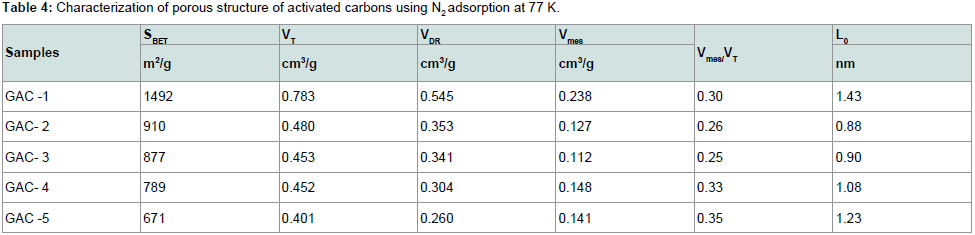
Table 4: Characterization of porous structure of activated carbons using N2 adsorption at 77 K.
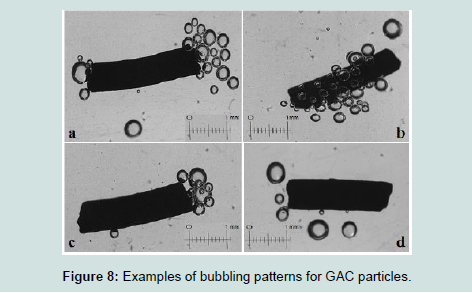
Figure 8: Examples of bubbling patterns for GAC particles.
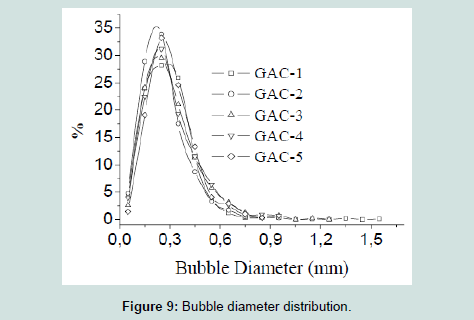
Figure 9: Bubble diameter distribution.
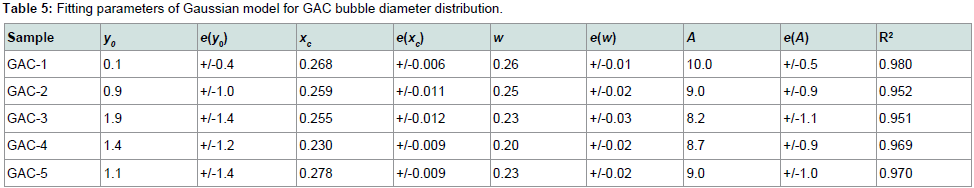
Table 5: Fitting parameters of Gaussian model for GAC bubble diameter distribution.
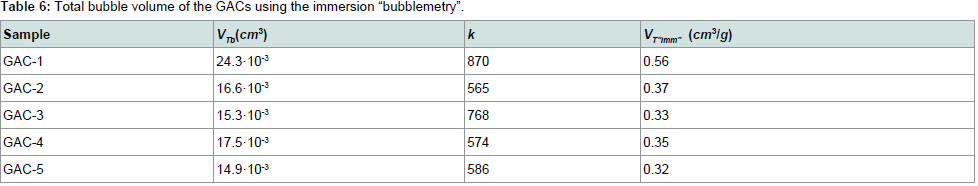
Table 6: Total bubble volume of the GACs using the immersion “bubblemetry”
(17)k1;k2: number of experimentally counted bubbles with volume Vi1;Vi2 in liquids (1) and (2).Figure 11 presents a gas bubble into an immersing liquid of density “ρ”. The gas bubble is statically located at depth “h” under the liquid level.Vi1;Vi2: The volume of a single bubble formed in liquids (1) and (2).The gas pressure “P” inside of the bubble is equal to the external static pressure of the liquid ext P , therefore the gas pressure into the bubble can be calculated as: (18)according to the ideal gas law (19) For any single formed bubble Vi gives: (20) Where ni is the amount of air (in mol) contained into a single bubble of volume Vi Combining eqs. (18) and (20) and considering the same conditions of T,ρ and depth h for all the formed bubbles suspended into an independent liquid: (21) The differences in the final results obtained by applying different immersing liquids (1) and (2) can be presented in form of ratio as: (22) Combining the equations (21) and (22): (23) The total amount of air (in mol) displaced by the liquid: (nT ) in form of “k” bubbles can be determined as: (24) Combining eq.(23) and (24) gives: (25) Eq. (25) presents the parameters which can modify the final results using different immersing liquids and experimental conditions. In this case, analyzing the terms of the equations, the total volume ofreleased air by a particle depends on: 1) the pore accessibility of the liquid (related with the molecular size and viscosity of the liquid), 2) the work temperature, 3) the depth and 4) the liquid density.Using this equation, it is possible to predict the effect of changes using different immersing liquids and different experimental conditions in terms of the total volume of released bubbles andcorrespondently on the total volume of pores determined by immersion “bubblemetry”. The use of other liquids like water or ethanol to obtain the bubbles was also explored, but the results were not satisfactory. The bubbling process using these liquids is so fast that it was not possible to capture the bubbles in a picture. Due to their low viscosity, coalescence phenomena occur making the measurement of the sizes of produced bubbles impossible. Other liquids such as: phosphoric acid, lactic acid and paraffin were alsoresearched (they’re also transparent and their viscosity is higher than water), but again no satisfactory results were obtained: the counting process was quite difficult and not accurate because of the enormous number of produced bubbles, bubbles coalescence and attached on the GAC surface (see Figure 12).Further on, only one side of the particle is visible under the microscope; more bubbles remain hidden at the other side of the GAC being thus non-detected. Therefore, using these liquids, around 0-50% of the information about the number of produced bubbles and its volume is unknown/lost, introducing a significant error in the measurement process.Comparing the obtained features (Figure 12) with the images obtained using glycerol (Figure 9) as immersing liquid, these cited problems didn’t occur. Up to now glycerol is the best immersing liquid to detect and process the bubbles.However, the chemical and physical property of the liquids and the relationship with the GAC bubbling feature must be further studied. This correlation is not simple; liquids with similar physical properties (surface tension, density and viscosity) produce different bubbling patterns. The bubbling pattern of a GAC depends not only on the chemical-physical properties (or one individual property) of the used liquid but also on the chemical-physical characteristics of the GAC surface.Conclusions
It can be stated that he use of immersion “bubblemetry” using glycerol at 25 °C as immersing liquid is able to determine differences in porous characteristics of granular activated carbons used in the rum production and thus the exhaustion level of GACs used. The determination of the immersion total volume of released bubbles per gram of GAC (VT”imm”) is proved to be successful and can be correlated with Vt of classical N2 sorption experiments. However the total pore olume value found is smaller and can be explained by the molecular size of the used liquid.No statistical differences in the bubbles diameter distribution between GAC samples were found.The possible bubble deformation process during the experiment does not affect the final measurement strategy proposed. The majority of produced bubbles was distributed around 0.1-0.2 mm in radius and can thus be considered as spherical without a significant error.The facilities and advantages of this proposed methodology for analyzing the exhaustion level of granular activated carbons can be considered as a complementary analytical technique to characterize available pore volume of high-porous materials.Acknowledgements
The authors would like to thank to the VLIR-UOS project between Belgium and Cuba for providing funding and granting the support of the current and future studies.References
- Hsieh CT, Teng H (2000) Influence of mesopore volume and adsorbate size on adsorption capacities of activated carbons in aqueous solutions. Carbon 38: 863-869.
- Ying WC (1989) In: Proceedings of the 44th Purdue Industrial Waste Conference. Chelsea MI: Lewis Publishers
- Queris Hernández O (2007) Science and technologies of distillates beverages. Research Institute of Food Industry of Cuba.
- Pino JA (2007) Characterization of rum using solid-phase microextraction with gas chromatography-mass spectrometry. Food Chem 104: 421-428.
- Pino JA, Tolle S, Gök R, Winterhalter P (2012) Characterisation of odour-active compounds in aged rum. Food Chem 132: 1436-1441.
- Neimark AV, Lin Y, Ravikovitch PI, Thommes M (2009) Quenched solid density functional theory and pore size analysis of micro-mesoporous carbons. Carbon 47: 1617-1628.
- Stoeckli F, Daguerre E, Guillot A (1999) Development of micropore volumes and widths during physical activation of various precursors. Carbon 37: 2075-2077.
- Marsh H, Heintz EA, Rodriguez-Reinoso F (1997) Introduction to Carbon Technologies. Universidad de Alicante, Secretariado de Publications, Spain.
- Klobes P, Meyer K, Munro RG (2006) Materials science and engineering laboratory. National Institute of Standards and Technology, Special Publications.
- Rouzaud JN, Clinard C (2002) Quantitative high-resolution transmission electron microscopy: a promising tool for carbon materials characterization. Fuel Process Technol 77-78: 229-235.
- Sharma A, Kyotani T, Tomita A (2000) Comparison of structural parameters of PF carbon from XRD and HRTEM techniques. Carbon 38: 1977-1984.
- Klobes P, Meyer K (2010) Measurements for solid materials. Bundesanstaltfür material for schung und - prüfung (BAM).
- Marsh H, Rodriguez-Reinoso F (2000) Science of carbon materials. Universidad de Alicante, Secretariado de Publications, Spain.
- Taylor R (1997) Carbon blacks: production, properties and applications. In: Marsh H, Heintz EA, Rodriguez-Reinoso F (Eds). Introduction to carbon technologies, Universidad de Alicante, Secretariado de Publications, pp. 167-210.
- Yang RT (2003) Adsorbents: fundamentals and applications. John Wiley & Sons Inc, New Jersey, USA, pp. 439-462.
- Rouquerol F, Rouquerol J, Sing K (2000) Adsorption by powders and porous solids: principles, methodology and applications. Academic Press, CA, USA.
- Bansal RC, Goyal M (2005) Activated Carbon Adsorption. Taylor & Francis Group, LLC, Boca Raton, Florida, USA, pp. 222-227.
- ASTM International (2011) Standard test method for determination of iodine number of activated carbon. D4607-94, West Conshohocken, PA, USA.
- Crespo Sariol H, Yperman J, Brito Sauvanell A, Carleer R, Campa JN, et al. (2016) A novel acoustic approach for the characterization of granular activated carbons used in the rum production. Ultrasonics 70: 53-63.