
Journal of Plant Biology & Soil Health
Download PDF
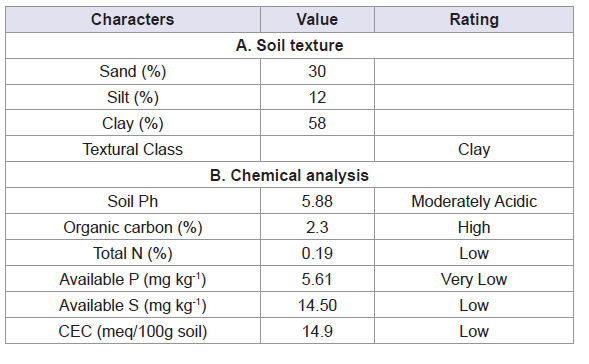 Table 1: Physico-chemical properties of the experimental site soil before planting.
 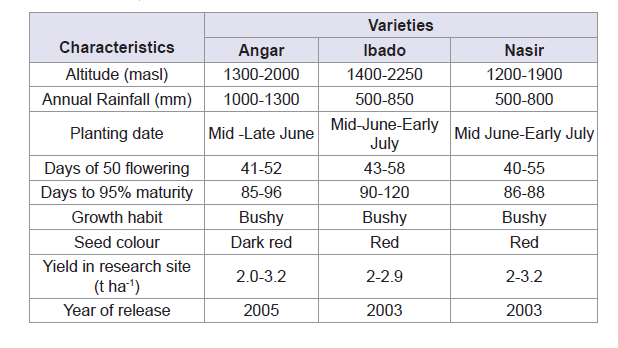 Table 2: Description of common bean varieties used for the study [41].
 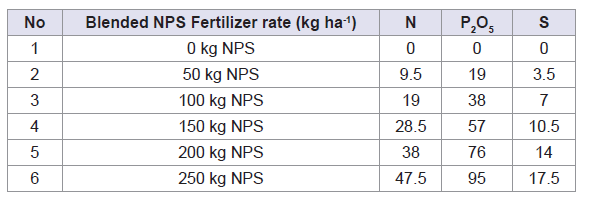 Table 3: Rate of fertilizer and their nutrient content (kg ha-1) treatments for the experiment.
 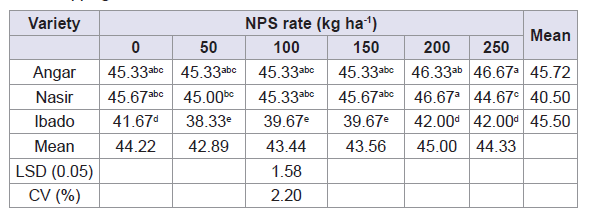 Table 4: Mean number of days to flowering of common bean as affected by the interaction of variety and blended NPS fertilizer rates at Adola during 2016-2017 main cropping season.
 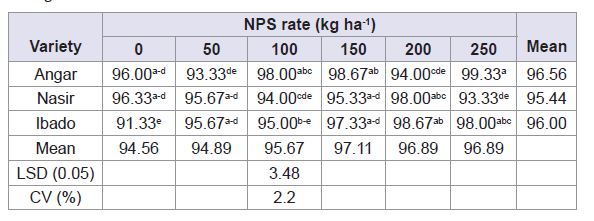 Table 5: Mean number of days to physiological maturity of common bean as affected by the interaction of variety and blended NPS fertilizer rates at Adola during 2016-2017 main season.
 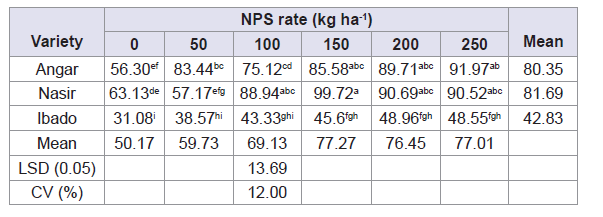 Table 6: Means of plant height (cm) of common bean as affected by the interaction of variety and blended NPS fertilizer rates at Adola during 2016-2017 main season.
 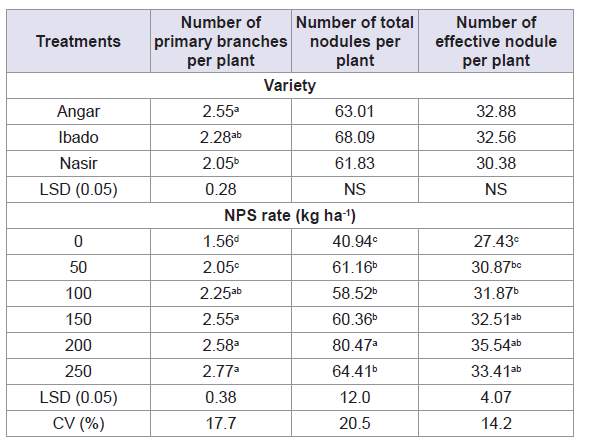 Table 7: Mean numbers of primary branches, total and effective nodules per plant of common bean as influenced by the main effects of variety and blended NPS fertilizer rates at Adola during 2016-2017 main cropping season.
 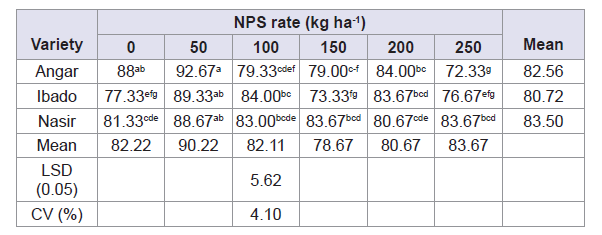 Table 8: Mean stand count per plot at harvest of common bean as influenced by interaction of variety and blended NPS fertilizer rates at Adola during 2016-2017 main cropping season.
 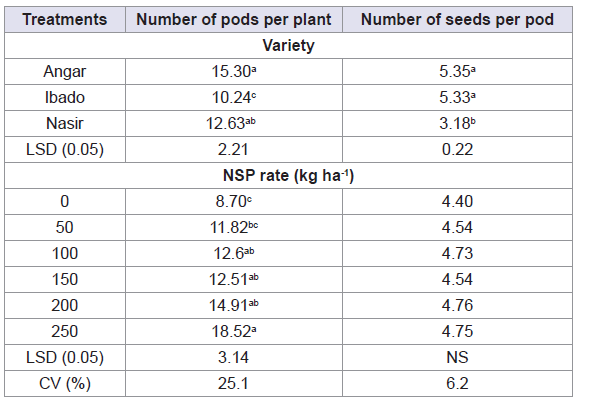 Table 9: Mean number of pods per plant and seeds per pod of common bean as influenced by varieties and blended NPS fertilizer rates at Adola during 2016-2017 main season.
 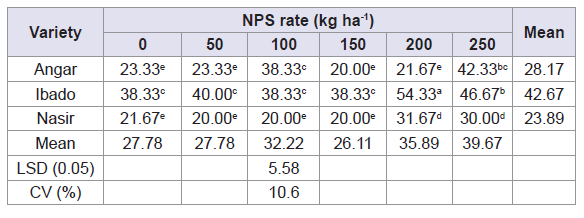 Table 10: Means of hundred seed weight (g) of common bean as influenced by interaction of variety and blended NPS fertilizer rates at Adola during 2016-2017 main cropping season.
 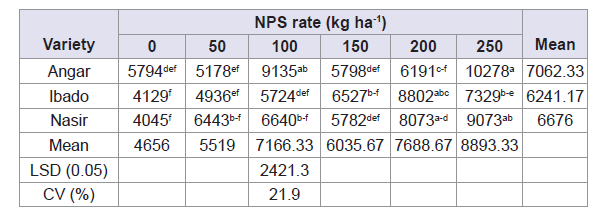 Table 11: Means of above-ground dry biomass yield (kg ha-1) of common bean as influenced by interaction of variety and blended NPS fertilizer rates at Adola during 2016-2017 main season.
 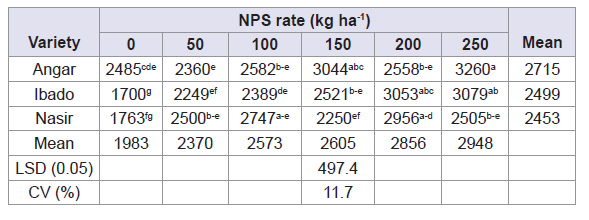 Table 12: Means of seed yield (kg ha-1) of common bean as influenced by interaction of variety and blended NPS fertilizer rates at Adola during 2016-2017 main season.
  Table 13: Means harvest index of common bean as influenced by interaction of variety and blended NPS fertilizer rates at Adola during 2016-2017 main season.
  Table 14: Result of economic analysis for response of common bean varieties to rates of blended NPS fertilizer rates at Adola 2016-2017 main cropping season.
Research Article
Response of Common bean (Phaseolus vulgaris L.) Varieties to Rates of Blended NPS Fertilizer in Adola District, Southern Ethiopia
Deresa Shumi1,2*, Demissie Alemayehu1, Tekalign Afeta1 and Belachew Debelo1
- 1Oromia Agricultural Research Institute (IQQO), Bore Agricultural Research Center (BOARC, Ethiopia, Africa
- 2Department of Plant Science (Agronomy), Madawalabu University, Bale Robe 247, Ethiopia, Africa
*Address for Correspondence: Deresa Shumi, Department of Plant Science (Agronomy), Madawalabu University, Bale Robe 247, Ethiopia, Africa, E-mail: deresashumi@gmail.com
Citation: Shumi D, Alemayehu D, Afeta T, Debelo B. Response of Common bean (Phaseolus vulgaris L.) Varieties to Rates of Blended NPS Fertilizer inAdola District, Southern Ethiopia. J Plant Biol Soil Health. 2018;5(1): 11.
Copyright: © 2018 Shumi D, et al. This is an open access article distributed under the Creative Commons Attribution License, which permits unrestricted use, distribution, and reproduction in any medium, provided the original work is properly cited.
Journal of Plant Biology & Soil Health | ISSN: 2331-8996 | Volume: 5, Issue: 1
Submission: 11 May, 2018 | Accepted: 20 July, 2018 | Published: 30 July, 2018
Keywords
Blended fertilizer; Nitrogen; Phosphorus; Sulphur
Abstract
Common bean is one of the most economically important pulse crops cultivated in Ethiopia. However, its average yield reported at national level remains far below the potential yield to be attained. This is partly due to low soil fertility management, inappropriate agronomic packages and diseases and pest problems. Hence, this experiment was conducted to investigate the effect of blended NPS rates on growth, yield and yield components of common bean varieties and to identify economically feasible rates of blended NPS at Guji Zone, Southern Ethiopia. The experiment was conducted in Adola sub-site of Bore Agricultural Research Center during the 2016-2017 main cropping seasons. The factors studied were six rates of blended NPS (0, 50, 100, 150, 200 and 250 kg ha-1) and three varieties of common bean (Angar, Ibado and Nasir). These were laid out in a factorial arrangement in randomized complete block design with three replications. Data on phonological, growth yield and yield related parameters were collected and analyzed using SAS software. The result showed that significantly the highest number of primary branches per plant (2.77) and the highest number of total pods (18.52) were recorded at the highest rate of 250 kg NPS ha-1 whereas the highest number of total nodules (80.47) and effective nodules per plant (35.54) were obtained from the application of 200 kg NPS ha-1. Among the varieties, Angar gave significantly the highest number of primary branches per plant (2.55) and number of pods per plant (15.3). The interaction of variety and blended NPS had significant effect on almost all parameters except on the number of total and effective nodules per plant, number of primary branches per plant and number of pods per plant. Variety Nasir gave the highest plant height (99.72 cm) with application of 150 kg NPS ha-1 while Ibado with application rate of 200 kg blended NPS ha-1 had the highest hundred seed weight (54.33 g). The highest grain yield (3260 kg ha-1) was recorded for variety Angar at 250 kg NPS ha-1. However, the highest net benefit (29,825 Birr ha-1) was obtained from combination of variety Ibado with application 200 kg ha-1 of blended NPS. Thus, it can be concluded that combined application of 200 kg ha-1 of blended NPS with variety Ibado proved to be superior with respect to economic advantage.
Introduction
Common bean (Phaseolus vulgaris L.), is herbaceous annual plant domesticated independently in ancient Meso-America and in the Andes, and now is grown worldwide for both dry seeds or as a green bean. Thousands of legume species exist but common bean in any form is the most eaten by human beings compared to any other legumes [1]. When common bean is used for its unripe fruit, it is termed as green bean or snap bean. About 23.9 million tons of dry bean, 20.7 million tons of green bean, and 1.9 million tons of string or common bean were produced worldwide in 2012 [2]. It is estimated that the crop meets more than 50% of dietary protein requirements of households in Sub-Saharan Africa. The annual per capita consumption of common bean is higher among low-income people who cannot afford to buy nutritious food stuff, such as meats and fish [1,3].
Common bean is highly preferred by Ethiopian farmers because of its fast maturing characteristics that enables households to get cash income required to purchase food and other household needs when other crops have not yet matured [4]. It is also an important food and cash crop in Guji zone with an area of 15,850.82 ha and average productivity of 1.52 tons per hectare. Similarly, it contributed 39.49% for household consumption, 13.33% for seed, 44.1% for sale, 0.58% animal for feed and 2.05 other uses in the study zone [5]. Improved common bean production encompasses proper use of different agronomic practices which include improved variety, seed rate, spacing, fertilizer rate and pesticide application as per recommendations [6]. However, the current national average yield of common bean (1.48 tons) is far less than the attainable yield (2500-3000 kg ha-1) under good management conditions for most improved varieties. This low yield of common bean in Ethiopia is attributed to several production constraints, which include lack of improved varieties for the different agro-ecological zones, poor agronomic practices such as low soil fertility management, untimely and inappropriate field operations [6].
A range of environmental factors, such as low soil nitrogen and phosphorus levels, and acidic soil conditions are important constraints for bean production in most areas where the crop is grown [7]. Wortmann CS also reported that low soil fertility status especially low level of N and P to be the major constraints of common bean production responsible for the loss of grain yield up to 1.2 million tons in Africa [8]. In general, an increase in grain yield and other agronomic parameters of common bean were observed as the rate of nitrogen and phosphorus increased till 27 kg N ha-1 and 69 kg P2O5 ha-1 (150 kg DAP ha-1) [7]. This fertilizer rate also gave yield advantages of 39% over the control.
Among the nutrients, nitrogen is the critical limiting element for growth of most plants including common beans due to its unavailability and poor fixation [9]. Deficiency in N causes reduced growth, leaf yellowing, reduced branching and small trifoliate leaves in beans [10]. Previous surveys estimated that over 60% of the bean production areas in Central, Southern, and Eastern Africa were affected by N deficiency. This caused yield losses of up to 40% compared to the N-fertilized areas [11]. Besides, common bean is considered to be a poor fixer of atmospheric N when compared with other crop legumes and generally responds poorly to inoculation of rhizobia in the field. As a result, common bean is being generally considered as more responsive than other legumes to N fertilization [12].
Bean N fertilizer requirement depends on soil fertility levels; for low soil nitrogen levels (below 34 kg N ha-1) N fertilizer is generally recommended in order for deficiency symptoms not to manifest and for full development up to production. Moreover, up to 60 kg N ha-1 also promotes increased nodule number, mass and size, giving highest yields [13]. However, nitrogenous activity declines with applied nitrogen, decreasing the sink strengthen, and hence, reduce the quantity of photo-assimilate partitioned to nodules and grain [14]. Early application may also result in excessive vegetative growth leading to delayed flowering, reduced pod set, lower seed yield and a greater risk of disease infestation [13].
The application of inorganic phosphorus fertilizer has positive effect on the yield and yield components of common bean. Rana NS et al. revealed that grain weight per plant exhibited a pronounced response to phosphorus application, mean values of grain weight per plant records of 13.0, 17.4 and 20.7 g due to phosphorus fertilization of zero, 50 and 100 kg P2O5 ha-1, respectively [15]. Veeresh NK observed significant increase in grain weight per plant (8.65 g) due to increased P application up to 75 kg P2O5 ha-1 [16]. Dwivedi DK et al. also reported linear increase in number of grains per pod of common bean due to increase in phosphorus fertilization from 50 to 150 kg P2O5 ha-1, but, the differences were not significant beyond 100 kg P2O5 ha-1 [17]. Saxena K et al. reported that the mean number of grains per pod linearly increased from 5.53 to 7.50 due to increased phosphorus fertilization from zero to 120 kg P2O5 ha-1 [18].
Sulfur (S) is one of the essential nutrients for plant growth and it accumulates 0.2 to 0.5% in plant tissue on dry matter basis. It is required in similar amount as that of phosphorus [19]. Sulphur plays a vital role in improving vegetative structure for nutrient absorption, strong sink strength through development of reproductive structure and production of assimilates to fill economically important sink. Sulphur nutrition of bean and other plants is important since its application not only increases growth rate but also improves the quality of the seed [20]. Total number of nodules and active nodules significantly increased with application of S up to 20 kg S ha-1 [21].
Soil fertility mapping project in Ethiopia recently reported the deficiency of K, S, Zn, B and Cu in addition to N and P in major Ethiopian soils and thus recommend application of customized and balanced fertilizers [22]. To address these nutrient deficiencies, farmers in Guji zone have been using uniform blanket application of 100 kg DAP ha-1 (18 kg N and 46 kg P2O5 ha-1) for all legumes including common bean to increase crop yields for about five decades and this did not consider soil fertility status and crop requirement. This emphasizes the importance of developing an alternative means to meet the demand of nutrient in plants by using of blended NPS that contains S in addition to the commonly used N and P fertilizers. However, no study has been done on response of common bean (Phaseolus vulgaris L.) varieties to the rates of blended NPS fertilizer in Adola District, Southern Ethiopia.
Thus, the objectives of this study were to conducted to investigate the effect of blended NPS rates on growth, yield and yield components of common bean varieties and to identify economically feasible rates of blended NPS at Guji Zone Southern Ethiopia.
Materials and Methods
Description of the study area
The experiment was conducted at Adola sub-site of Bore Agricultural Research Center (BOARC), Guji Zone, Oromia Regional State in southern Ethiopia under rain-fed conditions during the 2016 cropping season (September-December). The site (55°36'31”N, 38°58'91”E, 1721 M) is located in Adola town in Dufa ‘Kebele’ just on the West side of the main road to Negelle town. It is located at about 463 km south from Addis Ababa, the capital city of the country.
The climatic condition of the area is a humid moisture condition, with a relatively shorter growing season. The area receives annual rainfall of 1084 mm with a bimodal pattern extending from April to November. The mean annual minimum and maximum temperature is 15.93 °C and 9.89 °C, respectively. The type of the soil is red basaltic soil (Nitisols) and Orthic Aerosols [23]). The soil is clay in texture and moderately acidic with pH of around 5.88 (Table 1).
Experimental materials
Three common bean varieties, namely: Angar (medium-seeded); Ibado (large-seeded); and Nasir (medium seeded) were used (Table 2).
The variety Angar was released by Bako Agricultural Research Center in 2005. Ibado was released by Areka Agricultural Research Center in 2003 and Nasir by Melkasa Agricultural Research Center in 2003. Blended NPS (19% N, 38% PP2O5, 7% S) was used as sources of N, P and S, respectively, for the study.
Soil sampling and analysis
Pre-planting soil samples was taken randomly in a zigzag fashion from the experimental plots at the depth of 0-30 cm before planting. Twenty soil core samples were taken by an auger from the whole experimental field and combined to form a composited sample in a bucket. Then, the collected samples were air-dried at room temperature under shade and ground to pass through a 2 mm sieve for laboratory analysis of soil pH, and available phosphorus. Small quantity of this 2 mm sieved soil material allowed to pass through 0.2 mm sieve for soil organic carbon (OC) and total nitrogen. The composite soil samples were analyzed for selected physicochemical properties mainly textural analysis (sand silt and clay), soil pH, total nitrogen (N), available sulphur (S), organic carbon (OC), available phosphorus (P), cation exchange capacity (CEC) (c mol kg-1), exchangeable potassium, magnesium and calcium using the appropriate laboratory procedures at Horticoop Ethiopia (Horticultural) PLC Soil and Water Analysis Laboratory.
Soil textural class was determined by Boycous Hydrometer Method [24,25]. Organic carbon (OC) was estimated by wet digestion method and organic matter was calculated by multiplying the OC% by a factor of 1.724 [26]. Total nitrogen was analyzed by Kjeldhal method [27]. The soil pH was measured potentiometrically in 1:2.5 soil-water suspensions with standard glass electrode pH meter [28]. Cation Exchangeable Capacity (CEC) was determined by leaching the soil with neutral 1 N ammonium acetate [29]. Available phosphorus was determined by the Olsen’s method using a spectrophotometer [30]. Available sulfur (S) was measured using turbidimetric method [31]. Exchangeable potassium, magnesium, and calcium were determined by Melich-3 methods [32].
Treatments and experimental design
The treatments were factorial combinations of six blended NPS fertilizer rates (0, 50, 100,150, 200 and 250 kg ha-1) and three varieties (Angar, Ibado and Nasir) (Table 3). The experiment was laid out as Randomized Complete Block Design (RCBD) and replicated three times per treatment in factorial combination. The gross plot size was 3.0 m×2.8 m=8.4 m2. The spacing between blocks and plots was 1.0 m and 0.6 m, respectively. Each plot had 7 rows spaced 40 cm apart. One outer most row on each side of a plot and three plants (30 cm) on each end of rows were considered as border. One row next to the border rows on any side was used for destructive sampling. Thus, the net pot size was (1.6 m×2.4 m=3.84 m2) having four rows each row with 24 plants.
Experimental procedure and crop management
The experimental field was prepared by using oxen-drawn implements (local plough maresha) according to farmers’ conventional farming practices. The field was ploughed three times. The first plough was at the end of May, the second in mid July and the third during the middle of August before planting the crop to fine tilth. The plots were leveled manually. All the varieties were sown on 1 October, 2016 and 28 september, 2017. The crop was harvested manually when 90% of the leaves and pods turned yellow on 12 December, 2016 and 16 December, 2017. The dried seeds were planted by hand at a specified spacing (40 cm×10 cm) by placing two seeds per hill and later thinned to one plant per hill after emergence. All the required amount of blended NPS was applied in band during planting. Furthermore, all necessary cultural and agronomic practices were carried out uniformly for all plots as per the recommendation for the crop at all stages of growth and development. The crop was harvested manually using a sickle when 90% of the leaves and pods turned yellow on 12 December, 2016 and 08 December, 2017 and dried under the sun for 4 days before threshing. Threshing was done separately for each treatment manually.
Data collected
An effect of blended NPS rate was investigated by measuring data on phonology, growth, yield and yield component parameters. Data on phonological parameters were measured through visual observation as the number of days from sowing to when 50% of plants in a net plot had reached flowering and 90% physiological maturity. Data on growth and yield component parameters were taken in each plot from ten randomly selected plants at physiological maturity and at harvest time, respectively. For hundred seed weight and grain yield the whole plant from the net plot area was harvested and the yield per hectare was determined by converting the yield per plot (kg per plot) into kg per hectare.
Data analysis
All the measured parameters were subjected to analysis of variance (ANOVA) appropriate to factorial experiment in RCBD according to the General Linear Model (GLM) of Gen Stat 15th edition (GenStat, 2012). Significance Difference (LSD) test at 5% probability level was used for mean comparison.
Economic analysis
Economic analysis was performed using partial budget analysis following the procedure described by CIMMYT (1988) in which prevailing market prices for inputs at planting and for outputs at harvesting were used [33]. All costs and benefits were calculated on ha basis in Birr. The concepts used in the partial budget analysis were the mean grain yield of each treatment, the field price of common bean grain, and the gross field benefit (GFB) ha-1 (the product of field price and the mean yield for each treatment.
The net benefit (NB) was calculated as the difference between the gross benefit and the total cost. The average yield obtained from experimental plot was reduced by 10% to adjust with the expected farmers’ yield by the same treatment. Prices of grain (Birr kg-1) were obtained from local market for each variety: Ibado was 12 Birr kg-1 and Angar and Nasir were 8 Birr kg-1, and total sale from one hectare was computed using adjusted yield. Other costs such as cost of fertilizer (1400 Birr 100 kg-1 blended NPS) and its application cost (350 Birr ha-1) were considered as the costs that vary for treatment to treatment.
Results and Discussion
Physico-chemical properties of the experimental site soil
Soil texture is an important soil physical characteristic as it determines water intake rate (infiltration), water holding capacity of the soil, the ease of tilling, the amount of aeration, and also influences soil fertility [34]. It is one of the inherent soil properties less affected by management and determines nutrient status, organic matter content, air circulation and water holding capacity of a given soil. According to the soil textural class determination triangle, soil of the experimental site was found to be clay (Table 1). High clay content might indicate the better water and nutrient holding capacity of the soil of the experimental site.
According to the soil analysis test, the soil pH of the experimental site was 5.88 (Table 1). Thus, according to Landon JR rating, the chemical reaction of the experimental site is moderately acidic [4]. The available P level in the experimental site was which is 5.61 mg kg-1 is very low according to the rating of (Table 1) [31]. This low available phosphorus could be due to fixation in such acidic soils. The result of laboratory analysis showed that the total nitrogen percentage (0.19%) was low as per the rating of [31]. Cation exchange capacity is the capacity of the soil to hold and exchange cations. It provides buffering effect to changes in pH, available nutrients, calcium levels and soil structural changes. The result showed that the CEC of the experimental soil to be 14.9 meq/100 g soils rated as moderate according to rating of Landon JR [4]. The total carbon content in the soil was 2.3% which was rated as high as per the classification of Hazelton PA et al. [35]. Thus, the OM content of the soil was optimum as rated by EthioSIS [31]. On the other hand, the available sulphur content in the soils has values of 14.50 mg kg-1 which was rated as low as per the classification of EthioSIS [31].
Phenological and growth parameters of common bean
Days to flowering: Days to 50% flowering had significantly (P<0.05) influenced by interaction of blended NPS rate and varieties P rate (Table 4). Significantly, highest number of days (46.67 days) to reach flowering was recorded due to application of 200 kg ha-1 of blended NPS for variety Nasir and for variety Angar at NPS rate of 250 kg ha-1 while the earliest days to flowering (38.33 days) was recorded due to application of 50 kg ha-1 of blended NPS for variety Ibado (Table 4). Variety Ibado was found to be early maturing as compared to the other varieties across all NPS rates.
The result obtained from the current study revealed that the days to flowering were delayed with increment of application rate of blended NPS fertilizer which could be due to the delaying effect of nitrogen obtained from blended NPS fertilizer. This result was in line with the findings of Dargie R who reported that increasing the nitrogen rate from nil to 69 kg N ha-1 significantly prolonged the days to 50% flowering of linseed (Linum usitatissimum L.) [36]. This might be due to the fact that excessive supply of N promotes luxuriant and succulent vegetative growth, dominating the reproductive phase. This result is corroborated by that of Tewari JK et al. who reported that common bean crop supplied with nitrogen (160 kg N ha-1) required significantly more number of days to reach the growth stage of 50% flowering as compared to 40 and 80 kg N ha-1 [37]. However, Tesfaye T et al. reported that interaction of P with variety to be non-significant common bean [38].
Days to physiological maturity: Days to physiological maturity was highly significantly (p<0.01) influenced by interaction of varieties with blended NPS application rate but not significantly influenced by main effect of variety (Table 5). Physiological maturity of common bean was delayed with increase in blended NPS rate. The highest number of days required to physiological maturity (99.33 days) was recorded for the highest rate of blended NPS application rate (250 kg ha-1) for variety Angar while the shortest days to physiological maturity (91.33 days) was recorded without the NPS application for variety Ibado (Table 5).
The results indicated that days to maturity in most cases were prolonged in response to the increased levels of blended NPS which can be attributed to the role of nitrogen in the NPS that promoted vegetative growth. This is in line with the results of Gupta RP et al. who reported that nitrogen promoted vegetative and lush growth thereby delaying plant maturity of onion. This indicates that the nutrients taken up by plant roots from the soil were used for increased cell division and synthesis of carbohydrate, which will predominantly be partitioned to the vegetative sink of the plants, resulting in plants with luxurious foliage growth [39]. In contrast, Tedesse N reported that the application of sulphur (0-60 kg ha-1) had no significant effect on days to maturity on common bean [40].
Plant height: The analysis of variance showed highly significant (P<0.01) effect of varieties, blended NPS rates and their interaction on plant height at physiological maturity (Table 6). Variety Nasir showed the highest plant height (99.72 cm) with application of 150 kg NPS ha-1 where as the shortest plants (31.08 cm) was seen for Ibado without NPS fertilizer (Table 6).
Plant height was significantly increased from 31.08 cm for variety Ibado with 0 kg NPS ha-1 to 99.72 cm for variety Nasir at 150 kg NPS ha-1. The increase in plant height in response to the increased blended NPS application rate might be due to the maximum vegetative growth of the plants under higher N, P and S availability. In conformity with the current result, Moniruzzaman M et al. found that plant height was significantly increased up to 160 kg N ha-1 [41]. Also application of phosphorus at the highest level (120 kg P2O5 ha-1) increased plant height. The promotion effect of high P level on plant height of maize may be due to better development of the root system and nutrient absorption [42]. The increase in plant height might also be ascribed to better root formation due to sulphur, which in turn activated higher absorption of N, P, K and sulphur from soil and improved metabolic activity inside the plant. Similar results were reported by Jawahar S et al. where sulphur level of 40 kg ha-1 was found to increase the plant height, LAI, chlorophyll content and number of branches per plant of blackgram (Vigna mungo) [43]. Similarly, Turuko M et al. also reported that P rate at 0-40 kg ha-1 had no significant effect on plant height in common bean [44].
Number of primary branches: The analysis of variance showed highly significant (P<0.01) main effect of variety and blended NPS fertilizer application rates on number of primary branches, while their interaction did not significantly influence the number of primary branches (Table 7). Variety Angar recorded the highest number of primary branches per plant (2.55) while the lowest number of primary branches (2.05) was recorded for variety Ibado. This difference might be due to genetic differences in production of number of primary branches among the varieties. The result was consistent with the finding of Tana T et al. who reported that number of primary and secondary branches was highly significantly different among the chickpea varieties at Debre-Zeit with the desi variety Natoli had significantly higher number of primary (3.21) and secondary branches (6.73) than the Kabuli variety Acos Dubie (2.26) and (3.49) respectively [45].
The blended NPS rate had highly significant (P<0.01) effect on number of primary branches per plant. Increasing rates of blended NPS fertilizer from 0 to 250 kg ha-1 showed progressive increase in the number of primary branches per plant (Table 7). Thus, the highest number of primary branches per plant (2.77) was recorded at the highest rate of application of (250 kg NPS ha-1) and it was statistically at par with NPS rates of 200, 150, and 100 kg NPS ha-1, while the lowest number of primary branches per plant (1.56) was recorded for the control. The increase in number of primary branches per plant in response to the increased rate of blended NPS application rate indicates higher vegetative growth of the plants under higher N, P and S availability. In line with this result, Shubhashree KS reported significantly higher number of branches per plant of common bean with 75 kg P2O5 ha-1 over the control [46].
The increment in number of branches with increased rate of P might also be due to the importance of P for cell division, leading to the increase in plant height and number of branches. In line with this result, Moniruzzaman M et al. reported that the number of branches per plant increased significantly with the increase of N up to 120 kg ha-1 on common bean [41]. The increased primary branches observed under blended fertilizer might be attributed to readily available form of S that enhanced uptake of nutrients even at the initial stage of crop growth. The result was also in agreement with the finding of Jawahar S et al. who reported that application of 40 kg S ha-1 recorded highest number of branches per plant (7.75) in blackgram (Vigna mungo) [43].
Total number of nodules: The main effect of variety and interaction of variety with blended NPS rate had no significant effect on total number of nodules, but the main effect of blended NPS rate had highly significant (P<0.01) effect on total number of nodules (Table 7). Thus, the highest number of total nodules per plant (80.47) was obtained from the application of blended NPS rate of 200 kg NPS ha-1 while the lowest number of total nodules (40.94) was recorded from nil application of blended NPS fertilizer.
Application of blended NPS fertilizers significantly increased the number of nodules up to 200 kg ha-1 which might be due to better root development with increasing levels of these nutrients. But the total nodule number decreased at 250 kg NPS ha-1. The decrease in number of nodules per plant at highest rates of blended NPS might be due to increasing nitrogen application rates and thereby attributed to the negative effect of fertilizer-N on nodule formation and growth at the high rates. This result is in line with that of Chen Z et al. and Starling ME et al. who reported that high rate of nitrogen (56.58 kg N ha-1), resulted in reduction of nodule number and nodule weight in soya bean [47,48]. The result could also be ascribed to the high level of nitrogen that may have resulted in low nodule primordial initiation.
The increase in number of total nodules at 200 kg NPS ha-1 might also be due to phosphorus which is needed in relatively large amounts by legumes for growth and to promote leaf area, biomass, yield, nodule number and nodule mass in different legumes. Consistent with this result, Girma A et al. reported that nodule number was significantly increased with increasing levels of phosphorus with the lowest (12.89) and the highest (31.85) numbers in common bean obtained from the control treatment and application of 20 kg P2O5 ha-1 respectively [49].
Number of effective nodules: Blended NPS fertilizer application had significant (P<0.05) effect on number of effective nodules per plant, but main effect of variety and interaction of variety with blended NPS had no significant effect (Table 7).
Number of effective nodules per plant increased with the increasing rate of blended NPS application rate. Increasing of blended NPS fertilizer from 0 to 200 kg ha-1 enhanced the number of effective nodules per plant (Table 7). The highest number of effective nodules per plant (35.54) was recorded at the rate of 200 kg NPS ha-1 while the lowest number of effective nodules per plant (27.43) was recorded at the rate of 0 kg NPS ha-1. The increased number of effective nodules with the increase in NPS application up to 200 kg NPS ha-1 might be due to the vital role of phosphorus in increasing the number and size of nodule and the amount of nitrogen assimilated per unit of nodules. In agreement with this result, Bashir K et al. reported that phosphorus plays a vital role in increasing plant tip and root growth, decreasing the time needed for developing nodules to become active (effective) for the benefit to the host legume [50]. Similarly, Tsai SM et al. reported that application of nitrogen in the range of 22 to 33 kg ha-1 enhanced both nodulation and seed yield of French bean (Phaseolus vulgaris) [51].
The increased number of effective nodules with the application of NPS over the control might also be from increased sulphur application which might be due to the high dose of sulphur and increasing its availability along with other major nutrients. This result is in line with the finding of Ganeshamurthy AN et al. who reported significant increase in the number of active nodules of soybean with the application of sulphur up to 20 kg ha-1, at which point nodule production reached a plateau and did not increase further [21]. Scherer HW et al. also reported that formation of nodule in blackgram was increased in response to sulphur application which is involved in the formation of nitrogenous enzyme known to promote nitrogen fixation in legumes [52].
Yield and yield components
Stand count at harvest: The main effect of NPS and the interaction of varieties and blended NPS rate had highly significant (P<0.01) effect on stand count at harvest. But varieties had no significant effect on stand count at harvest (Table 8). The highest stand count per plot at harvest (92.67) was obtained at applied blended NPS rate of 50 kg ha-1 for variety Angar, whereas the lowest stand count at harvest (72.33) was recorded for variety Angar at highest rate of fertilizer application (250 kg NPS ha-1). The reduction in final crop stand count at the highest NPS rate could be due to sufficient supply of nutrients which in turn favored vigorous vegetative growth, thereby resulting in higher intra-plant competition and crowding out of weaker plants by the vigorous ones.
Number of pods per plant: Highly significant (P<0.01) effects of blended NPS fertilizer application rate and varieties were observed on the number of total pods per plant while the interaction effect did not significantly influence the number of total pods (Table 9). The highest number of total pods per plant (18.52) was recorded at application rate of 250 kg NPS ha-1 whereas the lowest number of total pods (8.7) was obtained from the unfertilized plot (Table 9).
The increase in number of pods per plant with the increased NPS rates might possibly be due to adequate availability of N, P and S which might have facilitated the production of primary branches and plant height which might in turn have contributed for the production of higher number of total pods. In conformity with this result, Moniruzzaman M et al. reported significant effect of N fertilizers on pod production per plant of French bean with the maximum number of pods per plant (25.49) obtained at 120-120-60-20-4-1 kg of N-P2O5-K2O-S-Zn-B [41]. The result is also in conformity with the finding of Deshbhratar PB et al. who reported that phosphorus application at 75 kg P2O5 ha-1 and its interaction with sulphur significantly increased the number of pods per plant of pigeon pea [53]. Similarly, Tesfaye T et al. reported that number of pods per plant increased from 2.31 to 10.62 with the increase in P rate from 0 to 39.6 kg ha-1 [38]. Thus, the increment of number of pods per plant due to application of P fertilizer confirms the fact that P fertilizer promotes the formation of nodes and pods in legumes [54]. In agreement with this result, Shanka D et al. also found that the number of pods per plant of common bean significantly increased in response to increasing rate of phosphorus up-to the highest rate (92 kg P2O5 ha-1) [55]. On the other hand, Jawahar S et al. reported that application of 40 kg S ha-1 recorded the highest number of seeds per pod of blackgram [43]. This could be due to the increasing levels of sulphur application enhanced its availability to the crop and increase photosynthetic activity of crop.
In this study, varieties also exhibited highly significant (P<0.01) difference in the number of pods per plant. Variety Angar produced the highest number of pods per plant (15.3) while the lowest number of pods per plant (10.24) was recorded for variety Ibado (Table 9). The variation in the number of pods per plant among the varieties might be related to the genotypic variation of the cultivars in producing pods. In accord with the results of the present study, different authors reported significant variations in the number of pods per plant for common bean varieties [56].
Number of seeds per pod: The interaction effect of variety and blended NPS application rates and main effects of blended NPS application rates were not significant, but the main effects of varieties had highly significant (P<0.01) effect on the number of seeds per pod (Table 9). The highest number of seeds per pod (5.35) was recorded for variety Nasir followed by Angar (5.33) whereas the least number of seeds per pod (3.18) was recorded for variety Ibado (Table 9). This indicates that the trait is mainly controlled by genetic factors than the management. Consistent with the results of this study, Mourice SK et al. observed significant variations in number of seeds per pod among common bean genotypes [57]. The variation in number of seeds per pod could be attributed to the variation in the size of seeds of the cultivars where variety Ibado with highest seed size produced lower number of seeds per pod. In agreement with this result, Fageria NK et al. also reported that the number of seeds per pod of different common bean genotypes varied in the range of 3.1 to 6 and attributed the difference due to the genetic variation of cultivars [56].
The current result is consistent with the finding of Negash F et al. who reported that the main effects of N and P as well as their interactions had no significant effect on number of seeds per pod of common bean [58]. Namvar A et al. also reported that nitrogen fertilizer had no significant influence on the number of seeds per pod of chickpea [59]. Likewise, Tedesse N et al. observed that application of sulphur up to 60 kg ha-1 had no significant effect on the number of grains per pod of common bean [40]. However, the result of the present study was in contrast with the findings of Shubhashree KS who reported that the number of seeds per pod of French bean increased significantly with the levels of phosphorus added [46].
Hundred seed weight: Hundred seed weight was highly significantly (p<0.01) influenced by varieties, blended NPS rate and their interactions interaction (Table 10). Variety Ibado with application of 200 kg blended NPS ha-1 fertilizer scored significantly the highest hundred seed weight (54.33 g) while the lowest hundred seed weight (20 g) was for variety Nasir with 100 kg blended NPS ha-1 application rate (Table 10). This might be because nutrient use efficiency by crop was enhanced at optimum level of N, P and S since grain weight indicates the amount of resource utilized during critical growth periods.
The increase in 100 seed weight with fertilizer application is in agreement with the finding of Shamim M et al. who related the increment in 100-seed weight to the influence of cell division, phosphorus content in the seeds as well as the formation of fat and albumin [60]. The increase in hundred seed weight as a result of increased P application might be attributed to important roles the nutrient plays in regenerative growth of the crop, leading to increased seed size, which in turn may improve hundred seed weight [56,61]. Similarly, Girma A et al. observed significant increase in thousand seed weights of common bean as a result of phosphorus application up to 40 kg ha-1 [49]. In conformity with this result, Gobeze L et al. found that varieties and their interactions with P fertilizer had significant effect on bean thousand seed weight [62].
In contrast to the results of this study, Negash F et al. reported that the different levels of phosphorus (46, 69 and 92 kg P2O5 ha-1) fertilizer used had not resulted in significant difference in 100 seed weight of common bean [58]. Variation in hundred seed weight might have occurred due to the presence of difference in seed size among the common bean varieties as hundred seed weight increases with increase in the seed size. In line with this result, Tanaka A et al. stated that the number of seeds per pod and weights of hundred seeds were strongly controlled genetically in field bean (Pisum sativim) [63]. The higher 100 seed weight for variety Ibado is associated with the size of the seed is in accordance with Hawtin GC et al. who explained that the larger the seed, the higher its seed weight [64].
Above-ground dry biomass yield: The above-ground dry biomass yield was significantly (P<0.01) affected by the NPS fertilizer application and the interactions of fertilizer application with variety, however, the main effect of varieties had no significant effect on biomass yield (Table 11). The result generally showed an increase in biomass production with increase in the rate of blended NPS among the bean varieties. The highest above-ground dry biomass yield (10278 kg ha-1) was recorded due to the application of highest rate of NPS fertilizer (250 kg NPS ha-1) for variety Angar followed by variety Angar at 100 kg NPS ha-1, whereas the lowest (4045 kg ha-1) biomass yield was obtained for variety Nasir under the control NPS rate (Table 11).
The increased in biomass yield of cultivars across blended NPS rates could be attributed to the fact that the enhanced availability of N significantly increased plant height, number of pods per plant and to the overall vegetative growth of the plants that contributed to higher aboveground dry biomass yield. This result was in line with that of Veeresh NK who reported that total dry matter production per plant increased significantly from 12.0 to 16.03 g due to increased nitrogen application from 40 to 120 kg N ha-1 on French bean (Phaseolus vulgaris) [16]. Similarly, Singh et al. reported that dry weight per plant significantly increased in response to increasing nitrogen levels up to 180 kg ha-1 in common bean [65].
The increment in dry matter yield with application of blended NPS fertilizer might also be due to the adequate supply of P from the NPS that could be attributed to an increase in number of branches per plant, which increased photosynthetic area and the number of pods per plant. The significant increase in the aboveground dry biomass yield in response to increasing rate of phosphorus application proves that the soil of the study area is in fact deficient in available soil P and requires external P fertilizer application for enhancing the yield of the crop. This result was in conformity with the findings of Agegnew G et al. who reported a significant linear response of above-ground dry biomass yield to phosphorus application in faba bean on acidic Nitisols [66]. Agegnew G et al. also reported that the total above-ground dry biomass yield of faba bean significantly increased with increased rate of phosphorus fertilizer application where the soil was low in available phosphorus of acidic Nitisols [67]. In contrast with this result, Tedesse N reported that application of sulphur up to 60 kg S ha-1 and interaction of nitrogen with sulphur did not result in significant effect on above-ground dry biomass of common bean [40].
Seed yield: Seed yield was significantly (P<0.05) affected by the main effect of variety, and highly significantly (P<0.01) affected due to main effects of blended NPS fertilizer rate and the interaction of varieties with fertilizer combination (Table 12). The highest grain yield was recorded for variety Angar (3260 kg ha-1) at 250 kg NPS ha-1 which was followed by Nasir (3079 kg ha-1) at similar rate of blended NPS level while the lowest yield (1700 kg ha-1) was observed for variety Ibado at control fertilizer treatment (Table 12).
Differences in seed yield among the common bean varieties might be related to the genotypic variations in P use efficiency. Hence, the cultivars which produced higher grain yield might have either better ability to absorb the applied P from the soil solution or translocate and use the absorbed P for grain formation than the low yielding cultivar. In agreement with the results of this study, Gobeze L et al. and Mourice SK et al. observed significant variations in grain yield for common bean due to genotypic variations for P use efficiency which may arise from variation in P acquisition and translocation and use of absorbed P for grain formation in common bean [57,61]. The result might be attributed to the fact that applying NPS fertilizer increases crop growth and yield on soils which are naturally low in NPS and in soils that have been depleted [68]. Similar results were reported by Murut G et al. that P application at the rate of 46 kg P2O5 ha-1 gave higher number of pods per plant and yield as compared to unfertilized plots in common bean [69].
This result is also in agreement with that of Negash F et al. who reported that the application of 27 kg N and 69 kg P2O5 ha-1 had significantly improved grain yield of common bean [58]. In line with this result, application of S with or without P recorded significantly higher seed yield up to 40 kg S ha-1 on chickpea and on blackgram [43,70]. It might also be due to increased levels of S, its availability along with major nutrients and higher uptake of crop and influencing growth and yield components of the crop, which ultimately lead to effective, assimilate partitioning of photosynthates from source to sink in post-flowering stage and resulted in highest seed yield.
Differences in seed yield among the common bean cultivars might also be related to their response to applied N. In conformity to this result, Dwivedi DK et al. found increased yield of common bean due to increasing levels of nitrogen up to 100 kg ha-1with the difference between 80 and 100 kg N ha-1 being not significant [17]. Boroomanndan P et al. also reported that seed yield of soybean increased significantly at 40 kg N ha-1 compared to the control treatment [1]. However, application of 80 kg N ha-1 decreased seed yield, indicating that there is a limit to the maximum level of nitrogen to be supplied to avoid its detrimental effect on the plant.
Harvest index
Harvest index was highly significantly (P<0.01) affected by the interaction of variety with blended NPS rate (Table 13). The highest harvest index (0.53) and lowest harvest index (0.28) were recorded for variety Angar with application of blended NPS at 150 kg ha-1 and for Nasir at 250 kg ha-1, respectively (Table 13). This might be that the higher NPS fertilizers rate had high influence on vegetative growth than nutrient translocation from plant biomass to seed. In line with this result, Singh B et al. reported the highest harvest index of lentil was obtained when 45 kg P ha-1 and 30 kg S ha-1 were applied [71].
The increment in harvest index with rates of fertilizer is in agreement with the findings of Chiezey UF et al. who related lower value of harvest index at low level of phosphorus application to poor development of plants at different growth stages of soybean [72]. Dhanjal R et al. also reported improvement in harvest index values of 31.60%, 31.99% and 33.86% due to increasing N level zero to 60 and 120 kg N ha-1 respectively [73]. Likewise, Fageria NK et al. reported that at a higher N rate the grain harvest index of common bean was also increased [56]. However, Gidago G et al. reported no significant response of harvest index of common bean to P application [74].
Economic analysis
The agronomic data upon which the recommendations are based must be relevant to the farmers' own agro-ecological conditions, and the evaluation of those data must be consistent with the farmers' goals and socio-economic circumstances [33].
The net benefit was computed due to common bean varieties, application of blended NPS fertilizer and interaction of varieties with application of blended NPS fertilizer. The economic analysis revealed that highest net benefit (29825 Birr ha-1) was obtained from combination of variety Ibado with application of 200 kg NPS ha-1 while the lowest net benefit (12692 Birr ha-1) was obtained from variety Nasir with no application fertilizer (Table 14).
Therefore, production of Ibado variety with the application of 200 kg NPS ha-1 was most productive variety for economical production compared to Angar and Nasir varieties and can be recommended for the study area. Shanka D et al. reported that planting of the cultivar Nasir produced the highest net benefit (15903.1 Birr ha-1) with acceptable marginal rate of return (3040%) compared to other cultivars at Areka [55]. Negash F et al. also reported net benefit of 21, 070 ETB ha-1 with marginal rate of return of 80% by the application of 69 kg P2O5 ha-1 at Areka [58].
Conclusions
Response of common bean (Phaseolus vulgaris L.) varieties to rates of Blended NPS Fertilizer were investigated on Nitisols and Orthic Aerosols soils of Guji Zone, Southern Ethiopia. It was conducted during the main 2016-2017 cropping season with the objective of investigate the effect of blended NPS rates on growth, yield and yield components of common bean varieties and to identify economically feasible rates of blended NPS at Guji Zone Southern Ethiopia.
The result showed that the main effects of NPS rate variety had and their interaction had a significant effect on some of growth and yield component parameters. The highest level of NPS rate (200-250 kg ha-1) resulted in higher values of number of primary branches per plant, number of total nodules, number of effective nodules and total number of pods, number of total pods per plant, highest number of total nodules and effective nodules. Varieties exhibited variation on number of pods per plant, number of primary branches and number of seeds per pod. Variety Angar gave the highest number of primary branches per plant and number of pods per plant whereas the highest number of seeds per pod was recorded for variety Nasir.
However, the interaction of variety and blended NPS had significant effect on almost all parameters except on the number of total and effective nodules per plant, number of primary branches per plant and number of pods per plant. The highest number of days to flowering and days to physiological maturity were recorded due to application of 200 kg ha-1 and 250 kg ha-1 of blended NPS respectively for variety Nasir. Variety Nasir gave the highest plant height with application of 150 kg NPS ha-1 whereas variety Ibado with application of rate of 200 kg blended NPS ha-1 had the highest hundred seed weight. The highest above-ground dry biomass yield was recorded due to the application of highest rate of fertilizer for variety Angar. The highest grain yield was recorded for variety Angar at 250 kg NPS ha-1 whereas the highest harvest index was recorded by variety Angar with application of blended NPS of 150 kg ha-1.
Based on the partial budget analysis, the highest net benefit (29825 Birr ha-1) was obtained from combination of variety Ibado with application of 200 kg NPS ha-1 whereas lowest was from variety Nasir (12692 Birr ha-1) with no fertilizer application.
Thus, it can be concluded that application of 200 kg ha-1 with variety Ibado was found to be superior and can be used for common bean production in mid-land of Adola district, Southern Oromia.
References
- Boroomandan P, Khoramivafa M, Haghi Y, Ebrahimi A (2009) The effects of nitrogen starter fertilizer and plant density on yield, yield components and oil and protein content of soybean (Glycine max L. Merr). Pak J Biol Sci 12: 378-382.
- FAO (2014) Statistics division. Food and Agricultural Organization of the United Nations.
- Broughton WJ, Hernandez G, Blair M, Beebe S, Gepts P, et al. (2003) Beans (Phaseolus spp.)-model food legumes. Plant Soil 252: 55-128.
- Landon JR (1991) Booker tropical soil manual: a handbook for soil survey and agricultural land evaluation in the tropics and sub-tropics. Longman Scientific and Technical, Longman Group, New York, USA, pp. 1-474.
- CSA (2016) Agricultural sample survey, Area and production of temporary crops, private holdings for the 2015/16, Meher season. Central Statistical Agency.
- Mulugeta A (2011) Factors affecting adoption of improved haricot bean varieties and associated agronomic practices in Dale woreda. SNNPRS, M.Sc. Thesis in Plant Sciences (Agronomy), Hawassa University, Ethiopia, Africa.
- Abebe G (2009) Effect of NP fertilizer and moisture conservation on the yield and yield components of haricot bean (Phaseolus vulgaris L.) in the Semi-arid zones of the central rift valley in Ethiopia. Adv Environ Biol 3: 302-307.
- Wortmann CS (2006) Phaseolus vulgaris L. (common bean). Record from PROTA4U. In: Brink M, Getachew B (Eds), PROTA (Plant Resources of Tropical Africa Ressources Végétales de l’Afrique Tropicale), Wageningen, Netherlands.
- Vance CP (2001) Symbiotic nitrogen fixation and phosphorus acquisition. Plant nutrition in a world of declining renewable resources. Plant Physiol 127: 390-397.
- CIAT (1986) The cultivated species of Phaseolus: study guide to be used as a supplement to the audiotutorial unit on the Same Topic. Production: Fernando Fernandez O, Cali, Colombia, USA, pp. 1-52.
- Singh SP (1999) Production and utilization. In: Singh SP (Ed.) Common bean improvement in the twenty-first century. Springer, Netherlands, pp. 1-24.
- Graham PH (1981) Some problems of nodulation and symbiotic nitrogen fixation in Phaseolus vulgaris L.: a review. Field Crops Res 4: 93-112.
- Davis JG, Brick MA (2009) Fertilizing dry beans. Colorado State University, USA.
- Streeter J, Wong PP (1988) Inhibition of legume nodule formation and N2 fixation by nitrate. Crit Rev Plant Sci 7: 1-23.
- Rana NS, Singh R (1998) Effect of nitrogen and phosphorus on growth and yield of French bean (Phaseolus vulgaris L.). Indian J Agron 43: 367-370.
- Veeresh NK (2003) Response of French bean (Phaseolus vulgaris L.) to fertilizer Levels in Northern transitional zone of Karnataka. M.Sc. (Agriculture) Thesis, University Agricultural Science. Dharwad, Karnataka, India, pp. 37-79.
- Dwivedi DK, Singh H, SingH KM, Shahi B, Rai JN (1994) Response of French bean (Phaseolus vulgaris) to population densities and nitrogen levels under mid-upland situation in north-east alluvial plains of Bihar. Indian J Agron 39: 581-583.
- Saxena K, Verma VS (1994) Growth and yield of French bean (Phaseolus vulgaris L.) as affected by NPK fertilization. Haryana J Agron 10: 211-214.
- Ali R, Khan MJ, Khattak RA (2008) Response of rice to different sources of sulfur (S) at various levels and its residual effect on wheat in rice-wheat cropping system. Soil Environ 27: 131-137.
- Clarkson DT, Saker LR, Purves JV (1989) Depression of nitrate and ammonium transport in barley plants with diminished sulphate status: evidence of co-regulation of nitrogen and sulphate intake. J Exp Bot 40: 953-963.
- Ganeshamurthy AN, Reddy KS (2000) Effect of integrated used of farmyard manure and sulphur in a soyabean and wheat cropping systems on nodulation dry matter production and chlorophyll content of soyabean on swell-shrink soils in central India. J Agron Crop Sci 185: 91-97.
- Ethiopian Agricultural Transformation Agency (ATA) (2013) Soil Analysis Report. Agricultural Transformation Agency (Unpublished).
- Etefa Y, Dibaba K (2011) Physical and socio-economic profile of Guji zone districts. Oromia Bureau of Planning and Economic Development, The National Regional Government of Oromia, Finfinne, Ethiopia, Africa.
- MoARD (2009) Animal and plant health regulatory directorate. Crop Variety Register, Ministry of Agriculture and Rural Development, Addis Ababa, Ethiopia, pp. 1-78.
- Anderson JM, Ingram JS (1993) Tropical soil biology and fertility: a handbook of methods (2ndedn). CAB International, Wallingford, UK, pp. 93-95.
- Black WA, Armstrong BI (1934) An examination of the Degtjareff method for determining soil organic matter, and a proposed modification of the chromic acid titration method. Soil Sci 37: 29-38.
- Jackson ML (1964) Soil chemical analysis. Prentice Hall, India, pp. 1-498.
- van Reewijk LP (1992) Procedures for soil analysis (3rdedn). International Soil Reference Information Center (ISRIC), Wageningen, Netherlands, pp. 1-341.
- FAO (2008) Fertilizer and Plant Nutrition Bulletin. Food and Agricultural Organization, Rome, Italy.
- Olsen SR, Cole CV, Watanabe FS, Dean LA (1954) Estimation of available phosphorous in soils by extraction with sodium bicarbonate. Department of Agriculture, Washington, USA, pp. 1-24.
- Ethiopian Agricultural Transformation Agency (ATA), Ministry of Agriculture (2014) Soil fertility status and fertilizer recommendation atlas for Tigray regional state, Addis Ababa, Ethiopia, Africa.
- Mehlich A (1984) Mehlich 3 soil test extractant: a modification of Mehlich 2 extractant. Commun Soil Sci Plant Anal 15: 1409- 1416.
- CIMMYT (1988) From agronomic data to farmer recommendations: an economics work book. The International Maize and Wheat Improvement Center, Mexico, pp. 1-57.
- Gupta RP, Sharma VP (2000) Effect of different spacing and levels of nitrogen for production of export quality onion bulbs planted on raised bed. News Letter National Horticultural Research and Development Foundation 20: 13-16.
- Hazelton PA, Murphy B (2007) Interpreting Soil Test Results: What Do All the Numbers Mean? (2ndedn). CSIRO Publishing, Victoria, Australia, pp.1-160.
- Dargie R (2015) Effect of nitrogen and sulphur fertilizer levels on growth, yield, and oil content of Linseed (Linum usitatissimum L.) in Sinana, South-Eastern Ethiopia. M.Sc. Thesis. Haramaya University, Haramaya, Africa, pp. 1-27.
- Tewari JK, Singh SS (2000) Effect of nitrogen and phosphorus on the growth and seed yield of French bean (Phaseolus vulgaris L.). Vegetable Sci 27: 172-175.
- Tesfaye T, Balcha A (2015) Effect of phosphorus application and varieties on grain yield and yield components of common bean (Phaseolus vulgaris L.). Am J Plant Nutr Fertilization Technol 5: 79-84.
- Marschner H (2012) Marschner's mineral nutrition of higher plants (3rdedn). Academic Press, San Diego, USA, pp. 1-672.
- Tedesse N, Dechassa N (2012) Effect of nitrogen and sulphur application on yield components and yield of common bean (Phaseolus vulgaris L.) in Eastern Ethiopia. M.Sc. Thesis, Haramaya University of Agriculture, Haramaya, Africa, pp. 23-25.
- Moniruzzaman M, Islam MR, Hasan J (2008) Effect of N, P, K, S, Zn, and B on yield attributes and yield of French bean in South Eastern hilly region of Bangladesh. J Agric Rural Dev 6: 75-82.
- Hussain N, Khan AZ, Akbar H, Akhtar S (2006) Growth factors and yield of maize as influenced by phosphorus and potash fertilization. Sarhad J Agric 22: 579-583.
- Jawahar S, Vaiyapuri V, Suseendran K, Kalaiyarasan C, Sriramachandrasekharan MV(2013) Effect of sources and levels of sulphur on growth and yield of rice fallow blackgram (Vigna mungo). Int Res J Chem 3: 1-7.
- Turuko M, Mohammed A (2014) Effect of different phosphorus fertilizer rates on growth, dry matter yield and yield components of common bean (Phaseolus vulgaris L.). World J Agric Res 2: 88-92.
- Tana T, Asrat A, Fikre A (2014) Response of chickpea (Cicer arietinum L.) to rates of nitrogen and phosphorus fertilizer at Debre Zeit, Central Ethiopia. M.Sc. Thesis. Haramaya University, Haramaya, Africa, pp. 1-28.
- Shubhashree KS (2007) Response of Rajmash (Phaseolus vulgaris L.) to the levels of Nitrogen, phosphorus and potassium during Rabi in the Northern Transition Zone. M.Sc. Thesis, Dharwad University of Agricultural Science, Dharwad, Karnataka, India.
- Chen Z, MacKenzie AF, Fanous MA (1992) Soybean nodulation and grain yield as influenced by N-fertilizer rate, plant population density, and cultivar in South Quebec. Can J Plant Sci 72: 1049-1056.
- Starling ME, Wood CW, Weaver DB (1998) Starter nitrogen and growth habit effects on late-planted soybean. Agron J 90: 658-662.
- Girma A, Demelash A, Ayele T (2014) The Response of haricot bean varieties to different rates of phosphorus at Arba Minch, Southern Ethiopia. ARPN J Agric Biol Sci 9: 344-350.
- Bashir K, Ali S, Umari A (2011) Effect of different phosphorus levels on xylem sap components and their correction with growth variables of Mash bean. Sarhad J Agric 27: 10-20.
- Tsai SM, Bonetti R, Agbala SM, Rossetto R (1993) Minimizing the effect of mineral nitrogen on biological nitrogen fixation in common bean by increasing nutrient levels. Plant Soil 152: 131-138.
- Scherer HW, Pacyna S, Manthey N, Schulz M (2006) Sulphur supply to peas (Pisum sativum L.) influences symbiotic N2 fixation. Plant Soil Environ 52: 72-77.
- Deshbhratar PB, Singh PK, Jambhulkar AP, Ramteke DS (2010) Effect of sulphur and phosphorus on yield, quality and nutrient status of pigeon pea (Cajanus cajan). J Environ Biol 31: 933-937.
- Buttery BR (1969) Analysis of the growth of soybeans as affected by plant population and fertilizer. Can J Plant Sci 49: 675-684.
- Shanka D, Dechassa N, Gebeyehu S (2015) Response of common bean cultivars to phosphorus application in Boloso Sore and Sodo Zuria Districts, Southern Ethiopia. East Afr J Sci 9: 49-60.
- Fageria NK, Baligar VC, Moreira A, Portes TA (2010) Dry bean genotypes evaluation for growth, yield components and phosphorus use efficiency. J Plant Nutr 33: 2167-2181.
- Mourice SK, Tryphone GM (2012) Evaluation of common bean (Phaseolus vulgaris L.) genotypes for adaptation to low phosphorus. Int Sch Res Notices Agron 2012: 1-9.
- Negash F, Rezene Y (2015) Nitrogen and phosphorus fertilizers rate as affecting common bean production at Areka, Ethiopia. J Agric Crops 1: 33-37.
- Namvar A, Sharifi RS (2011) Phenological and morphological response of chickpea (Cicer artienium L.) to symbiotic and mineral nitrogen fertilization. Žemdirbystė (Agric) 2: 121-130.
- Shamim M, Naimat A (1987) Effect of seed inoculation with Rhyzobium and N, P fertilizers on the yield of gram. Pak J Agric Res 8: 383-385.
- Zafar M, Abbasi MK, Khaliq A (2013) Effect of different phosphorus sources on the growth, yield, energy content and phosphorus utilization efficiency in maize at Rawalakot Azad Jammu and Kashmir, Pakistan. J Plant Nutr 36:1915-1934.
- Gobeze L, Legese H (2015) Evaluation of common bean varieties at P deficient and sufficient conditions in southern Ethiopia. AshEse J Agric Sci 1: 20-27.
- Tanaka A, Fujita K (1979) Growth, photosynthesis and yield components in relation to grain yield of the field bean. J Fac Agric 59: 145-238.
- Hawtin GC, Singh KB, Saxena MC (1980) Some recent developments in the understanding and improvement of Cicer and Lens. In: Summerfield RJ, Bunting AH (Eds) Advances in legume science, Royal Botanic Gardens, UK, pp. 613-623.
- Singh R, Singh Y, Singh ON, Sharma SN (2006) Effect of nitrogen and micronutrients on growth, yield and nutrient uptake by French bean. Indian Pulse Res J 19: 67-69.
- Agegnew G, Fessehaie R (2006) Response of faba bean to phosphate fertilizer and weed control on nitisols of Ethiopian highlands. Ital J Sci 2: 281-290.
- Agengew G, Tsige A (2006) The role of phosphorus fertilization on growth and yield of faba bean on acidic nitisol of central highland of Ethiopia. Ethiop J Sci 29: 177-182.
- Mullins G (2001) Phosphorus, agriculture & the environment. Virginia Cooperative Extension, Virginia state university, Publication no: 424-029, USA, pp. 1-16.
- Murut G, Tsehaye H, Abay F (2014) Agronomic performance of some haricot bean varieties (Phaseolus vulgaris L.) with and without phosphorus fertilizer under irrigated and rain fed conditions in the Tigray and Afar regional states, northern Ethiopia. Momona Ethiop J Sci 6: 95-109.
- Shivakumar BG (2001) Performance of chickpea (Cicer arietinum) varieties as influenced by sulphur with and without phosphorus. Indian J Agron 46: 273-276.
- Singh B, Kumar V (1996) Effect of phosphorus and sulphur on lentil (Lens culinaris) under rainfed condition. Indian J Agron 41: 420-423.
- Chiezey UF, Yayock JY, Shebayan JA (1992) Response of soybean (Glycine max L. Merrill) to nitrogen and phosphorus fertilizer levels. Trop Sci 32: 361-368.
- Dhanjal R, Prakash O, Ahlawat IP (2001) Response of French bean (Phaseolus vulgaris) varieties to plant density and nitrogen application. Indian J Agron 46: 277-281.
- Gidago G, Beyene S, Worku W (2011) The Response of haricot bean (Phaseolus vulgaris L.) to phosphorus application on ultisols at Areka, Southern Ethiopia. J Biol Agric Healthc 1: 38-49.