
Journal of Neurology and Psychology
Download PDF
Research Article
*Address for Correspondence: Ahmed Kamal, Ph.D, Manufacturing and Engineering Technology, Tennessee Tech University, Box 5003, Lewis Hall, Cookeville, TN 38505, USA, Tel: (931) 372-6438; Fax: (931) 372-3813; E-mail: akamal@tntech.edu
Citation: Kamal A. Assessment of Autonomic Function in Patients with Schizophrenia Using Spectral Analysis and Approximate Entropy Method. J Neurol Psychol. 2016; 4(2): 4.
Copyright © 2016 Kamal A. This is an open access article distributed under the Creative Commons Attribution License, which permits unrestricted use, distribution, and reproduction in any medium, provided the original work is properly cited.
Journal of Neurology and Psychology | ISSN: 2332-3469 | Volume: 4, Issue: 2
Submission: 22 June, 2016 | Accepted: 19 July, 2016 | Published: 25 July, 2016
 Measurement and analysis of physiological signals
 Identification procedure of frequency gain response
Assessment of Autonomic Function in Patients with Schizophrenia Using Spectral Analysis and Approximate Entropy Method
Ahmed Kamal*
- Manufacturing and Engineering Technology, Tennessee Tech University, Cookeville, TN 38505, USA.
*Address for Correspondence: Ahmed Kamal, Ph.D, Manufacturing and Engineering Technology, Tennessee Tech University, Box 5003, Lewis Hall, Cookeville, TN 38505, USA, Tel: (931) 372-6438; Fax: (931) 372-3813; E-mail: akamal@tntech.edu
Citation: Kamal A. Assessment of Autonomic Function in Patients with Schizophrenia Using Spectral Analysis and Approximate Entropy Method. J Neurol Psychol. 2016; 4(2): 4.
Copyright © 2016 Kamal A. This is an open access article distributed under the Creative Commons Attribution License, which permits unrestricted use, distribution, and reproduction in any medium, provided the original work is properly cited.
Journal of Neurology and Psychology | ISSN: 2332-3469 | Volume: 4, Issue: 2
Submission: 22 June, 2016 | Accepted: 19 July, 2016 | Published: 25 July, 2016
Abstract
Objective: Autonomic nervous system involvement in patients with Schizophrenia has rarely been studied and has shown conflicting results. Our main purpose was to demonstrate that the Schizophrenia patients have malfunction in autonomic function compared with another group of normal control subjects by using power spectra of Heart Rate Variability (extracted from ECG) and measuring the frequency gain response of the two groups. Other purpose of this study was to determine wither the duration of Schizophrenia affect of function of Autonomic nervous system using the nonlinear method approximate entropy index (ApEn).Methods: Fifty two patients with Schizophrenia and fifty one matched healthy subjects were evaluated at Neurology Center, Johns Hopkins Hospital, Maryland, USA during 2013/ 2014 by measuring the breathing at different rates and HRV signal derived from Electrocardiogram (ECG). The auto-power and cross power spectra between HRV signal and breathing signal at different breathing rate were calculated and frequency gain response for both groups were obtained. ApEn described as measure of regularity of HRV was calculated for both patients with Schizophrenia and healthy control subjects.
Results: Both frequency gain response and ApEn measure were reduced in patients with Schizophrenia in comparison with control group. The power spectra of patients with Schizophrenia showed reduced High Frequency (HF) value and higher low frequency with respect to control subjects. On other hand, ApEn measure was significantly reduced in longer Schizophrenia duration in Patients with Schizophrenia.
Conclusion: These findings suggest that the spectral analysis of HRV signal using breathing at different frequencies may detectunbalance of autonomic of autonomic system of patients with Schizophrenia specially with increasing the sympathetic activity (higher low frequency) and reducing the parasympathetic tone (reduced frequency gain response) which indicate malfunction of autonomic function (Deficit) in patients with Schizophrenia. ApEn may be used as marker for screening Schizophrenia patients for the assessment of function of autonomic nervous system related to the duration of the disease.
Keywords
Heart rate variability; Gain frequency response; Approximate entropyIntroduction
Schizophrenia as Psychotic disease may produce dysfunction in the autonomic nervous system. However, this relationship has not been fully studied and some studies has conflicting results [1,2]. Several studies found more excess cardiovascular dysfunction in Schizophrenia patients than in control [3,4, and cardiac failure including suicidal action [5]. Recent attention has focused on the importance of long term pattern in heart rate i.e. Heart rate variability (HRV) to assess and quantify the autonomic function using simple statistical measures and power spectral analysis.The main purpose of this study to investigate the auto powerspectra of HRV signals at different breathing rates as well as producing the gain frequency response for both healthy subjects group (Control) and patients with Schizophrenia group. Another aim of this study is tointroduce other statistics to assess the autonomic function developed from nonlinear dynamics. One such statistics, approximate entropy (ApEn) which quantifies the regularity of patterns in data set [6-12]. ApEn has been applied to HRV signal for both control and patients with Schizophrenia and may be considered as new method to quantify the regularity of HRV for screening Schizophrenic patients.
Materials and Methods
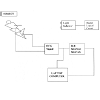
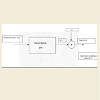
The study group was composed of fifty one healthy subjects (25 ± 8.7) years and fifty two patients with Schizophrenia (26 ± 9.6) years has been investigated in this study at Johns Hopkins hospital, MD, USA during 2013/ 2014. None of the Schizophrenia patients had clinical signs of myocardial infarction, arterial hypertension, diabetes mellitus including type I and II or pulmonary disease. No drugs that could affect HRV parameters were used by the subjects and the control groups under study. All 45 out of 52 Schizophrenic patients used either Risperidone drug and 7 used Olanzapine drug. Four Schizophrenia patients who were smoking at least one cigarette per day were excluded from this study. Therefore the final group consisted of 52 Schizophrenia patients. Each subject lies supine on a bed. The breathing signal is measured using a thermistor placed in the nose. The Electrocardiogram (ECG) is taken from wrists and ankle (Lead II). All the measurements were recorded for the duration of the experiments using laptop computer. After the subject has settled comfortably, a base line of the physiological measurements, ECG, derived HRV and breathing signal were measured for 5 min for both healthy subjects and patients with Schizophrenia at rest in supine position to calculate the ApEn and heart rate for each group. The subject is then asked to breathe deeply at different rates for 2 min following the light sequence, green inhale and red exhale. The cycle length is varied using frequency generator and the light indicator automatically divides the cycle length into 40% inhalation and 60% exhalation [8]. A rest period is allowed between each breathing rate sequence. The following breathing rates were examined for each subject 3,4,6,10,12,14,16,18,24 and 30 breath/min. Figure 1 shows the block diagram of the experiments.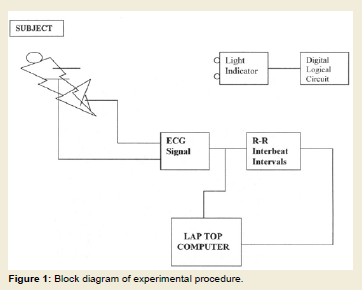
Figure 1:Block diagram of experimental procedure.
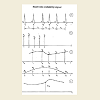
The ECG for every patient participated in this study is fed into an electronic device which detects the R-wave and measures the time until the next R wave occurs. Alternately, the peak of QRS was identified for each beat using rate-detector algorithm after exclusion of artifacts and ectopics. Those periods in which beat identification was poor were excluded from the analysis. This R-R time is converted into voltage directly proportional to that time. The reconstructed voltage signals as shown in Figure 2 may now placed as HRV signals and can be interfaced to Laptop computer to obtain auto power and cross power spectra of HRV signal and breathing signals at different rates using Fast Fourier transform (FFT) to calculate the gain frequency response and ApEn (Appendix).
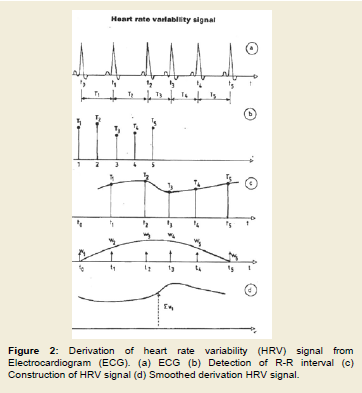
Figure 2: Derivation of heart rate variability (HRV) signal from Electrocardiogram (ECG).(a) ECG (b) Detection of R-R interval (c) Construction of HRV signal (d) Smoothed derivation HRV signal.
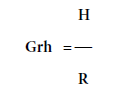
Consider a linear system with an input-output relationship as shown in Figure 3 . It can be represented by a transfer function which can be found by several conventional methods e.g. impulse response, H(jw).R(jw), where H(jw) and R(jw) are the Fourier transform (using FFT algorithm) of the output signal h(t) and input signal r(t), respectively. If we define the transfer function between H(jw) and R(jw) as shown in Figure 3 as
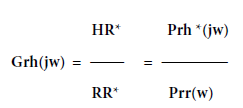
And multiply the numerator and denominator of the right side by R*(jw), i.e. the complex conjugate of the Fourier transformed input r(t), the result is
Where Prh(jw) is the complex conjugate of the cross powerspectrum between r(t) and h(t) and Prr(w) is the auto-power spectrum of r(t). Assuming that n(t) and r(t) are not auto-correlated then Prh*(jw) is not influenced by the presence of n(t). Since Prr(w) does not involve n(t) at all, this estimate of Grh(jw) from h(t) and r(t) becomes a good method of overcoming the presence of noise toestimate H/R or the frequency gain response.
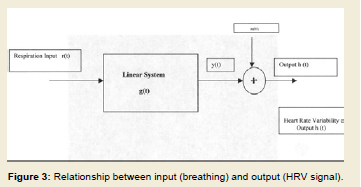
Figure 3: Relationship between input (breathing) and output (HRV signal).
Results
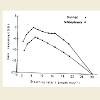
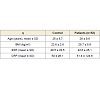
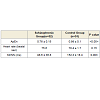
The clinical data of fifty two patients of Schizophrenia aresummarized in (Table 1). There were no significant differences between Schizophrenic patients and control in these parameters. However, the results of HRV analysis and Approximate Entropy (ApEn) are shown in Figure 4 Table 2 and Table 3. Figure 4 shows the gain frequency response for both Schizophrenic group and control group at different breathing rates. The gain frequency response of control healthy group is significantly higher (p = 0.003) than patients group with Schizophrenia. (Table 2) shows significant difference (p = 0.001) between the value of ApEn of HRV signal at rest for both groups. Table 3 shows the duration of schizophrenia in patients groups and ApEn as well as HRV parameters (heart rate, SDNN (standard deviation of all R-R intervals) at rest.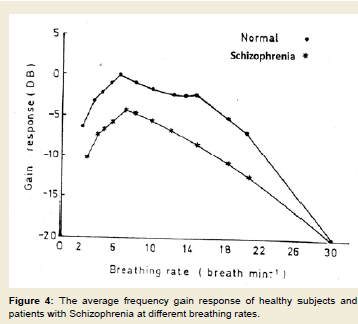
Figure 4: The average frequency gain response of healthy subjects and patients with Schizophrenia at different breathing rates.
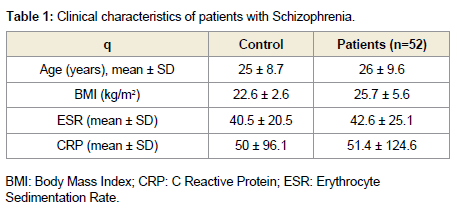
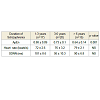
Table 1: Clinical characteristics of patients with Schizophrenia.
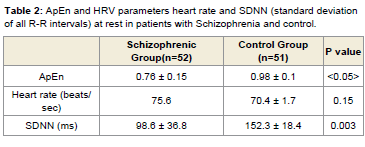
Table 2: ApEn and HRV parameters heart rate and SDNN (standard deviation of all R-R intervals) at rest in patients with Schizophrenia and control.
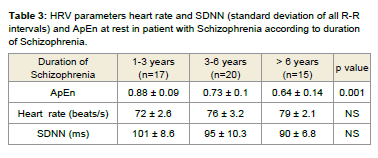
Table 3: HRV parameters heart rate and SDNN (standard deviation of all R-Rintervals) and ApEn at rest in patient with Schizophrenia according to durationof Schizophrenia.
Discussion
In this study, we introduced new index ApEn to quantify theregularity of HRV. Lower ApEn indicates greater regularity and less variation of HRV signals and higher ApEn indicates greater regularity and more variation of HRV. Appendix (A) explains the approximate Entropy method. Referring to Table 2, there is significant reduction (p ) in both ApEn and SDNN in Schizophrenia patients group. Also, Table 3 shows significant decrease in ApEn index of Schizophrenia patients related to the duration of the disease. However, SDNN and heart rate did not show significant decrease with the duration of Schizophrenia Disease. This is important finding to quantify the autonomic function of Schizophrenia patients with respect to their duration of Schizophrenia disease using ApEn index. In fact, a low ApEn correlates with greater system isolation i.e. less interaction between multiple inputs that makeup a normal control system [8,9]. Several normal physiologic processes have been studied to demonstrate the relationship between ApEn and the integrity of the biological system. Kaplan et al. compared healthy young and elderly subjects and found reduced complexity in the elderly [10]. Similarly, Rayan et al. demonstrated ApEn decreased with aging [11]. In this study, we observed the lowest normalized ApEn values inSchizophrenia patients with autonomic dysfunction. Also, we found correlation between decreasing ApEn values and Schizophrenia disease duration as shown in Table 3. The significance of ApEn index is to represent one value (between 0 and 1) which indicates the quality of connection, interaction, regularity and complexity in the system (Appendix A). Applying this concept to the autonomic nervous system of Schizophrenia patients, it seems their autonomic system lacks the integrity and interaction with respect to normal healthy subjects which may be manifested in low ApEn values in Schizophrenia patients group as shown in Table 3. The frequency gain response as shown in Figure 4 demonstrates the influence of breathing on gain response with respect to Schizophrenia patients and healthy subjects. The healthy subjects group exhibits two distinct peaks at nearly 6 cycles/min (0.1 Hz) and nearly 15 cycles/min (2.5 Hz). However, Schizophrenia patients group shows only one lower distinct peak at the same breathing rate 6 cycles/min. It is clear that Schizophrenia patients show lower gain response to breathing than the healthy subjects at all breathing frequencies. This may be attributed to decrease in autonomic function specially parasympathetic activities in Schizophrenia patients. These observations might be important with respect to the increased rate of sudden death occurred in Patients of Schizophrenia which correlated the sudden death with decreased vagus (parasympathetic) activity [6]. Our finding which correlatesthe duration of Schizophrenia disease in Patients group and ApEn may be considered a simple prognostic value to assess the autonomic function of patients with Schizophrenia to screening the autonomicfunction and interfere specially with long duration of the disease.Conclusion and Future Work
This study demonstrates the significance of using the spectralanalysis Method and Max Entropy Method in assessing the function of autonomic nervous system for Schizophrenic group compared tonormal subjects. However, further study is required to investigate more patients as well as using other quantitative methods to identify the prognosis of autonomic function with duration of Schizophrenia.Acknowledgements
The author would like to appreciate the cooperation and collaboration of Department of neurology at Johns Hopkins,Baltimore, MD, USA for facilitating the measurement of physiological signals. I acknowledge the help of Mr. Karim kamal for his help instatistical analysis of the results of this paper.References
- Fujibayashi M, Matsumoto T, Kishida I, Kimura T, Ishii C, et al. (2009) Autonomic nervous system activity and psychiatric severity in schizophrenia. Psychiatry Clin Neurosci 63: 538-545.
- Bär KJ, Boettger MK, Koschke M, Schulz S, Chokka P, et al. (2007) Non-linear complexity measures of heart rate variability in acute schizophrenia. Clin Neurophysiol 118: 2009-2015.
- Osipov M, Behzadi Y, Kane JM, Petrides G, Clifford GD (2015) Objective identification and analysis of physiological and behavioral signs of schizophrenia. J Ment Health 24: 276-282.
- Chang JS, Hwang SS, Yi SH, Kim Y, Lee YS, et al. (2015) Evaluating subjective domains of antipsychotic-induced adverse effects using heart rate variability. Psychiatry Clin Neurosci 69: 283-291.
- Birkhofer A, Schmidt G, Förstl H (2005) Heart and brain -- the influence of psychiatric disorders and their therapy on the heart rate variability. Fortschr Neurol Psychiatr 73: 192-205.
- Zahn TP (1988) Studies of autonomic psychophysiology and attention in schizophrenia. Schizophr Bull 14: 205-208.
- Pincus SM (1991) Approximate entropy as a measure of system complexity. Proc Natl Acad Sci U S A 88: 2297-2301.
- Pincus SM (1994) Greater signal regularity may indicate increased system isolation. Math Biosci 122: 161-181.
- Pincus SM, Goldberg AL (1994) Physiological time-series analysis: what does regularity quantify? Am J Physiol 266: H1643-1656.
- Kaplan DT, Furman MI, Pincus SM, Rayan SM, Lipsitz LA, et al. (1991) Aging and the complexity of cardiovascular dynamics. Biophys J 59: 945-949.
- Rayan SM, Goldberg AL, Pincus SM , Mietus J, Lipsitz LA (1994) Gender and age-related differences in heart rate dynamics: are women more complex than men? J Am Coll Cardiol 24: 1700-1707.
- Pincus SM, Gladstone IM, Ehrenkranz RA (1991) A regularity statistic for medical data analysis. J Clin Monit 7: 335-345.