
Journal of Food Processing & Beverages
Download PDF
Research Article
*Corresponding author: H. P.Dr. Xiaobo Zou, School of Food and Biological Engineering, Jiangsu University, 301 Xuefu Rd., 212013 Zhenjiang, Jiangsu, China, Tel: 86-511-88780085; Fax: 86-511 88780201; E-mail: zou_xiaobo@ujs.edu.cn
Citation: Xiao-Wei H, Xiao-Bo Z, Ji-yong S, Jie-Wen Z, Yao-Di Z, et al. Colorimetric Artificial Nose for Monitoring Traditional Solid State Fermentation Process of Vinegar Pei. J Food Processing & Beverages. 2013;1(2): 6.
Copyright © 2013 Xiao-Bo et al. This is an open access article distributed under the Creative Commons Attribution License, which permits unrestricted use,distribution, and reproduction in any medium, provided the original work is properly cited.
Journal of Food Processing & Beverages | ISSN: 2332-4104 | Volume: 1, Issue: 2
Submission: 28 August 2013 | Accepted: 25 Novmeber 2013 | Published: 04 December 2013
Colorimetric Electronic Nose Analysis
Data Analysis
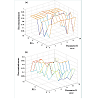
Geometrical exploration based on PCA score plots only gives the clusters trends and in this study, and our aim of this study is to classify three stages of SSF by this colorimetric sensor technique with the help of pattern recognition. In pattern recognition, the K-nearest neighbor algorithm (K-NN) is a useful method for classifying objects based on closest calibration examples in the feature space. In this work, the KNN analysis was applied to process the same data with PCA of all the samples. The results obtained by KNN provided a perfect classification result, 10 K values (K=1, 2… 10) and 9 PCs (PCs=2, 3… 10) were optimized simultaneously by the crossvalidation. As shown in Figure 5, when K=5 and PCs=4, the optimal KNN was achieved, the discrimination rates were 91.67% and 86.11% in the calibration set and prediction set, respectively. In order to validate the developed model by KNN, Thirty new samples data were obtained by the colorimetric sensor array. The classification result was 90.0%. Only three sample between the “fed-batch fermentation by layers” stage and the “face bottom” stage. One sample was from day 10 misclassified to “face bottom” stage, and two sample from day 11 misclassified to “fed-batch fermentation by layers” stage. It is often difficult to distinguish these Pei even by experimental workers.
Four groups were distinguished clearly by the colorimetric sensor array coupled with KNN. The colorimetric sensor array can avoid the influence of humidity and high corrosiveness. In addition, the colorimetric sensor array is low cost, simple, small size and portability. All these mentioned above show that the colorimetric sensor array can be used in vinegar industry.
Colorimetric Artificial Nose for Monitoring Traditional Solid State Fermentation Process of Vinegar Pei
Huang Xiao-Weia, Zou Xiao-Boab*, Shi Ji-Yonga, Zhao Jie-Wena, Zhu Yao-Dia and Sun Zongbaoa
- aSchool of Food and Biological Engineering, Jiangsu University, 301 Xuefu Rd., 212013 Zhenjiang, Jiangsu, China
- bKey Laboratory of Modern Agricultural Equipment and Technology, 301 Xuefu Rd., 212013 Zhenjiang, Jiangsu, China
*Corresponding author: H. P.Dr. Xiaobo Zou, School of Food and Biological Engineering, Jiangsu University, 301 Xuefu Rd., 212013 Zhenjiang, Jiangsu, China, Tel: 86-511-88780085; Fax: 86-511 88780201; E-mail: zou_xiaobo@ujs.edu.cn
Citation: Xiao-Wei H, Xiao-Bo Z, Ji-yong S, Jie-Wen Z, Yao-Di Z, et al. Colorimetric Artificial Nose for Monitoring Traditional Solid State Fermentation Process of Vinegar Pei. J Food Processing & Beverages. 2013;1(2): 6.
Copyright © 2013 Xiao-Bo et al. This is an open access article distributed under the Creative Commons Attribution License, which permits unrestricted use,distribution, and reproduction in any medium, provided the original work is properly cited.
Journal of Food Processing & Beverages | ISSN: 2332-4104 | Volume: 1, Issue: 2
Submission: 28 August 2013 | Accepted: 25 Novmeber 2013 | Published: 04 December 2013
Abstract
In China and Southeast Asian countries, the solid-state fermentation (SSF) process is maintained empirically, especially when to fed-batch fermentation by layers. The SSF process of Chinese vinegar is typical fed-batch fermentation by layers. It generally lasts about 18 days and is divided into four stages according to the aroma. A new electronic nose technique was developed based on colorimetric sensor array for identifying the four stages and controlling the quality of SSF. Twelve chemically responsive dyes including nine pH indicators and three porphyrins materials were selected according to their sensitivity to volatile compounds typically occurring during SSF process of vinegar. When the sensor array was exposed to vinegar, a color change profile for each sample was obtained by differentiating the image of sensor array before and after exposure to the head-gas of the sample. The values of RGB (i.e., Red, Green, and Blue) color components were extracted from each dye in color change profiles, and they were analyzed using principal component analysis (PCA) and K-nearest neighbour analysis (KNN). In comparison to PCA, KNN obtained an optimum identification result, the discrimination rates were 91.67% and 86.11% in the calibration set and prediction set, respectively. This research shows that the colorimetric sensor array could be a simple method for online monitoring and controlling the fermentation process of SSF.Keywords
Vinegar Pei; Solid-state fermentation; Colorimetric sensor array; Principal component analysis (PCA); K-nearest neighbour analysis (KNN)Introduction
In China and Southeast Asian countries, the SSF process is maintained empirically, especially when to fed-batch fermentation by layers. This process without modifications because there are too many uncertainties and misunderstandings about fed-batch fermentation by layers. Therefore, it is necessary to guarantee the good quality vinegar products for consumers. There has very little research on the solidstate fermentation process. Hubert has reviewed the history of vinegar but it does not discuss in any detail about solid-state fermentation [1]. Xu Wei monitored the microbial community during solid-state acetic acid fermentation of Zhenjiang aromatic vinegar [2]. Therefore, it is necessary to develop a rapid, nondestructive method to monitor the different stages of acetic-acid formation process.Chinese traditional vinegars, including Zhenjiang aromatic vinegar, Shanxi old mature vinegar, Jiangzhe Rouse vinegar, Fujian Monascus vinegar and Sichuan bran vinegar, are all produced bysolid-state fermentation (SSF). However, many studies work on liquid state fermentation in western countries [3], little publications in English on vinegar production by solid-state fermentation have appeared in the last 20 years [4]. The vinegar Pei is semi-solid substrates by mixing alcohol mash with the wheat bran and rice hull. The fermentation culture of vinegar Pei is taken place in a series of two open containers (big jar or basin). The SSF generally lasts about 18 days, and the temperature and humidity of fermentation culture is retained at 40~46°C and 60~70%, respectively [2]. According to the aroma raised by vinegar Pei, the SSF process usually is divided into four stages by workers. Firstly, “formation of vinegar Pei”, a certain amount of rice wine (about 14% ethanol, v/v) is mixed with wheat bran, rice hull, and so-called vinegar seeds to form a semisolid substrates in the first container (half volume), at the first day [4]. Secondly, “raise the temperature of vinegar Pei”, at 2-3 days, the vinegar Pei is covered by a straw mat. As the micro fermentation, the temperature raised from room temperature to 40~46°C [4]. Thirdly, “fed-batch fermentation by layers”, the vinegar Pei is divided in 10 layers. Every 24hours, the top layers is mixed with fresh rice hull to increase porosity and transferred to the second container. After 10 days, the first container is thus empty and the second one full [4]. Fourthly, “face bottom”, ethanol oxidation and acetic-acid formation mainly take place in the top layer of the second container, which is exposed to the air [4]. It needs to overturn the layers of vinegar Pei, by turn the bottom layer to the top layer. Therefore, the workers could see the bottom of the pot at 11-18 days. Traditionally, feeding and mixing was done manually. Aroma is possibly the most important factor in identify the vinegar Pei at different days for workers. The two basic techniques used to assess aroma, sensory analysis and conventional gas chromatography-mass spectrometry (GC-MS), are generally too time-consuming, complex and labour intensive for routine quality application [5]. Therefore, a gas sensor system, also termed electronic nose that mimics the human sense of olfaction and thus measures smells is a very promising technique for rapid analyzing the solidstate fermentation stages of vinegar characterization. But the vinegars have high corrosiveness often poison mental oxide gas sensors. Normal electronic nose, which is based on mental oxide sensors, is not suit for vinegar analysis [6].
Recently, Suslick and Neal [7] developed a colorimetric sensor array for gas analysis. The colorimetric sensor array is based on chemo-responsive dyes, which contain a center to interact strongly with analytes, and this interaction center must be strongly coupled to an intense chromophore. The chemoresponsive dyes can change color, in either reflected or absorbed light, upon changes in their chemical environment [7]. Common pH indicator dyes change color in response to changes in the proton (Brønsted) acidity or basicity of their environment. Porphyrins and their metal complexes are a natural choice for recognition of analytes with Lewis acid/base capabilities. Metallo porphyrins are nearly ideal for the detection of metal-ligating vapors because of their open coordination sites for axial ligation, their large spectral shifts upon ligand binding, and their intense coloration [7,8]. Colorimetric sensor arrays have been designed for the identification and quantification of different analytes such as molecular recognition [7], aliphatic amines [9], traditional vinegars [10] and amino acids [11]. Our group previous research [12] also has applied colorimetric sensor array to monitor vinegar acetic fermentation, but not every day. Researches mentioned above show that the colorimetric sensor array has huge potential in the analysis of food process.
The object of this study was to develop a new electronic nose technique based on colorimetric sensor array for rapidly discriminating different stages of solid-state fermentation process.
Materials and Methods
Vinegar Pei samples
The vinegar Pei samples used in this study were collected in November, 2012 from Jiangsu Hengshun Vinegar Industry Co., located in the eastern coastal province of Jiangsu. Nine samples per day were collected by laid 30g vinegar Pei in a sterile plastic bag. The nine samples are collected in three jars. For every jar, the three samples are collected from the top, middle and bottom of jar. During 18 days SSF process, 162 samples were obtained. After sampling, samples were taken to the lab immediately for analysis within 2 hours.
Reference measurement
Analysis volatile compounds of samples using GC-MS: After sampling, vinegar Pei were taken to the lab immediately and stored at 20°C before further analysis. The volatiles were sampled with an SPME-fibre (75 mm carboxen/ polydimethylsiloxane) in 1 minute. The fibre was thereafter transferred to the injection port of the gas chromatograph and desorbed at 250 [13]. To ensure the samples were not oxidized during storage before a run on GC/MS, only one sample was analysed at a time. The gas chromatograph was a Varian Star 3400 CX coupled with a Varian Saturn 2000 mass spectrometer. The column was a DB-1701, length of 30m, 0.25mm, (i.d. 1 mm) operated with a gas flow of 0.8 ml/min at 40°C. The temperature gradient started at 40°C and was held at that temperature for 4min until a gradient with an end temperature of 100°C with an increase of 5°C /min was initiated [14]. The temperature of 100°C was held for 5min, and then a column cleaning gradient was initiated with an increase of 8°C /min to 230°C and held at 230°C for 7minutes. The mass spectrometer had a mass range of 35-400 m/z with a scan time of 1s in electron impact mode with electron energy of 70eV and an electron multiplier voltage of 350V. The chromatograms were integrated and the retention times and peak areas, transferred to an Excel spreadsheet. Peaks with retention time of more than 40 min were deleted as they were high boiling compounds with no aroma. The data were then aligned in an aligning program (Borggaard, 2000) with sample no. P-I-5 as reference chromatogram and the lowest area limit was set to 5000.
Acid analysis
Acid analyses were in accordance with the Official Methods of Analysis for Chinese vinegar (GB/T 5009.41-2003) (GB means national standard; 5009.41 was the codes of the official methods; and 2003 was the year in which the methods were revised). 10g sample was treated with 30ml distilled water, sufficiently whisked together and laid up 30min. The vinegar cultures were filtered by three layers of gauze and discarded to get the filtrate. The pH value of the solution was then measured by a pH meter (PHS-25C, Shanghai).
Colorimetric Electronic Nose
Colorimetric sensor array: The selected of the colorimetric material to design sensor array chip was based on these three fundamental requirements [7,15,16]: First, the formulation must react strongly with one or more analytes. The interaction must not be simple physical adsorption, but rather must involve stronger chemical interactions. Second, the reaction site must be strongly coupled to an intense chromophore such that reaction with an analyte leads to a measurable color change. Third, the formulation must not be so reactive that it precludes reproducible manufacturing and longterm stability during storage. Given that the goal of this work was the development of a porphyrins and pH indicators colorimetric sensor that would identify the volatile organic compounds, the colorimetric sensor array must possess chemoresponsive dyes which react specifically with acids, aldehydes, ketones, alcohols and have the required range of chemical sensitivity.
To optimize the colorimetric sensor array, we examined several commercially available sensing materials. Finally, nine pH indicators and three porphyrins materials were selected. The nine types of pH indicators were obtained from Sinopharm Chemical Reagent Co., Ltd, including: (1) Leucomalachite green, (2) Screened methyl orange, (3) Neutral Red, (4) Naphtholphthalein, (5) Thymol Blue, (6) Congo red, (7) Bromothymol Blue, (8) Bromocresol Green, (9) Thymolphthalein.Three porphyrins or metalloporphyrins materials were purchased from Sigma Chemical (USA), including: (1) Zinc 2, 3, 9,10,16,17, 23, 24-octakis (octyloxy)-29H, 31H-phthalocyanine,(2) 5,10,15,20-Tetrakis(4-methoxyphenyl)-21H,23H-porphine iron(III) chloride,(3) 5,10,15,20-Tetraphenyl-21H,23H-porphine.a
The colorimetric arrays of chemoresponsive dyes were created by printing the dyes on C2 reverse phase silica gel plates using microcapillary pipettes.
The Figure 1 shows the images of the sensor array before and after exposure to analyte.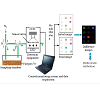
Imaging of the Sensor Array
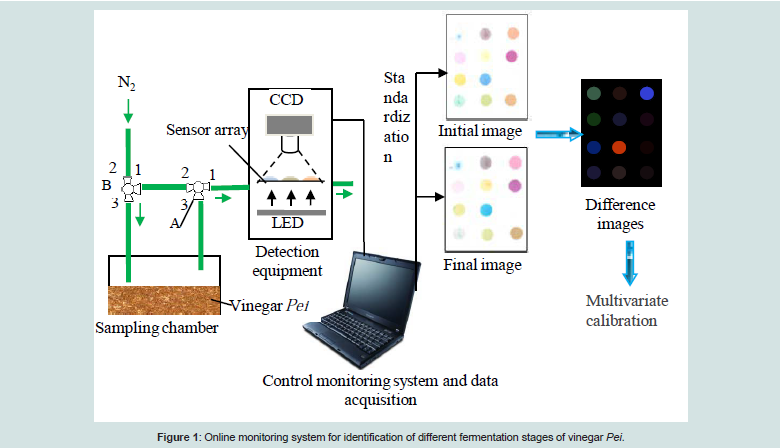
Figure 1: Online monitoring system for identification of different fermentation stages of vinegar Pei.
According to our pre-experiment [10-17], a detection system for vinegar Pei differentiation was constructed and the schematic diagram was shown in Figure 1. The measurement process is as follows: 1) gas producer equipment was kept constant temperature at 25±0.5°C, (2) vinegar Pei was placed into sampling chamber, (3) a colorimetric array was placed in detection equipment, (4) the threeway valve A and three-way valve B was turned on connecting tube 2 with tube 1, initial images were acquired by the flatbed scanner before the sensor array was first exposed to a flowing stream of N2 without volatile organic compounds, and (5) odor streams containing the VOCs of interest were generated by flowing N2 through the sampling chamber containing vinegar Pei sample in a thermostatic state, while valve A was switched on connecting tube 2 with 3 and valve B was connecting 3 with 1. At the end of experiment, gas of vinegar Pei was discharged by nitrogen after every trail.
Data Processing and Multivariate Analysis
To avoid factitious nonuniformity, the center of each dye spot was averaged. A difference image which showed color changes on the sensor array for each sample was obtained by subtracting the before exposure image (initial image) from the after-exposure image (finial image), i.e., red value after exposure to the VOCs of sample minus red value before exposure, green minus green, blue minus blue. The color change profiles were a simple 3N-dimensional vector (where N=number of dyes) that can be easily analyzed by standard statistical and chemometric techniques. Each analyte response represented three color components (i.e. R, G, and B); thus 12 dyes have 36 variables (i.e. 12 dyes ×3 color components). Each of the 36-dimensional vector would have one of the 256 possible values, rarely covered the entire 256 range. Usually, the RGB color components extracted from the difference image did not cover the full range of 0-255; rather, for improved display, the color of the difference image was enhanced by expanding the displayed color range to 0-255 (i.e., 8 bit color).Multivariate analysis methods play an important role in differentiating vinegar Pei at different fermentation days using colorimetric sensor array. PCA and KNN were applied comparatively in this work using RGB data of difference images. PCA is an unsupervised pattern recognition method [18], while KNN is a supervised pattern recognition method [18-23]. Herein, we have systemically studied and compared PCA and KNN in data analysis, in order to achieve an optimum classification capacity of the proposed method in this work.
Software
The colorimetric sensor array data acquisition was compiled by us based on Visual C++ V6.0 (Microsoft, USA). All algorithms were implemented in Matlab R2012a (Matworks Inc., Natick, MA, USA).
Results and Discussion
Sample investigation
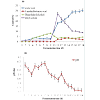
In this research work, the volatile compounds have been identified in the vinegar Pei at different fermentation stages by SPME-GC-MS. Figure 2(a) shows that the main volatile component content changes during 18 days fermentation process of vinegar Pei. The pH values of the vinegar Pei have been measured at different fermentation stages. Figure 2(b) shows that the pH value changes during 18 days solid-state fermentation of vinegar Pei. At the primary stage of solidstate fermentation (day1-day3), acetic acid and ethyl esters content increases. The phenylethyl alcohol and 3-methylbutanoic acid of vinegar Pei was not detected. The pH value were declined and at 3.88-4.01. At the “fed-batch fermentation by layers” (day4-day10), the pH value variation was complicated, may be explained by the occurrence of new volatile species in the headspace of vinegar Pei, such as phenylethyl alcohol. The ethyl esters increase at this process and then remain almost constant. At the later stage of solid-state fermentation (day11-day18), the ethyl esters were obtained by esterification of alcohol and acetic acid. The ethyl acetates was declined sharply, and the acetic acids were increase. At this time, the ethanol may be converted to acetic acids by the lactic acid bacteria. So during the SSF process, the pH value variation was complicated during the four stages as shown in Figure 2(b).
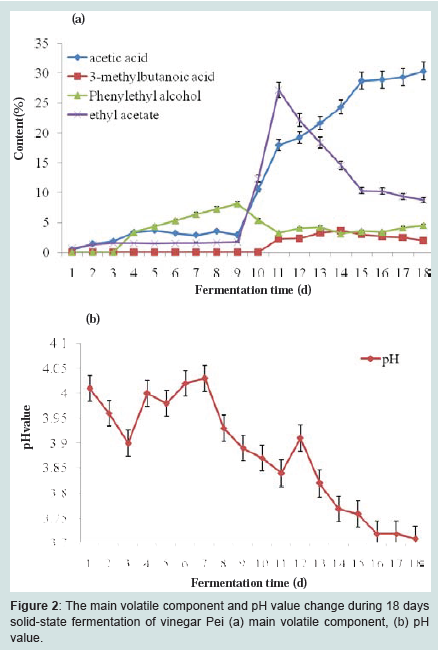
Figure 2: The main volatile component and pH value change during 18 days solid-state fermentation of vinegar Pei (a) main volatile component, (b) pH value.
Colorimetric sensor responses: The color change profiles obtained from the difference images are characteristic of dye interactions with vinegar Pei samples. Even the same combination of VOCs at a different species and concentration may be considered a different odor mixture. Thus, this kind of array-based sensing is a powerful tool for the detection of chemically diverse analytes by producing specificity, not from any single sensor, but as a unique composite response for each specific analyte mixture.
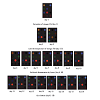
Figure 3 shows the difference images of vinegar Pei during the 18 fermentation days. The difference images, which were obtained by subtracting the before-exposure images from the after-exposure images, showed more distinct color changes on the sensor array for each sample, thus making it more convenient to extract quantitative features for further analysis. Figure 3 clearly presents the characteristic color fingerprints of each sampling day. It confirmed the possibility of using a chromogenic array to monitor the SSF process of vinegar. Two clear tendencies in color differences can be observed. Firstly, almost all the dyes changed color and enhanced color change strength was noted during SSF. The former indicates that all the dyes were affected by volatile organic compounds change during the SSF process. They all contributed to outline the patterns. Secondly, the changes of pH indicator dyes are more obvious than porphyrins and their metal complexes. This may be because each pH indicator has its specific colorific fingerprint to the pH value. The pH value has changed markedly during the fermentation process. The nine pH indicator dyes in the sensor array may also change their optical property with the change of volatile organic acid in VOCs. However, colors of some dyes spots were nearly the same, their difference were not obvious. Hence, it was difficult to distinguish the vinegar Pei at four fermentation stages from their different images by our naked eyes. Multivariate analysis can help to distinguish them.
Figure 3: Colorific difference images for vinegar Pei at different fermentation days.
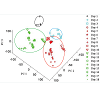
In the colorimetric sensor array, every dye has a 3-dimensional vector (red, blue and green differences). The color change profiles are a 3N-dimensional vector. In this study, each analyte is represented for the 4 × 3 array. Thirty-six characteristic values (i.e., 12 red, green, and blue color difference values) for each sample were extracted from their difference images, and were used for PCA analysis. The first three PCs accounted for 69.98% of the total variance (PC1 = 33.55%, PC2 = 24.29%, PC3 = 12.14%). As shown in Figure 4, a three-dimensional PCA score plot using the three most important principal components. The samples from the first fermentation day were clear distinguished, which in mainly because the VOCs were relatively low. The data measured corresponding to 2 though 3 fermentation days were some overlapped, and this also happened during 4 to 10 fermentation days. It is mainly because the variation of the pH value at day2-day3 and day8-day10 were relatively similar. The VOCs differences between these samples might be small in the early fermentation stages (day 2-day 6). Samples at the 11th to 18th day of fermentation could be separated easily from those for earlier days, which is mainly because acids and esters increased and the pH value declined sharply.
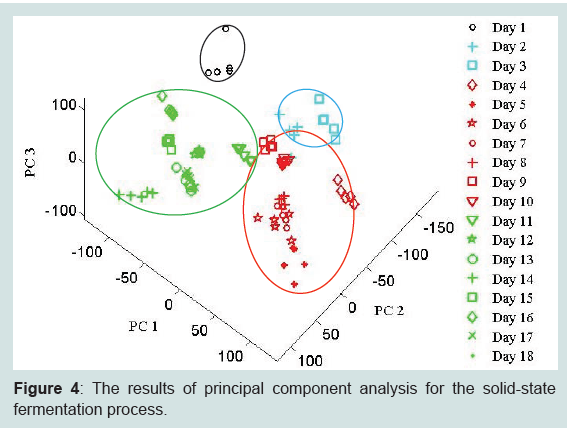
Figure 4: The results of principal component analysis for the solid-state fermentation process
Zhenjiang vinegar is abundant in many flavor compounds, containing alcohols esters, aldehydes, organic acids, etc. Meanwhile, the colorimetric sensor array device gives over-all result of vinegar Pei volatile compounds. pH indicators, porphyrins and metalloporphyrins can bond with various volatile organic compounds [7], generating color changes, which make the possible of detecting vinegar using the proposed method in this research. PCA and KNN were used comparatively to process the data extracted from color difference profiles of vinegar samples, to help in distinguishing vinegar Pei at different solid-state fermentation stages. And eventually, we achieved good classification results using this novel artificial olfactory technique based on colorimetric sensor array. Compared with previous researches, our work shows its own superiority both in results and the operability of system. In the data analysis, KNN obtained a better classification result compared with PCA, in this work.
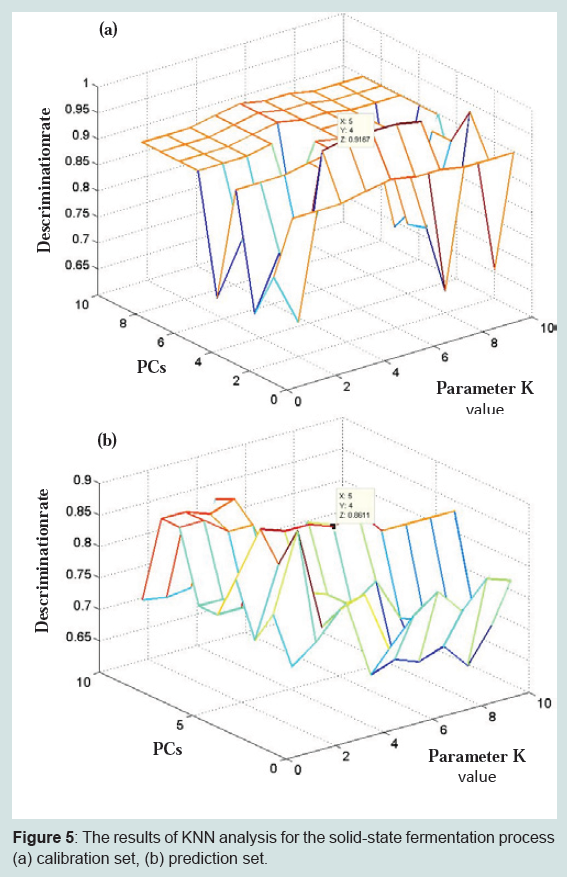
Figure 5: The results of KNN analysis for the solid-state fermentation process (a) calibration set, (b) prediction set.
Conclusion
A colorimetric sensor array was developed for discriminating vinegar Pei at different solid-state fermentation stages. The colorimetric sensor array was made from nine pH indicators and three porphyrins or metalloporphyrins materials printed on a C2 reverse phase silica gel plates. PCA and KNN were used comparatively to analysis data for discriminating vinegar of different groups, and optimum identification result was achieved by KNN. It can be concluded that this colorimetric sensor array is an effective tool for identifying of distinguishing vinegar Pei at different solidstate fermentation stages, which has a great guiding significance for monitoring the quality of solid-state fermentation process of vinegar.Acknowledgements
The authors gratefully acknowledge the financial support provided by the foundations of Chinese 863 Program, (Grant No. 2011AA00807), the Chinese Excellence Doctor Foundation (Project Nos. 200968), New Century Excellent Talents in University (NCET-11-0986), Foundation for independent innovation of agricultural sciences in Jiangsu province (CX(11)2028) PAPD, Science and technology support program of Zhenjiang (NY2011026), Program sponsored for scientific innovation research of college graduate in Jiangsu province (CXZZ13_0697). We also wish to thank many of our colleagues for many stimulating discussions in this field.References
- Hurst RD, Wells RW, Hurst SM (2010) Blueberry fruit polyphenolics suppress oxidative stress induced skeletal muscle cell damage in vitro. Mol Nutr Food Res 54: 353-363.
- Xu W, Huang Z, Zhang X, Li Q, Lu Z, et al. (2011) Monitoring the microbial community during solid-state acetic acid fermentation of Zhenjiang aromatic vinegar. Food Microbiol 28: 1175-1181.
- Maldonado O, Rolz C, Schneider S (1975) Wine and Vinegar Production fromTropical Fruits. J Food Sci 40: 262-265.
- Liu D, Zhu Y, Beeftink R, Ooijkaas L, Rinzema A, et al. (2004) Chinese Vinegar and its Solid-State Fermentation Process. Food Rev Int 20: 407-424.
- Xiaobo Z, Jiewen Z (2008) Comparative analyses of apple aroma by a tinoxide gas sensor array device and GC/MS. Food Chem 107: 120-128.
- Zou X, Shi J, Hao L, Zhao J, Sun Z, et al. (2012) Distinguishing Four Traditional Vinegars by Sensory Analysis and Colorimetric Sensors. J Texture Stud 43: 413-419.
- Suslick KS, Neal A Rakow, Sen A (2004) Colorimetric sensor arrays for molecular recognition. Tetrahedron 60: 11133-11138.
- Suslick BA, Feng L, Suslick KS (2010) Discrimination of Complex Mixtures by a Colorimetric Sensor Array: Coffee Aromas. Anal Chem 82: 2067-2073.
- Montes-Navajas P, Baumes LA, Corma A, Garcia H (2009) Dual-response colorimetric sensor array for the identification of amines in water based on supramolecular host-guest complexation. Tetrahedron Lett 50: 2301-2304.
- Zou X, Li Y, Shi J, Huang X, Zhao J (2012) Traditional Vinegars Identification by Colorimetric Sensor. Procedia Chem 6: 20-26.
- Huo D, ZHang G, Hou C, Dong J, ZHang Y, et al. (2010) A Colorimetric Sensor Array for Identification of Natural Amino Acids. Chinese J Anal Chem 38: 1115-1120.
- Chen Q, Liu A, Zhao J, Ouyang Q, Sun Z, et al. (2013) Monitoring vinegar acetic fermentation using a colorimetric sensor array. Sensors and Actuat B Chem 183: 608-616.
- Hansen T, Petersen MA, Byrne DV (2003) Sensory based quality control utilising an electronic nose and GC-MS analyses to predict end-product quality from raw materials. Meat Sci 69: 621-634.
- Li C, Schmidt NE, Gitaitis R (2011) Detection of onion postharvest diseases by analyses of headspace volatiles using a gas sensor array and GC-MS. Food Sci Technol- LWT 44: 1019-1025.
- Zhang C, Bailey DP, Suslick KS (2006) Colorimetric Sensor Arrays for the Analysis of Beers: A Feasibility Study. J Agric Food Chem 54: 4925-4931.
- Zhang C, Suslick KS (2007) Colorimetric sensor array for soft drink analysis. J Agric Food Chem 55: 237-242.
- Huang X, Xin J, Zhao J (2011) A novel technique for rapid evaluation of fish freshness using colorimetric sensor array. J Food Eng 105: 632-637.
- Lee S, Chung H, Choi H, Cha K (2010) Using combinations of principal component scores from different spectral ranges in near-infrared region to improve discrimination for samples of complex composition. Microchemical J 572: 96-101.
- Balabin RM, Safieva RZ, Lomakina EI (2011) Near-infrared (NIR) spectroscopy for motor oil classification: From discriminant analysis to support vector machines. Microchemical J 98: 121-128.
- Berrueta LA, Alonso-Salces RM, Héberger K (2007) Supervised pattern recognition in food analysis. J Chromatogr A 1158: 196-214.
- Chen Q, Cai J, Wan X, Zhao J (2011) Application of linear/non-linear classification algorithms in discrimination of pork storage time using Fourier transform near infrared (FT-NIR) spectroscopy. Food Sci Technol- LWT 44: 2053-2058.
- Pérez-Marín D, Fearn T, Guerrero JE, Garrido-Varo A (2009) A methodology based on NIR-microscopy for the detection of animal protein by-products. Talanta 80: 48-53.
- Jiang H, Liu G, Xiao X, Mei C, Ding Y, Yu S (2012) Monitoring of solid-state fermentation of wheat straw in a pilot scale using FT-NIR spectroscopy and support vector data description. Microchemical J 102: 68-74.