
Journal of Forensic Investigation
Download PDF
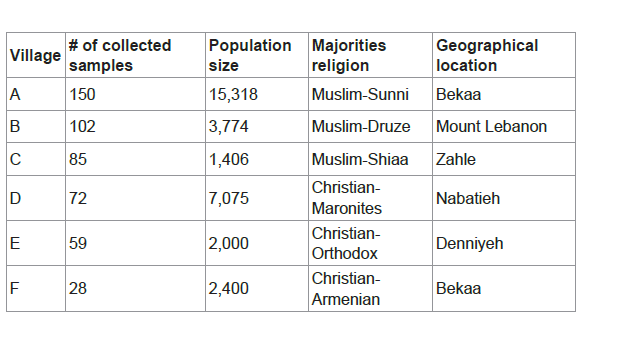 Table 1: Number of collected samples and villages’ background.
 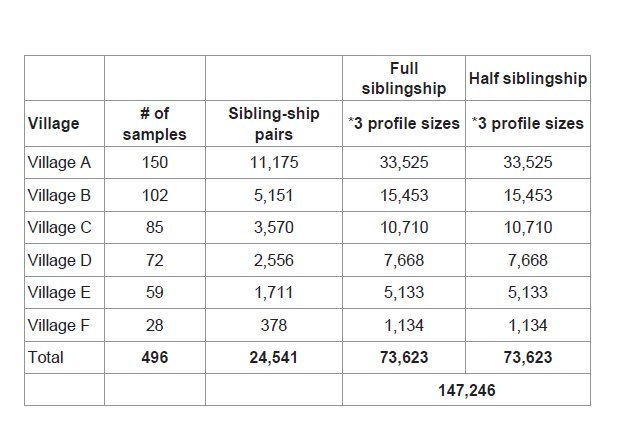 Table 2: Total number of simulations performed on full and half sibling-ship, using Lebanese allele frequencies and 15, 23 and 28 loci.
 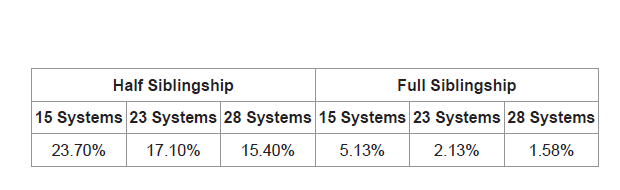 Table 3: Percent of false positives (LR values >1 supporting genetic relatedness among unrelated individuals).
 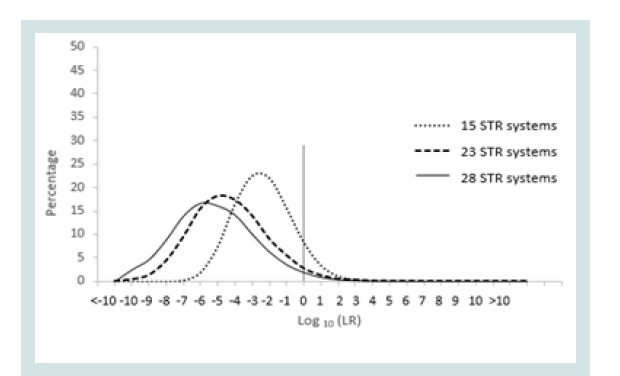 Figure 1: Full siblingship LR distribution of unrelated pairs.
 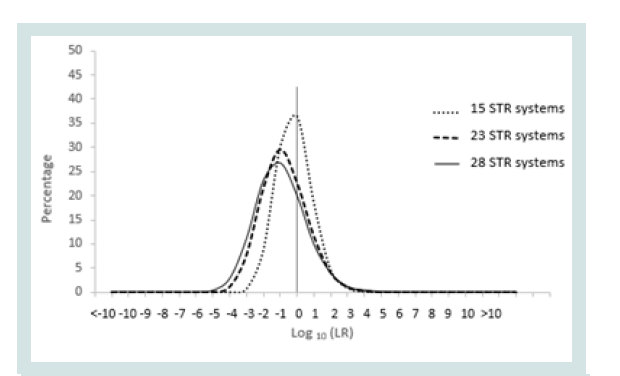 Figure 2: Half siblingship LR distribution of unrelated pairs.
 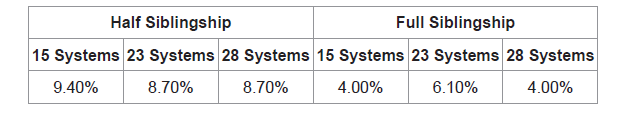 Table 4: Percent of false negatives (LR values <1 not supporting relatedness among related individuals).
 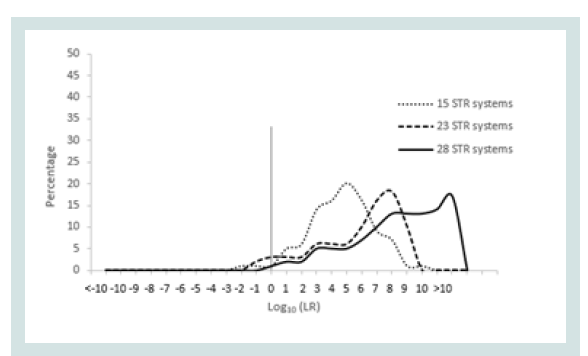 Figure 3: LR distribution of full sibling pairs.
 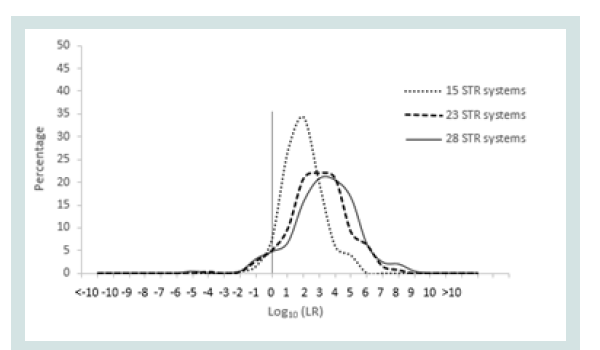 Figure 4: LR distribution of half sibling pairs.
Research Article
Evaluation of Sibling-Ship Analysis in Secluded Lebanese Villages with Increased Mating Patterns
Sarah Abbas1,2, Lama Mourad1, and Issam Mansour1*
- 1Faculty of Health Sciences, American University of Science and Technology (AUST), Beirut, Lebanon
- 2School of Criminal Justice, University of Lausanne (UNIL), Lausanne, Switzerland
*Address for Correspondence: Issam Mansour, Faculty of Health Sciences, American University of Science and Technology (AUST), Beirut, Lebanon, Tel: +961 1218716; E-mail: fhs@aust.edu.lb
Citation: Abbas S, Mourad L, Mansour I. Evaluation of Sibling-Ship Analysis in Secluded Lebanese Villages with Increased Mating Patterns. 2018; 6(1): 4.
Copyright: © 2018 Mansour I, et al. This is an open access article distributed under the Creative Commons Attribution License, which permits unrestricted use, distribution, and reproduction in any medium, provided the original work is properly cited.
Journal of Forensic Investigation | ISSN: 2330-0396 | Volume: 6, Issue: 1
Submission: 27 March, 2018 | Accepted: 30 April, 2018 | Published: 11 May, 2018
Keywords
Endogamy; Consanguinity; DNA interpretation; Sibling-ship; Lebanese population
Abstract
DNA profiling and statistical analysis in kinship studies aim to quantify the potential source of a biological trace or its possible relatedness with another trace. When parentage testing is not possible, another relatedness testing, such as sibling-ship analysis, could be helpful. The discrimination power of DNA analysis for sibling-ship, compared to cases of parentage analysis, is relatively low even in populations with homogeneous gene flow. The Lebanese population has a marked geographical and social structure, where endogamy1 amounts to an average of 88% and consanguinity2 reaches 31%, which lowers STR diversity and the discrimination power of sibling-ship statistical assessment.
To assess the effect of mating patterns between individuals residing in rural and/or secluded Lebanese villages on sibling-ship analysis, six Lebanese villages with high rate of endogamy and consanguinity, representative of the majority of Lebanese villages, were targeted. Profiles were established using PowerPlex 16HS, PowerPlex ESI17 and PowerPlex CS7 kits (Promega Corporation; Madison, WI, USA). Comparisons were conducted between each individual and all the other sampled individuals in the same village, using dedicated in-house software. Simulations involved different number of genetic systems (15,23 and 28 STR loci). Half and full sibling-ship simulations were performed among unrelated pairs in addition to simulations among related individuals that were used as controls.
Adventitious matches in both half and full sibling-ship simulations were observed. Increasing the number of systems from 15 to 23 and to 28 served in decreasing risk of false inclusions. These results highlight the significance of potential errors relative to relationship DNA testing when social and/or geographical seclusion is disregarded in the Lebanese population or in populations with high rates of endogamy and consanguinity practices
Introduction
Among all kinship investigations, DNA parentage analysis always outweigh results from any other DNA test for close relationships. Despite this fact, several occasions necessitate the analysis of other family relationships, such as siblings and half siblings.
In full siblings’ tests, the DNA of two individuals is compared to determine the likelihood that they have both biological parents in common, versus being unrelated. While in half siblings test, the DNA of two individuals is compared to determine the likelihood that they have one biological parent in common. Even though siblings share at least one parent, they can share any number of alleles in a DNA test. Yet, sibling-ship analysis is based on the fact that biologically related individuals will likely have more alleles in common than unrelated individuals.
It is worth noting that due to the increased probability of occurrence of the genes affected by genetic relatedness or consanguinity, a falsely alleged relative is more likely to exhibit a genetic profile correspondence at a certain locus when the involved individuals belong to the same subpopulation [1-4]. As with parentage testing, coancestry affects sibling-ship probability since observing one allele in a population subdivision increases the chance of observing the same allele even among unrelated individuals [5,6].
Mating patterns among members of the same religious community are highly observed within the eighteen different religious communities that constitute the Lebanese population. The geographic seclusion and the differences in cultural and religious beliefs among these communities are observed by a sustained seclusion that forced endogamous and consanguineous marriages with 88% endogamy and 31% consanguinity [7-9]. The effect of such inbreeding practices in the Lebanese population was reflected on parentage testing, DNA mixture interpretation and Y-STR analysis [10-12]. Therefore, in this study we attempt to screen the effect of these selective mating patterns on siblingship analysis.
Having in mind that endogamous and consanguineous marriages within isolated subpopulations result in low level of gene flow and produce more homozygote and fewer heterozygote genotypes; hence lowering the STR diversity and their discrimination power [13]. Thus, DNA profiles with matching allele types would become more common than suggested by independence assumption, even when individuals are not directly related (IBD), increasing consequently the risk of false matches [14].
Taking into consideration the marked structure of the Lebanese population and knowing that the majority of current procedures examine 16 genetic markers only for human identification without accounting to inbreeding practices, we targeted villages from different religious backgrounds, with high rates of endogamy and consanguinity and representative of the majority of Lebanese villages, in an attempt to assess the occurrence of false inclusions among sibling-ship studies in this population. Screening of sibling-ship probabilities was performed on a mass scale to get a wide view that could be extrapolated to include the whole village population. For this purpose, specialized software was developed to perform the mass scale simulation studies. These software were able to perform, multi directional sibling-ship simulations and compile their likelihood ratios, a statistics widely accepted to assess the value of findings, on each individual against all others of the same village using different STR marker set (15,23 and 28).
Materials and Methods
Sample collection
Six Lebanese villages from different geographic locations, representing all Lebanese regions, were targeted:
1.The majority of their inhabitants belong to one religious community, to include the main six religious communities,
2.Inhabitants of adjacent villages belong to different religious communities and
3.Showing high rates of endogamy and consanguinity.
This geographic and social isolation has led to increased inbreeding practices within these villages and thereby these villages are representative of the big majority of the Lebanese villages, where more than 50% of the total Lebanese population reside.
A total of 496 samples were collected as follows: 150 blood samples from village A, 102 buccal swabs from village B, 85 buccal swabs from village C, 72 buccal swabs from village D, 59 buccal swabs from village E and 28 buccal swabs from village F. In which the collected samples represent at least 1% of the total village population (Table 1). Approval consent was obtained from all participants.
DNA extraction
For buccal swab samples Phenol: Chloroform: Isoamylalcohol (PCI) organic DNA extraction protocol was performed on epithelial cheek cells following standard methods, while for blood samples DNA was extracted from lymphocytes using the salting out standard protocol [15,16]. DNA samples were quantified using Nanodrop 2000 (Thermo Fisher Scientific Inc.).
Profiling
An average of 1 ng of the extracted DNA was amplified, using three separate multiplex STR kits from Promega (Promega Corporation; Madison, WI, USA), according to manufacturer’s instructions. The following multiplex kits, PowerPlex 16HS®, PowerPlex ESI17® and PowerPlex CS7® were used to reach 28 STR systems (D3S1358, TH01, D21S11, D18S51, Penta E, D5S818, D13S317, D7S820, D16S539, CSF1PO, Penta D, vWA, D8S1179, TPOX, FGA, D19S433, D2S1338, D22S1045, D1S1656, D10S1248, D2S441, D12S391, SE33, LPL, F13B, FESFPS, F13A01 and Penta C). Capillary electrophoresis followed PCR and was conducted using the AB3130 Genetic Analyzer through the Data Collection Software version 3.0 and GeneMapper Software version 4.0 from Applied Biosystems (Applied Biosystems, Foster City, CA USA).
Simulation studies
The STR allelic data collected from the GeneMapper software were transferred to the in-house software, Mass Sibling-Ship Calculator that was dedicated to execute simulation studies.
Half and full sibling-ship simulations were performed, using the in house “Mass Sibling-ship Calculator” software, which compares each individual to all other sampled individuals of the same village. Likelihood ratios for relative relationships (full siblings vs. unrelated and half siblings vs. unrelated) were calculated based on the Lebanese allele frequencies, and using three different profile sizes: 15, 23 and 28 [17].
Results
Sibling-ship simulations were performed between each individual and all the other sampled inhabitants of the same village resulting in 11,175 pairs in village A, 5,151pairs in village B, 3,570 pairs in village C, 2,556 pairs in village D, 1,711 pairs in village E and 378 pairs in village F. Totaling 24,541 pairs from all sampled villages (Table 2). Simulations were repeated in three different profile sizes 15, 23 and 28 loci. First by considering full siblings vs. unrelated and second by considering half siblings vs. unrelated hypotheses. Therefore, resulting in 147,246 sibling-ship simulations as summarized in Table 2.
The 24,541 simulated pairs were sorted as follows 22,474 unrelated pairs, 254 half sibling pairs and 99 full sibling pairs.
The likelihood ratio for siblingship analysis was based on the hypothesis of full siblings vs. unrelated and half siblings vs. unrelated. Any LR greater than 1 was accounted to as a positive support for relatedness. Among the 22,474 unrelated pairs, when computed using 15 STR loci, 23.70% (n=5,325) showed adventitious matches for half sibling relatedness and 5.13% (n=1154) showed adventitious matches for full sibling relatedness. When computed using 23 STR loci, 17.10% (n=3840) showed adventitious matches for half sibling relatedness and 2.13% (n=478) showed adventitious matches for full sibling relatedness. However, when computed using 28 STR loci, only 15.40% (n=3452) showed adventitious matches for half sibling relatedness and 1.58% (n=355) showed adventitious matches for full sibling relatedness (Table 3).
Table 3 shows the rates of false positives and its decrease among unrelated indivduals when the number of STR systemswas increased from 15 to 28 for both half and full sibling-ship.
Since any LR value above 1 was considered positive it was important to assign the LR order of magnitudes of all unrelated pairs. Figure 1 represents the LR distribution of full siblingship simulations and Figure 2 represents the LR distribution of half siblingship simulation.
The LR values for full siblingship and half siblingship (showed a shift below LR=1 when the genetic systems increased from 15 to 28 (Figures 1 and 2).
The likelihood ratios of half sibling pairs (n=254) and full sibling pairs (n=99) were calculated to quantify the effect of increasing the number of systems. When computed using 15 STR loci, 9.40% (n=24) did not show support of half sibling relatedness. False negatives dropped to 8.70% (n=22) in both 23 and 28 STR loci (Table 4). As for full sibling pairs, when computed using 15 STR loci 4.00% (n=4) of true siblings did not show support of full siblingship. At 23 STR loci the number of false negatives increased to 6.10% (n=6), this number dropped back to 4.00% (n=4) false negatives in full sibling pairs when computed using 28 STR loci (Table 4).
The LR distribution of full siblingship simulations of full sibling pairs and the LR disribtuion of half siblingship simulation of half sibling pairs are depicited in Figures 3 and 4, respectively.
Discussion
The outcome, of the mass scale sibling-ship simulation studies, shed the light on many DNA interpretation courses of action that could be misused in populations with increased rate of endogamy and consanguinity in general and in Lebanon in particular. Not only drawbacks were revealed, but also some of the preventive measures that could be taken to reduce false inclusions and maintain a high discrimination power among genetically related individuals.
A likelihood ratio value greater than one supports the hypothesis of a positive relationship [18]. Conversely, any value below one supports the hypothesis of no relationship. A likelihood ratio equal one is neutral in the sense that the findings do not support one or other hypothesis. The false relationships (unrelated persons that appear related and true relatives that appear unrelated) among all performed simulations are quantified by counting cases where the likelihood ratio is greater or lower than one, respectively [19].
In the present study, likelihood ratios were assigned to sets of 15, 23 and 28 STR loci using Lebanese allele relative frequencies. For each simulation (DNA profile for each couple of individuals), a likelihood ratio was assigned under the hypothesis of a specific relationship (full-sibs or half-sibs) versus no relationship (unrelated individuals).
The discrimination of full as well as half sibling-ship was improved with 23 genetic systems relative to 15 systems owing to the decrease of the likelihood ratio values of unrelated individuals. Adventitious matches took a further decline upon increasing the number of systems from 23 to 28 STRs in both full and half siblingship simulations. The false negatives, on the other hand, play a limiting factor on the decision of the number of markers (23 or 28) to be used to decrease false positives. The control, full sibling pairs were negatively affected by increasing the number of systems from 15 STRs (4.00%) to 23 STRs (6.10%). Yet, this drawback was resolved when using 28 STR systems (4.00%). As for the half sibling pairs both 23 and 28 STR systems showed decrease in false negatives (8.70%) with respect to 15 STR systems (9.40%).
Conclusion
The observed results highlight the drawbacks of siblingship analysis in the Lebanese population in general and in rural Lebanese villages in particular. Hence, we can conclude that the rate of obtaining a false positive siblingship, between unrelated pairs of the same village and belonging to the same religious community, is inversely proportional to the number of STR systems used.
Consequently, in the Lebanese population characterizing siblingship relatedness between individuals by only 15 STR systems is insufficient. In rural Lebanese villages in particular, siblingship analysis with 15 STR systems has a low power of discrimination where almost 25% of unrelated individuals in the same village will statistically appear as siblings. Thereby, the use of 28 STRs reduces the false positives in both full and half siblingship situations and on the other hand does not decrease true positives.
Thereby, the current study suggests the use of 28 instead of 15 STR loci to decrease the high risk of uncertainty. Parallel ongoing research aims at implementing recommendations by applying additional corrective measures based on the obtained LR magnitude of distribution and the number of shared alleles of the tested pairs.
Acknowledgement
We would like to acknowledge Promega Corporation for their generous grant of the kits as well as the American University of Science and Technology for their academic and technical support. Professor Franco Taroni for his valuable advices. Mr. Taimour Wehbe for the software development. Extended appreciation to all volunteers from the six villages who participated in this study.
References
- Norrgard K (2008) Forensics, DNA fingerprinting, and CODIS. Nat Educ 1: 35.
- Buckleton J, Triggs CM (2005) Relatedness and DNA: are we taking it seriously enough? Forensic Sci Int 152: 115-119.
- Lee JW, Lee HS, Park M, Hwang JJ (1999) Paternity probability when a relative of the father is an alleged father. Sci Justice 39: 223-230.
- Rowold DJ, Herrera RJ (2005) On human STR sub-population structure. Forensic Sci Int 151: 59-69.
- Balding DJ, Nichols RA (1994) DNA profile match probability calcualtion: how to allow for population stratification, relatedness, database selection and single bands. Forensic Sci Int 64: 125-140.
- Brookfield JF (1994) The effect of relatives on the likelihood ratio associated with DNA profile evidence in criminal cases. J Forensic Sci Soc 34: 193-197.
- Klat M, Khudr A (1986) Religious endogamy and consanguinity in marriage patterns in Beirut, Lebanon. Soc Biol 33: 138-145.
- Barbour B, Salameh P (2009) Consanguinity in Lebanon: prevalence, distribution and determinants. J Biosoc Sci 41: 505-517.
- Kanaan ZM, Mahfouz R, Tamim H (2008) The prevalence of consanguineous marriages in an underserved area in Lebanon and its association with congenital anomalies. Genet Test 12: 367-372.
- El Andari A, Mansour I (2013) Is he or is he not the father?: pros, cons effect of following standardized interpretations. Forensic Sci Int: Genet Suppl Ser 4: e186–e187.
- Abbas S, Mourad L, Mansour I (2017) Inbreeding effect on forensic investigations involving DNA mixtures: the Lebanese population case. Forensic Sci Int 277: 1-257.
- Al-Azem M, El Andari A , Mansour I (2017) Estimation of allele and haplotype frequencies for 23 YSTR markers in the Lebanese population. Forensic Res Criminol Int J 5: 00150.
- Curran JM, Buckleton J (2006) The appropriate use of subpopulation corrections for differences in endogamous communities. Forensic Sci Int 168: 106-111.
- Ayres KL (2000) Relatedness testing in subdivided populations. Forensic Sci Int 114: 107-115.
- Barker K (2005) At the bench: a laboratory navigator, updated edition (2ndedn). Cold Spring Harbor Laboratory Press, USA.
- Miller SA, Dykes DD, Polesky HF (1988) A simple salting out procedure for extracting DNA from human nucleated cells. Nucleic Acids Res 16: 1215.
- El Andari A, Othman H, Taroni F, Mansour I (2013) Population genetics data from 23 STR markers from Lebanon. Forensic Sci Int Genet 7: e108-e113.
- Advancing Transfusion and Cellular Therapies Worldwide (2009) Guidance for standards for relationship testing laboratories (7thedn). AABB, Bethesda, USA.
- Brenner CH (2001) Mathematics in forensic genetics.