
Journal of Forensic Investigation
Download PDF
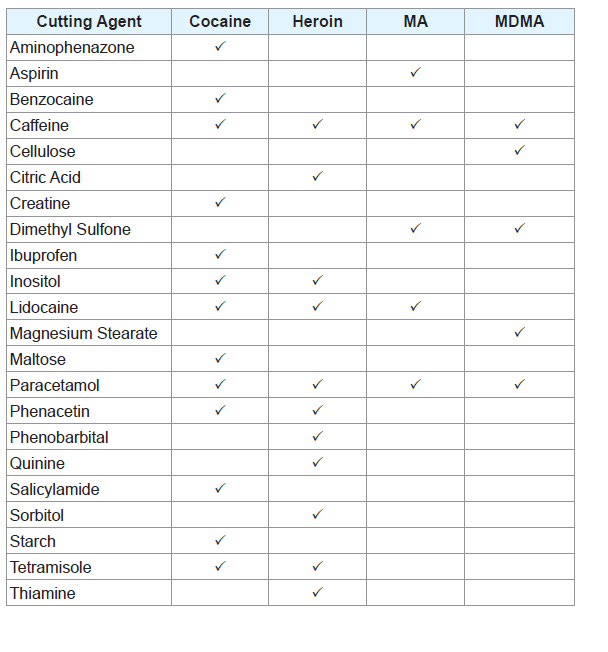 Table 1:Adulterants and illicit drug combinations used to create mixtures in this study.
 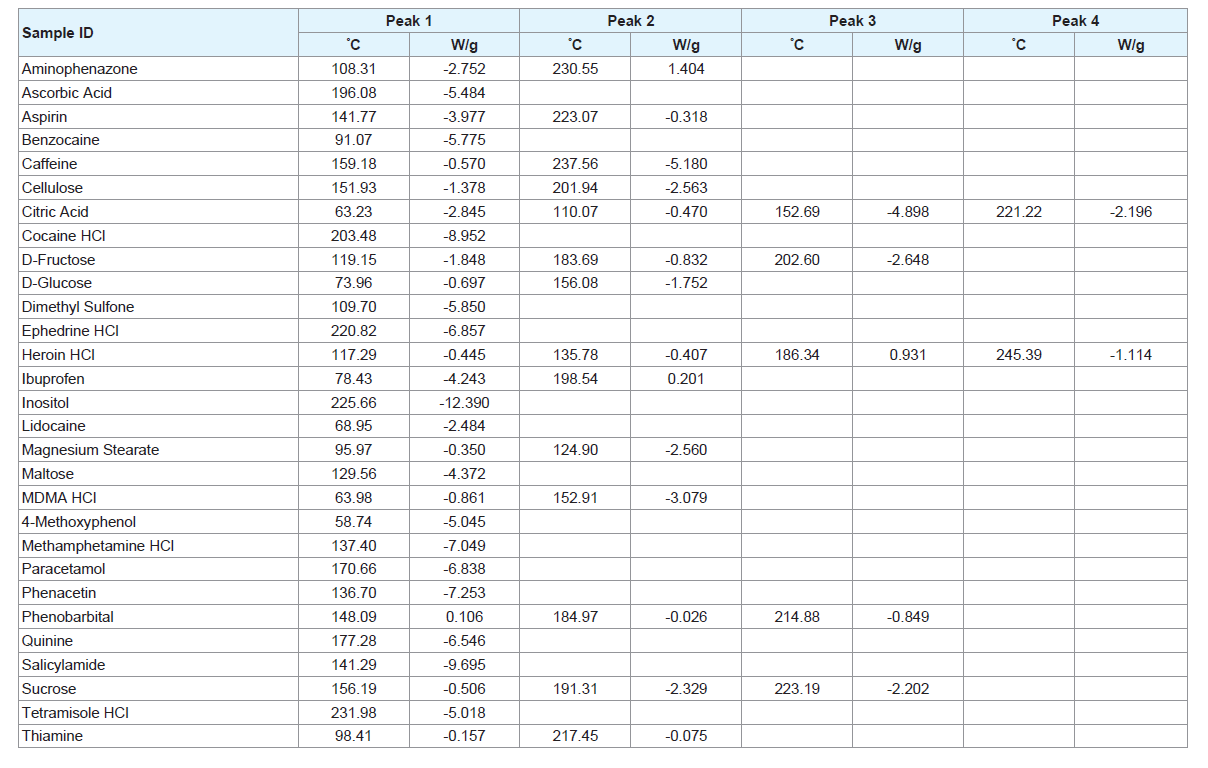 Table 2: Peaks present in the thermograms of the pure adulterant and drug samples.
 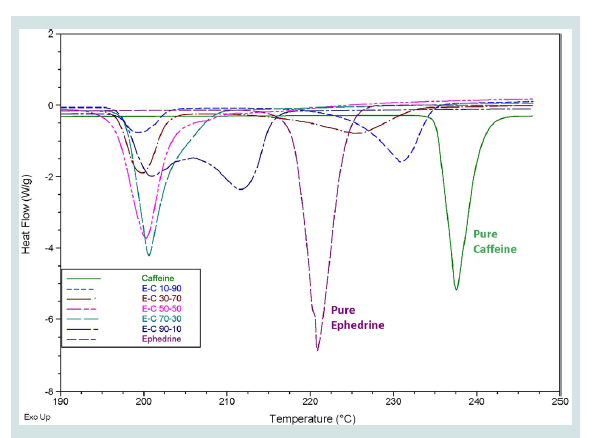 Figure 1: Overlaid DSC thermograms of the different mixtures of ephedrine HCl and caffeine with pure substances with composition ranging from 90:10 w/w to 10:90 w/w.
 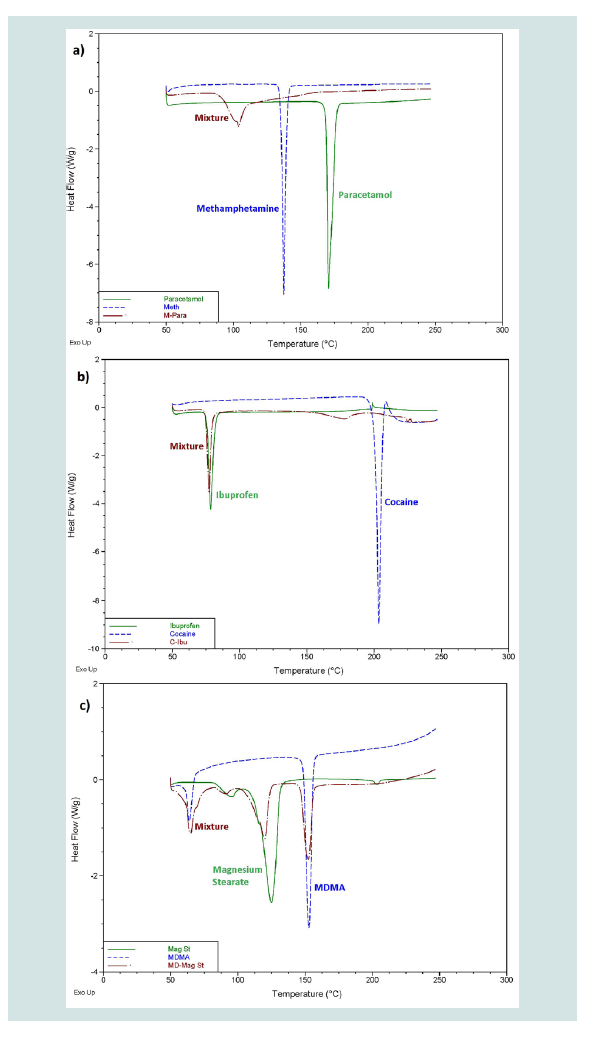 Figure 2: Example thermograms showing as; A) Level 1 differentiation; B) Level 2 differentiation; and C) Level 3 differentiation.
 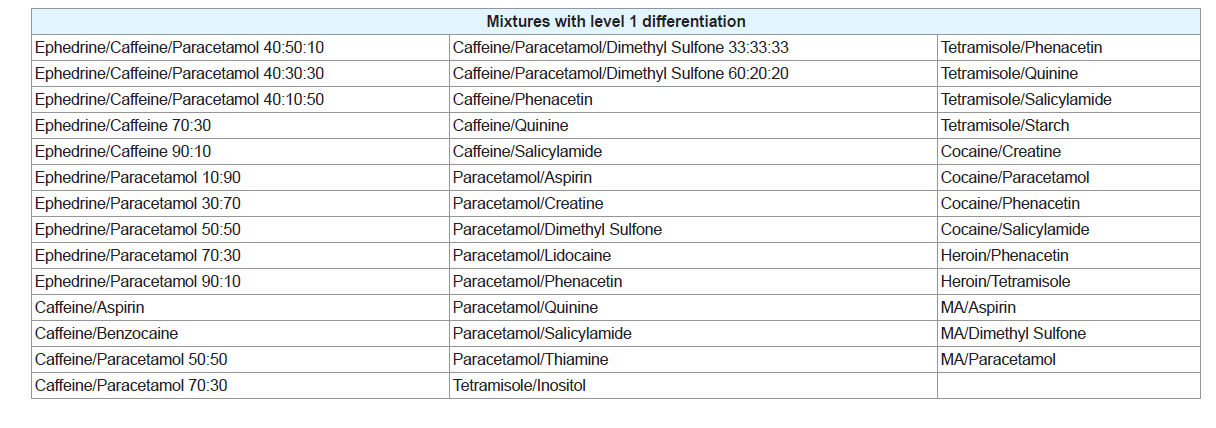 Table 3: Overview of the different mixtures displaying level 1 differentiation.
 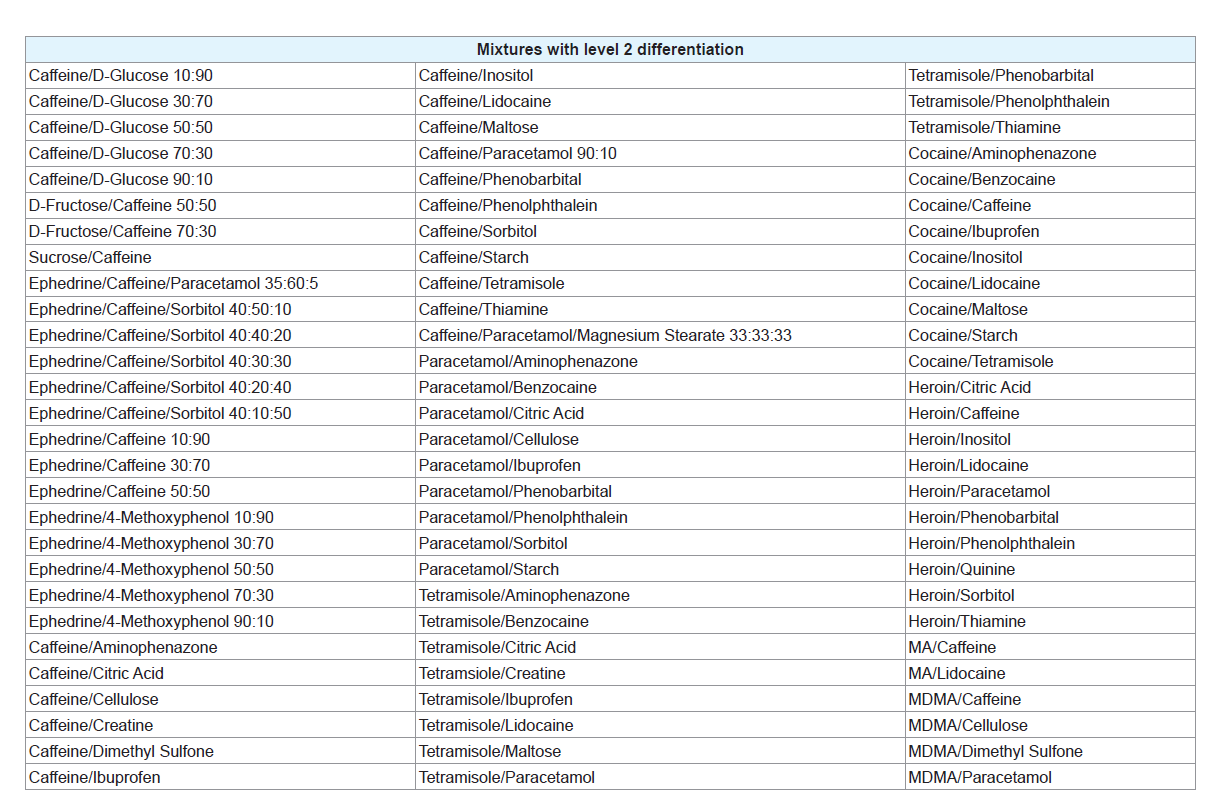 Table 4: Overview of the different mixtures displaying level 2 differentiation.
 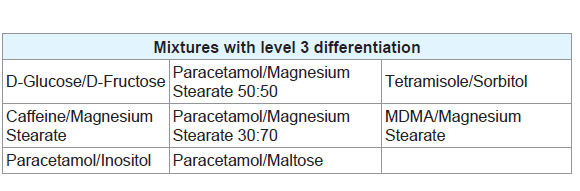 Table 5: Overview of the different mixtures displaying level 3 differentiation.
 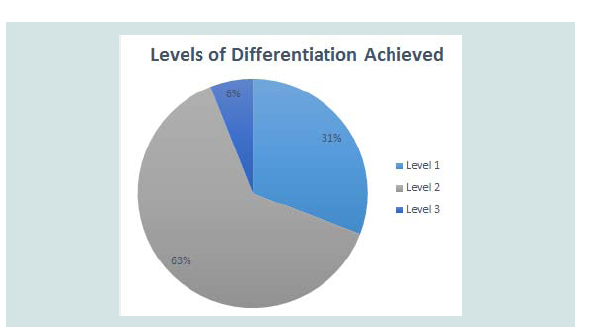 Figure 3: Proportion of each different level of differentiation found throughout the study. A) Level 1 showed no correlation to pure substances; B) Level 2 showed some correlation but with additional peaks or peaks missing; and C) Level 3 showed correlation to all features of pure substances.
Case Report
Evaluating the Use of Differential Scanning Calorimetry for the Analysis of Illicit Substances and Their Adulterants
Joshua Klingberg1, Ronald Shimmon1, Morgan Philp1, Shanlin Fu1*, Mark Tahtouh2 and Niamh Nic Daeid3,4
- 1Centre for Forensic Science, University of Technology Sydney, Australia
- 2Forensics, Australian Federal Police, Australia
- 3Leverhulme Research Centre for Forensic Science, University of Dundee, Scotland, UK
- 4Forensic Drug Research Group, Centre for Anatomy and Human Identification, University of Dundee, Scotland, UK
*Address for Correspondence: Shanlin Fu, Centre for Forensic Science, University of Technology Sydney, PO Box 123, Broadway, NSW 2007, Australia, Tel: +61 2 9514 8207; E-mail: shanlin.fu@uts.edu.au
Citation: Klingberg J, Shimmon R, Philp M, Fu S, Tahtouh M, et al. Evaluating the Use of Differential Scanning Calorimetry for the Analysis of Illicit Substances and Their Adulterants. J Forensic Investigation. 2018; 6(1): 8.
Copyright: © 2018 Klingberg J, et al. This is an open access article distributed under the Creative Commons Attribution License, which permits unrestricted use, distribution, and reproduction in any medium, provided the original work is properly cited.
Journal of Forensic Investigation | ISSN: 2330-0396 | Volume: 6, Issue: 1
Submission: 16 March, 2018 | Accepted: 18 April, 2018 | Published: 30 April, 2018
Keywords
Differential scanning calorimetry; Illicit drugs; Cutting agents; Adulterants
Abstract
Chemical profiling of seized material is a powerful tool used by law enforcement agencies to determine the presence of illicit drugs and their adulterants within a suspect material. This study presents a proof-of-concept for the use of Differential Scanning Calorimetry (DSC) for the analysis of illicit drugs. Mixtures of methamphetamine, 3,4-methylenedioxymethamphetamine (MDMA), heroin and cocaine with their common adulterants, including paracetamol, caffeine, tetramisole HCl and sugars were submitted for DSC analysis. A range of temperature programs were examined to determine the best conditions for analysis. It was determined that the mixtures showed three distinct levels of differentiation. Level 1 contained mixtures which revealed peaks that did not correlate to any pure substances present, making differentiation difficult. In some cases, however, the combination of peaks was unique, allowing for possible identification of a particular combination of components. Level 2 mixtures revealed peaks which were characteristic of one or more substances present or other distinguishing features, such as decomposition patterns, which may indicate the presence of a substance or group of substances. Level 3 revealed very good differentiation facilitating clear identification of the substances present. Level 2 differentiation was the most common across the analysed mixtures. This screening technique may provide useful information to investigators regarding the analysis of drug seizures, guiding further confirmatory analysis.
Introduction
The World Drug Report 2016, published by the United Nations Office on Drugs and Crime (UNODC), estimates that 1 in 20 adults between the ages of 15 and 64 used at least one drug in 2014 [1]. The number of drug-related deaths worldwide has remained relatively stable, with illicit drug use estimated to have contributed to 207,400 deaths in 2014, with overdoses causing approximately one-third to one-half of those deaths [1].
Illicit drugs often contain substances other than the active ingredient [2]. The nature and purpose of these additional substances can vary and include both diluting the sample and enhancing the effects of the illicit drug [2]. Generally, ‘adulterants’ are pharmacologically active substances; ‘contaminants’ are the by-products of the manufacturing process and ‘diluents’ are inert substances added to bulk or dilute the final product [3]. In this paper, adulterants, contaminants and diluents are all referred to as ‘adulterants’.
Numerous studies have been published on the common adulterants found in illicit drug samples. Heroin and cocaine are the most frequently adulterated. A review of studies conducted from 1981-2014 identified more than 30 different adulterants in seized cocaine samples and over 40 adulterants in heroin samples [2-5]. Despite possessing fewer adulterants, amphetamine-type stimulants (ATS), such as methamphetamine (MA) and 3,4-methylenedioxymethamphetamine (MDMA), are still often found adulterated [2]. While some adulterants, such as caffeine and paracetamol, are very common and can be found in all of the aforementioned drugs, different illicit substances often have different adulterants commonly associated with them [2,4].
Creating a chemical profile of an illicit drug requires data to be gathered about the physical and chemical properties of the substance in question. There are numerous different techniques which can be used to obtain this information including, Gas Chromatography-Mass Spectrometry (GC-MS), Liquid Chromatography-Mass Spectrometry (LC-MS), Capillary Electrophoresis (CE), Inductively Coupled Plasma-Mass Spectrometry (ICP-MS) and occasionally Fourier Transform Infra-Red Spectroscopy (FTIR) and Raman Spectroscopy [6-9]. Multiple techniques can be used to obtain different types of data points to construct an overall characteristic chemical profile [10]. The selection of these techniques often depends on the impurities or adulterants being targeted [6]. This large number of different analytical techniques, while providing a great deal of information about the seizure, highlights the potential advantage in terms of time and cost savings should a single technique be available which could identify all impurities and adulterants present within a sample
Differential Scanning Calorimetry (DSC) is a technique which measures the difference in heat flow rate between a sample and reference when subjected to a controlled temperature program [11]. Heat flow is defined as the flow of energy into or out of the sample as a function of either temperature or time [12]. The instrument used for this study is known as a heat-flux DSC and measures the temperature difference between a sample and reference pan subjected to the same external temperature conditions [11,13]. The main advantages of DSC methods includes minimal sample preparation requirements, shorter total analysis times and a smaller sample size requirement [14]. DSC methods are prevalent in the pharmaceutical industry for a range of applications such as pre-formulation analysis and evaluating the stability and storage conditions of various drug products; however, the use of DSC methods for analysis is not common place in a forensic science environment [14,15].
The UNODC has stated that drug markets and drug use patterns change rapidly, so measures to address such patterns must also be quick to adapt. Thus, the more comprehensive the drug data we collect, the stronger our capacity to analyse the challenge and the better prepared the international community will be to respond [16]. This study aims to develop a proof-of-concept for the use of DSC as a rapid and universal method for the identification of adulterants present in illicit substances. In addition, the possibility of differentiating between crude and purified drug samples will be evaluated.
Materials and Methods
Reference standards
Pure samples of various adulterants and illicit drugs were obtained from a variety of different manufacturers. (1S,2R)-(+)-ephedrine HCl, 4-methoxyphenol, benzocaine, caffeine, cellulose, dimethyl sulfone, ibuprofen, lidocaine, magnesium stearate, maltose, paracetamol, phenacetin, phenobarbital, quinine, salicylamide, sorbitol, starch and tetramisole HCl were obtained from Sigma Aldrich Pty. Ltd (Castle Hill, Australia). Aspirin, citric acid, D-glucose, lactose, mannitol and phenolphthalein were obtained from Ajax Finechem Pty. Ltd (Taren Point, Australia). L-ascorbic acid was obtained from VWR Chemicals (Brisbane, Australia). 4-aminophenazone, creatine and inositol were obtained from Hopkins & Williams Ltd (Swansea, UK). Thiaminium dichloride (thiamine) was obtained from Merck KGaA (Darmstadt, Germany). Sucrose was obtained from Mallinckrodt Pharmaceuticals (Dublin, Ireland). D(-)-Fructose was obtained from May & Baker Pharmaceuticals Ltd (London, UK). Samples of crude and purified 4-methylmethcathinone HCl (MMC HCl) and 3,4-methylenedioxymethcathinone HCl (Methylone HCl) were synthesised in-house at the University of Technology Sydney (UTS). Samples of cocaine HCl, heroin HCl, MDMA HCl and MA HCl were obtained from the National Measurement Institute (NMI, North Ryde, Australia).
Mixtures
Two-component mixtures of different adulterants were prepared at various compositions and weighed using an analytical balance. All mixture compositions were measured as a weight percentage (w/w). Additionally, two-component mixtures of different adulterants with the drugs they are commonly found in were created, all at a composition of 50:50 w/w. A list of the illicit drugs analysed and the adulterants they were mixed with can be found in Table 1.
Three-component mixtures of common adulterants were created at different compositions. Mixtures of ephedrine HCl with caffeine and paracetamol as well as caffeine and sorbitol were also created at varying compositions. A complete list of all samples tested throughout the experiment can be found in the supplementary material (Supplementary Tables 1-18).
Differential scanning calorimetry
DSC analysis was performed with a DSC Q2000 instrument (TA Instruments, USA) with an included refrigeration system. The instrument was calibrated using an indium standard as recommended by the manufacturer. Nitrogen (N2) was chosen as the purge gas with a flow rate of 50 mLmin-1 throughout all the experiments and a sampling interval of 0.5 spt-1 was selected. A temperature range of 50-250 °C with a ramp rate of 10 °Cmin-1 was used unless otherwise specified. All samples were prepared using TZero aluminum pans. Standard TZero lids were initially used, however it was decided that hermetic lids provided a better environment for analysis. Due to a build-up of vapour pressure in the sample pans, a small hole was placed in the hermetic lids of the pans to ensure that they would not burst during analysis. The reference used was an empty TZero pan with the correct corresponding lid. The pans were sealed using a TZero Sample Press Kit (TA Instruments, USA) before being introduced into the DSC cell using an autosampler. While this technique is destructive to the sample being analysed, only small sample sizes (<5 mg) are required. All data analysis was conducted using Universal Analysis 2000, version 4.5A (TA Instruments, USA). All thermograms created show exothermic reactions with positive heat flow (upwards peaks).
Results and Discussion
Refining the DSC method
The effect of the ramp rate on the thermograms produced was investigated using a pure sample of caffeine. As the ramp rate decreased, the peaks present in the thermograms became sharper, especially seen in the melting endotherm, while the small peak at approximately 160 °C became much less defined (Supplementary Figure 1). A ramp rate of 10 °Cmin-1 afforded the best compromise between peak resolution and sample run time. In more complicated systems, some components may have close melting temperatures and as a consequence, it may be beneficial to use a slower ramp rate to provide a better separation between the peaks.
Seven pure samples of caffeine were analysed over the course of the study. The temperature of the peaks present in these samples was compared to determine the repeatability and reproducibility of the technique. The temperature of the sharp melting endotherm was found to be 236.64±0.22 °C and the smaller, broader peak was found at 157.79±2.15 °C. The melting point of caffeine has been reported in the literature to fall between 234-238 °C [17]. All of the samples analysed presented melting endotherms that fell within the melting point range in the literature.
Pure samples
Most of the pure samples run using the DSC presented with one or two peaks; however, some substances did reveal a greater number of peaks. Table 2 shows an overview of the peaks present in the different pure samples of various adulterants. Both temperature (°C) and heat flow (W/g) are presented in the Table 2. A negative heat flow represents an endothermic reaction.
The heat flow value indicates the relative intensities of each peak. This value is calculated as W/g to account for the varying masses of the samples which are being analysed. These weight values are provided by the user; therefore, it is possible that error in the balances used to weigh the samples could influence the heat flow values. While this error would be small, it may contribute to the different heat flow values between thermograms. The heat flow values, therefore, only provide a point of comparison for the various peak heights within a single thermogram to further identify specific characteristics of an individual sample (e.g. caffeine shows an intense peak at 237.56 °C and a much smaller peak at 159.18 °C).
Most notably, of all the pure samples, only 4-aminophenazone exhibited an exothermic reaction at 230.55 °C. No peaks were observed for creatine or phenolphthalein which is unsurprising as their melting points, 255 °C and 262.5 °C respectively, are above the maximum temperature of the run (Supplementary Figure 2) [18,19]. This does not mean, however, that they will have no impact on mixtures containing one of these substances. It is possible that the compounds may still interact with others under increased temperature conditions.
The pure sample of D-glucose revealed two peaks at 74 °C and 156 °C followed by a series of sharp peaks and a rugged baseline starting at approximately 200 °C indicating decomposition has occurred (Supplementary Figure 3). While this is the most dramatic occurrence of the phenomenon, it does appear to a lesser extent in the other sugar samples. It is possible that the presence of these decomposition peaks may mask the presence of other substances; however, the appearance of this pattern may itself be an indicator that a sugar is present. If too much decomposition occurs, it can change the mass of the sample and therefore the heat flow measured. In this case, the change would be insignificant and the temperature of the peaks should not be affected. Some of the pure substances revealed isothermic peaks, for example, caffeine and tetramisole HCl both show peaks at approximately 230 °C. For most of these substances, however, there are additional peaks that can differentiate between the compounds. The only exception to this is the case of quinine and paracetamol. Both samples show peaks at approximately 170 °C with a difference of 7 °C and neither of these compounds show more than one peak. This may cause issues if mixtures containing these two compounds are analysed.
The pure drug compounds analysed show peaks which are individual to each specific compound (Table 2). Heroin HCl and MA HCl have peaks which are very close together, however the pure heroin sample had a number of peaks which would not be present in a sample of MA and therefore could allow for differentiation between the substances. More notably, these drug compounds have peaks that are, for the most part, able to be differentiated from the common adulterants tested.
The number of peaks present in each sample must also be considered. While a greater number of peaks give rise to a thermogram which is more complicated, it is less likely that there will be another substance that will exactly mirror those peaks. If a pure substance has a single peak, however, this occurrence becomes much more likely. Cocaine HCl, ephedrine HCl and MA HCl all have a single peak and these compounds also have at least one adulterant which shows a peak at approximately the same temperature. The presence of an isothermic peak with the drug compound can give rise to a question of whether that peak is showing because of the adulterant or if the drug is present in the sample. This effect can work both ways, with the presence of certain adulterants masked by other compounds present in a sample. Therefore, care must be taken when interpreting thermograms to try and limit the possibility of false positives and false negatives.
Mixtures
The mixtures which contained sugars showed decomposition patterns analogous to the results of the pure samples. When the non-sugar component of the mixture was in a large excess, e.g. greater than 70% of caffeine in a caffeine/D-glucose mixture, sugar decomposition was less pronounced or was absent. According to the overview of adulterants published by Cole C et al., sugars are most commonly found in heroin and cocaine, however there have been reports of sugars present is samples of ATS [2]. While the percent composition of sugars in ATS was not reported, it was found that the composition of sugars in heroin and cocaine ranged from approximately 20- 73% [2]. While the compositions of individual sugars may be quite low (as low as 3% fructose in some samples [2]), the combined composition of the sugars fell within the range presented previously. Since the different sugars presented all displayed the decomposition patterns, a higher combined combination in most cases should be sufficient to indicate the presence of one or more sugars.
The expected caffeine peak at approximately 235 °C observed in the pure sample was not present, when the sugar was in excess and this was most likely due to the interference of the decomposition pattern (Table 2). While there were peaks within the expected temperature range, it was not possible to differentiate the caffeine melting endotherm from the general decomposition peaks (Supplementary Figure 4). The mixtures of caffeine with other sugars showed similar characteristics, with the melting of caffeine being indistinguishable amongst the decomposition patterns. A mixture of two sugars, D-glucose and D-fructose, could be differentiated due to their associated peaks outside the decomposition region. This demonstrates that the technique can be used to identify which sugar may be present in a mixture and even differentiate between different sugars which are present in the same mixture. If a substance presented with peaks in the decomposition range, however, it would be expected that its presence may be masked.
Many different mixtures of adulterants commonly found within illicit drug samples were tested to determine what effects they might exhibit on each other during the analytical procedure. Some of the adulterants examined displayed features that could be observed even when the melting endotherm was not present, similar to the decomposition patterns seen with the sugar samples. For example, caffeine undergoes a polymorphic transition at temperatures of around 142-155 °C [20]. A small peak around this temperature range was observed in several of the samples containing caffeine, even in cases where no caffeine melting peak was present.
A common occurrence in the samples tested was that the thermograms only presented a single peak which was lower than the melting points of either of the components present in the mixture. Upon further investigation, it was discovered that some of the mixtures analysed could be exhibiting eutectic properties. A eutectic system is an intimate crystalline mixture of one component in another [21]. When a certain mixture has the correct ratio of components, it will melt at a single temperature which is lower than the temperature of either of the components, known as the eutectic temperature [22]. At any other composition, the sample will begin to melt at the eutectic temperature but will need to be heated to a higher temperature, closer to the melting temperature of the pure substance that is in excess, for all components to melt [22]. This effect is demonstrated by the mixtures of caffeine and ephedrine HCl presented in Figure 1.
All the samples displayed a peak at approximately 200 °C, indicating the eutectic temperature of this mixture. This feature can potentially be used to indicate the co-existence of two specific components in a mixture; however this would require knowledge of the eutectic temperature of the system. When one of the components is in excess, secondary peaks begin to appear which are closer to the melting point of that component. While this downwards shift of melting temperatures was observed in many of the samples tested, only the two-component mixtures of caffeine or paracetamol with ephedrine HCl were analysed in depth to confirm this effect. For the purpose of this proof-of-concept study, it was important to ascertain the nature of the melting point depression being observed. The thorough investigation of each individual eutectic system, however, did not fall within the scope of the current research.
Level of differentiation
Overall, the differentiation of components in a mixture achieved by the DSC was sorted into three different categories. Level 1 differentiation refers to mixtures where the peak/s present in the thermogram did not correlate to any of the peaks that were displayed by the pure components. This level does not allow for direct identification of any components present in the mixture; however the possibility exists that the peaks produced may be unique for a specific mixture. Figure 2A provides an example of a mixture displaying level 1 differentiation.
Of the 35 different mixtures of drugs with their common adulterants created, eight were identified as having a level 1 differentiation (Table 3). In these mixtures, the individual peaks were not unique meaning that peaks at the same temperature appeared in other samples. In some cases, however, the pattern of the peaks was distinctive, demonstrated by the mixtures of cocaine with paracetamol and salicylamide and heroin with tetramisole. This means that, while each individual peak may be present in other samples, no other sample analysed produced the same combination of peaks as these mixtures. It is possible that combinations of substances not considered in this study may produce a similar pattern of peaks; however these results show the potential of this technique to guide analysts towards appropriate confirmatory testing, even when direct identification of the components within a mixture is not possible. Many of the three component mixtures analysed also fell into this category. This indicates that more complicated systems are more likely to contain components that will affect each other during analysis. Level 2 refers to mixtures where the peaks correlated to the pure thermograms of one or more of the components (Table 4). These mixtures, however, displayed additional peaks that could not be explained by either of the pure components or were missing peaks that were present in the pure samples. Mixtures were also classified as level 2 if they contained features that could be attributed to a compound or group of compounds, for example, the decomposition pattern exhibited by the sugar samples. Figure 2B provides an example of a mixture displaying level 2 differentiation. This level of differentiation was by far the most common found. This may add credibility to the proposed use of DSC as a screening technique for profiling illicit drugs as, in most cases, it can provide an identification of at least one component in the mixture.
Level 3 was defined by mixtures which displayed peaks correlating to all the pure components present in the mixtures without the presence of any additional, unexplained peaks or the absence of any expected peaks (Table 5). Figure 2C provides an example of a mixture displaying level 3 differentiation. While more peaks being present in a thermogram means that there is less likely to be an exact match between two unrelated pure samples, there is less chance of a mixture of substances displaying all the peaks seen in the thermograms of pure samples and therefore the mixture will not display level 3 differentiation. Most of the mixtures which did display this level of differentiation had only one or two peaks in the thermogram of the pure components. These mixtures are ideal for chemical profiling as they allow for easy identification of the components. Figure 3 provides an overview of the proportions of each level found throughout the study.
In the chemical profiling workflow employed by NMI, numerous techniques, including GC-MS, CE, ICP-MS and Liquid Chromatography-Evaporative Light Scattering Detector (LC-ELSD) are utilised to determine the full breadth of components present within a sample [6]. In particular, sugars, such as fructose and glucose, are analysed by LC-ELSD, while inorganic impurities, such as magnesium stearate, would normally be identified using ICP-MS [6]. In this study, the mixture of MDMA with magnesium stearate produced level 3 differentiation, allowing for the identification of both components and therefore indicates what confirmatory tests will be required. Additionally, as previously mentioned, the presence of sugars in samples analysed throughout this study is indicated by a distinctive decomposition pattern. The appearance of this pattern could, therefore, justify the use of LC-ELSD for confirmation. The indication of the presence of particular components, or groups of components, by DSC allows the analyst to get an idea of which confirmatory techniques need to be applied. This will save both time and resources by limiting the use of unnecessary analytical techniques where there are no components present to justify its use.
Synthetic impurity assessment
The crude and purified samples of new psychoactive substances (NPS) which were analysed, MMC HCl and methylone HCl, showed very little difference in their thermograms (Supplementary Figure 5). Unlike most of the samples that have been run previously, both the crude and pure methylone HCl samples showed quite a strong exothermic peak after the initial endothermic peak. While this may allow for easier differentiation of this compound from other NPS and adulterants, it does not distinguish between the crude and pure samples very well. Both of the drugs analysed in this study are often quite pure after synthesis, and usually the purification process simply involves washing the product with acetone. The level of impurities in the crude samples was confirmed by GC-MS analysis to be quite low (data not shown), meaning that the DSC may not have the sensitivity to adequately detect the impurities. For the purpose of this study, the identity of the impurities were not important, determining whether differentiation between crude and purified sample could be achieved was the aim of these analyses.
It has been shown that DSC analysis can be used to calculate the purity of pharmaceutical standards by utilising melting point depression [23]. The decrease in the temperature of all peaks in both compounds suggests that this technique may be applicable to the NPS samples which have been analysed. This relies on the assumption that the impurities will depress the peaks in the thermogram according to the eutectic phase diagram behaviour [23]. This interpretation often requires a large amount of background information about the system which is being studied. For example, samples of the NPS being tested would need to be analysed with varying amounts of the impurities present to see how they affect the peaks within the thermogram. Once this background information has been collected, this process may be able to be used to identify the purity of seized samples. The fact that many NPS are found to be quite pure may make this process more difficult and the changes in temperature less apparent. The indication of a sample of high purity, however, can itself help to guide confirmatory testing.
DSC may be used to identify what drugs are present within a sample; however, it may not be possible to easily differentiate between pure and crude samples where the level of impurities is quite low. Even without direct identification of all the components within a sample, DSC analysis still has the advantage of being a single technique which can be used to guide analysts to appropriate confirmatory techniques, saving both time and resources in the long run.
Conclusion
While this study has shown that DSC is not suitable for the synthetic route profiling of NPS, it does offer potential for the screening of adulterants added to illicit materials post clandestine synthesis. While complete differentiation and identification of components present in a mixture cannot always be achieved, there are often certain characteristics present which may indicate the presence of a particular substance or narrow the list of possible substances which may be present. The effectiveness of DSC at detecting the presence of sugars in a sample, along with its ability to indicate other components present, show its potential as a universal first pass screening technique to guide analysts towards appropriate confirmatory testing, thereby limiting the unnecessary application of multiple analytical techniques and saving time and resources in the long run.
While there have been challenges in the application of this technique, this study provided a proof-of-concept which has established a foundation and provided leads for further development of DSC as a complementary screening technique. Further work could be conducted to continue to develop the potential of DSC by attempting to improve the differentiation and demonstrate method validation. While the data presented in the current study is mainly observational in nature, further studies should include the development of a data analysis model, which can be subjected to statistical analysis, to determine the optimal method of analysis. It may also be possible to assess the thermal degradation of the substances tested and determine which bonds are breaking and giving rise to the different peaks. This may afford a better understanding of how the technique can best be utilised for the analysis of illicit substances.
References
- United Nations Office on Drugs and Crime (2016) World Drug Report 2016. United Nations publication, Vienna, Europe, pp. 1-174.
- Cole C, Jones L, McVeigh J, Kicman A, Syed Q, et al. (2010) Cut: a guide to adulterants, bulking agents and other contaminants found in illicit drugs. Liverpool John Moores University, England, UK.
- Cole C, Jones L, McVeigh J, Kicman A, Syed Q, et al. (2011) Adulterants in illicit drugs: a review of empirical evidence. Drug Test Anal 3: 89-96.
- Broseus J, Gentile N, Esseiva P (2016) The cutting of cocaine and heroin: a critical review. Forensic Sci Int 262: 73-83.
- Broséus J, Gentile N, Bonadio Pont F, Garcia Gongora JM, Gasté L, et al. (2015) Qualitative, quantitative and temporal study of cutting agents for cocaine and heroin over 9 years. Forensic Sci Int 257: 307-313.
- Morelato M, Beavis A, Tahtouh M, Ribaux O, Kirkbride P, et al. (2014) The use of organic and inorganic impurities found in MDMA police seizures in a drug intelligence perspective. Sci Justice 54: 32-41.
- Lurie IS, Berrier AL, Casale JF, Iio R, Bozenko JS Jr (2012) Profiling of illicit fentanyl using UHPLC-MS/MS. Forensic Sci Int 220: 191-196.
- Marcelo MC, Mariotti KC, Ferrão MF, Ortiz RS (2015) Profiling cocaine by ATR-FTIR. Forensic Sci Int 246: 65-71.
- West MJ, Went MJ (2011) Detection of drugs of abuse by Raman spectroscopy. Drug Test Anal 3: 532-538.
- Dams R, Benijts T, Lambert WE, Massart DL, De Leenheer AP (2001) Heroin impurity profiling: trends throughout a decade of experimenting. Forensic Sci Int 123: 81-88.
- Höhne G, Hemminger WF, Flammersheim HJ (2003) Differential scanning calorimetry. Springer-Verlag Berlin Heidelberg, Europe, pp. 1-298.
- Gabbott P (2008) A practical introduction to differential scanning calorimetry. In: Gabbott P (Ed.) Principles and applications of thermal analysis. Oxford, Blackwell Publishing Ltd, UK, pp. 1-50.
- Biltonen RL, Lichtenberg D (1993) The use of differential scanning calorimetry as a tool to characterize liposome preparations. Chem Phys Lipids 64: 129-142.
- Mathkar S, Kumar S, Bystol A, Olawoore K, Min D, et al. (2009) The use of differential scanning calorimetry for the purity verification of pharmaceutical reference standards. J Pharm Biomed Anal 49: 627-631.
- Bibi S, Bremner DH, Macdougall-Heasman M, Reid R, Simpson K, et al. (2015) A preliminary investigation to group disparate batches of licit and illicit diazepam tablets using differential scanning calorimetry. Anal Methods 7: 8597-8604.
- United Nations Office on Drugs and Crime (2011) World Drug Report 2011. United Nations publication, Vienna, Europe, pp. 1-272.
- ChemSpider (2015) Caffeine.
- PubChem (2004) Creatine.
- Lide DR, Milne GW (1994) Handbook of data on organic compounds (3rdedn). Volume 1, CRC Press, Boca Raton, USA.
- Klímová K, Leitner J (2012) DSC study and phase diagrams calculation of binary systems of paracetamol. Thermochim Acta 550: 59-64.
- Bi M, Hwang SJ, Morris KR (2003) Mechanism of eutectic formation upon compaction and its effects on tablet properties. Thermochim Acta 404: 213-226.
- Smith WF, Hashemi J (2003) Foundations of materials science and engineering. McGraw-Hill, New York, USA, pp. 1-208.
- Giron D, Goldbronn C (1995) Place of DSC purity analysis in pharmaceutical development. J Therm Anal 44: 217-251.