
Journal of Forensic Investigation
Download PDF
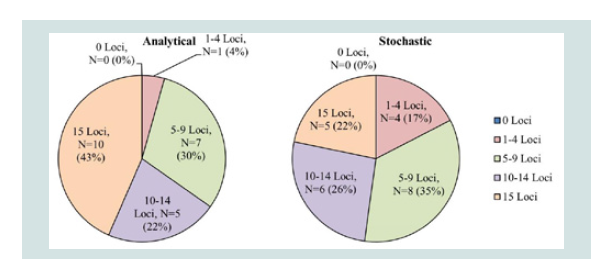 Figure 1: Identifiler Plus results for 500 pg input DNA amplifications (N=23). Level of profile recovery is separated into 5 levels: 0 Loci, 1-4 Loci, 5-9 Loci, 10-14 Loci, and 15 Loci. Number and percentage of the samples that produced the corresponding number of STR loci is listed based on the analytical threshold of 75 RFU and the stochastic threshold of 130 RFU.
 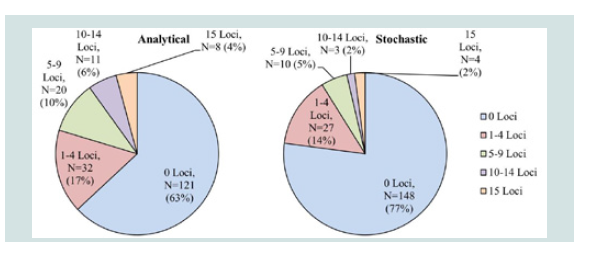 Figure 2: Identifiler Plus results for amplifications containing less than 500 pg input DNA (N=192). Level of profile recovery is separated into 5 levels: 0 Loci, 1-4 Loci, 5-9 Loci, 10-14 Loci, and 15 Loci. Number and percentage of the samples that produced the corresponding number of STR loci is listed based on the analytical threshold of 75 RFU and the stochastic threshold of 130 RFU.
 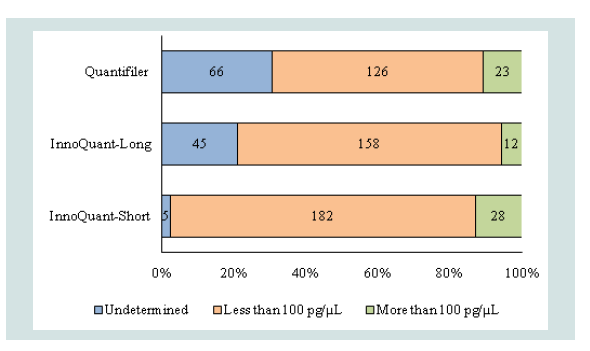 Figure 3: Number and percentage of samples in three levels of DNA quantities measured with Quantifiler, InnoQuant-Long, and InnoQuant-Short. The quantification results of 215 samples were sorted into three categories: undermined, less than 100 pg/μL, and more than 100 pg/μL.
 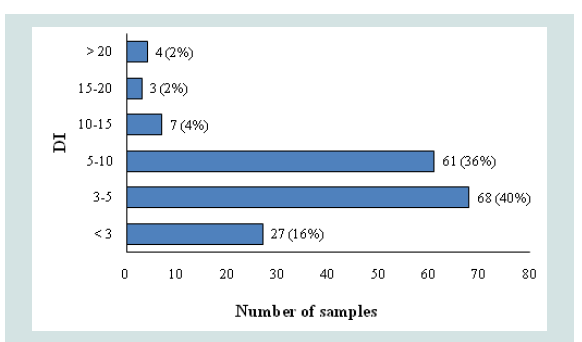 Figure 4: Number and percent of samples in degradation index categories. 170 samples are sorted into 6 levels of DI, and the observed number of the samples is shown.
 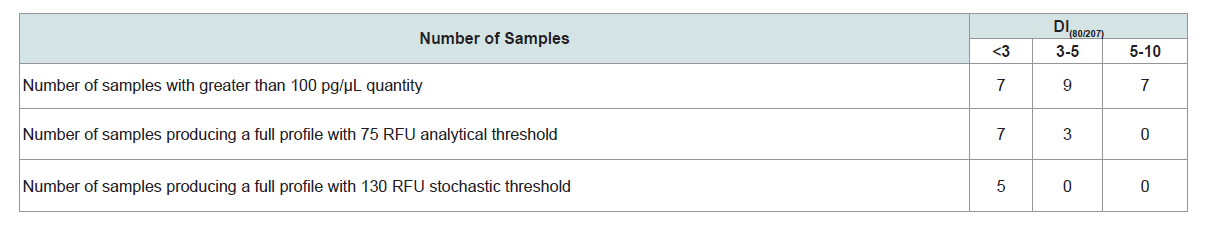 Table 1: Degradation indices (DI) of the 23 property crime samples with greater than 100 pg/μL quantity (as measured with Quantifiler) and their corresponding Identifiler Plus results.
 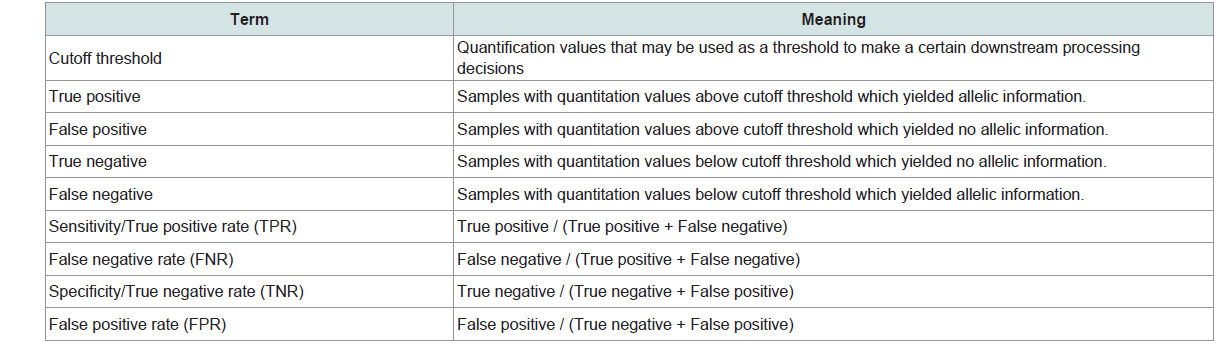 Table 2: Terms and their meanings.
 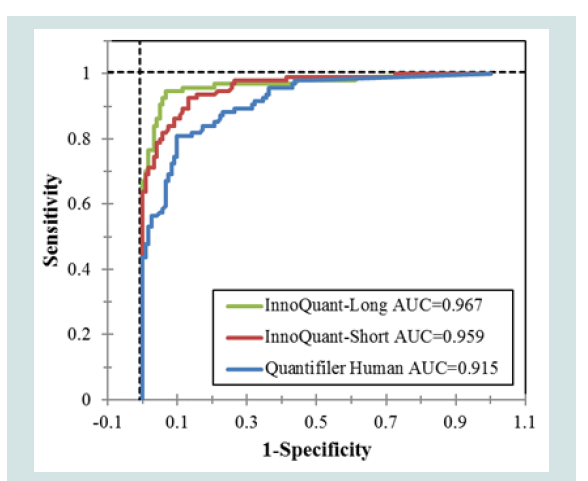 Figure 5: ROC curves of InnoQuant-Short, InnoQuant-Long, and Quantifiler Human targets analyzed with the statistical software JMP Pro 13. ROC curves were used to evaluate the effectiveness of the quantification markers for distinguishing the samples producing STR allelic data from those failing to produce STR allelic data.
 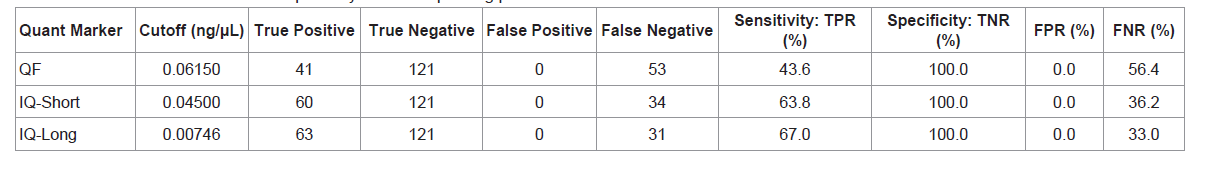 Table 3: Cutoff threshold to maximize specificity and corresponding parameters.
 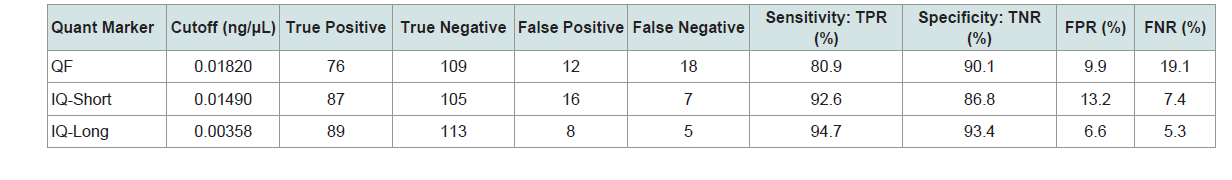 Table 4: Cutoff threshold to optimize specificity and sensitivity and corresponding parameters.
 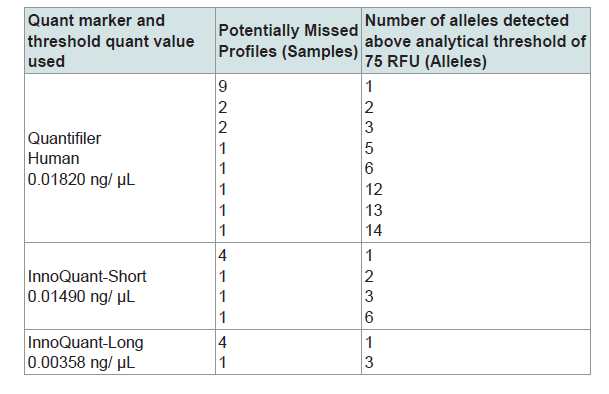 Table 5: List of potentially missed STR profiles using cutoff threshold to optimize specificity and sensitivity for the three quantification targets, and the number of alleles detected above analytical threshold. Many of the alleles listed did not meet the stochastic threshold for reporting.
 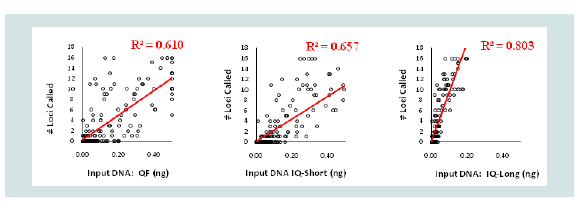 Figure 6: Number of loci called above the 75 RFU analytical threshold plotted against the total input DNA amount placed into the Identifiler PCR reaction as gauged by the Quantifiler (left panel), InnoQuant-Short (middle panel), and InnoQuant-Long (right panel) targets.
  Table 6: List of potentially missed STR profiles using cutoff threshold to optimize specificity and sensitivity for the three quantification targets, and the number of alleles detected above analytical threshold. Many of the alleles listed did not meet the stochastic threshold for reporting.
 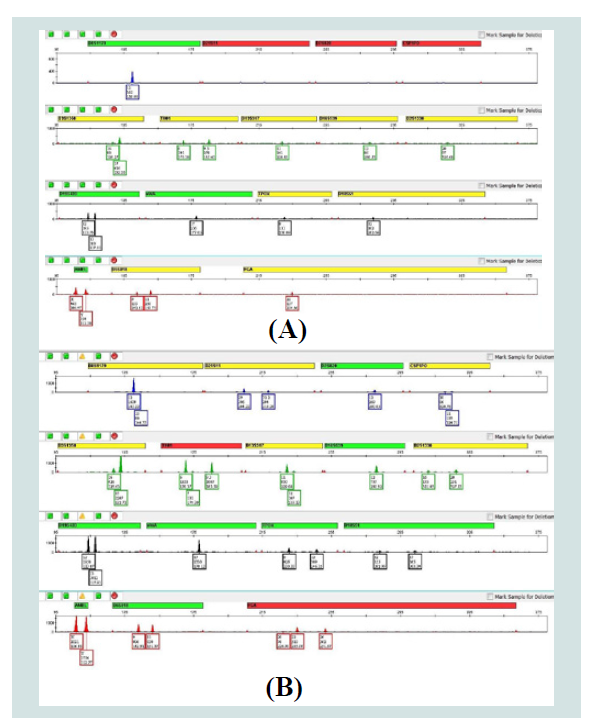 Figure 7: Identifiler Plus electropherograms of a sample amplified using the Quantifiler target to estimate input amount (A) and using the InnoQuant long target to estimate input amount (B).
Research Article
Improving STR Profile Success Rates for Property Crime Specimens using InnoQuant® Human DNA Quantification & Degradation Assessment Kit
Aaron K. LeFebvre1, Sheri Ayers1, Laura Gahn1, Sid Sinha2, Hiromi Brown2, Gina Murphy2 and Sudhir K. Sinha2*
- 1Cellmark Forensics, LabCorp Specialty Testing Group, Dallas, USA
- 2InnoGenomics Technologies, New Orleans, USA
*Address for Correspondence: Sudhir K. Sinha, InnoGenomics Technologies, LLC, 1441 Canal Street, Suite 307; New Orleans, LA 70112, USA, Tel: +504-593-6443; E-mail: ssinha@innogenomics.com
Citation: LeFebvre AK, Ayers S, Gahn L, Sinha S, Brown H, et al. Improving STR Profile Success Rates for Property Crime Specimens using InnoQuant® Human DNA Quantification & Degradation Assessment Kit. J Forensic Investigation. 2017; 5(2): 8.
Copyright: © 2017 LeFebvre AK, et al. This is an open access article distributed under the Creative Commons Attribution License, which permits unrestricted use, distribution, and reproduction in any medium, provided the original work is properly cited.
Journal of Forensic Investigation | ISSN: 2330-0396 | Volume: 5, Issue: 2
Submission: 14 August, 2017 | Accepted: 13 September, 2017 | Published: 20 September, 2017
Abstract
Typical forensic casework DNA specimens may be degraded to varying degrees as a result of environmental insults, storage conditions, or age. These specimens may need to be excessively re-worked since their level of degradation may not be known until after amplification and typing. In this study, the InnoQuant® Human DNA Quantification and Degradation Assessment Kit is used to provide an assessment of the level of degradation of property crime samples, demonstrating how it can be utilized to streamline a laboratory’s workflow.
215 actual casework property crime samples were first processed with Quantifiler® Human and Identifiler® Plus, and retrospectively quantified with the InnoQuant Kit. For samples that did not obtain any STR data, a quantification threshold was evaluated to determine how successfully each qPCR assay could be used as a screening test to identify samples with insufficient DNA for STR profiling. InnoQuant’s long target exhibited the highest Area Under the receiver operating characteristic Curve (AUC=0.967), while exhibiting the highest true positive (sensitivity) and true negative (specificity) rates. For samples that did obtain some STR data, quantification values from each kit were compared with the number of STR loci successfully typed to see how well quantification data correlated with STR profiles. InnoQuant’s long target (R2=0.80) correlated with profile success significantly better than the short target (R2=0.66) or the Quantifiler data (R2=0.61). Finally, samples that had sufficient DNA but did not yield full profiles were re-amplified based on the InnoQuant data to determine if accounting for degradation can improve profile success. Additional alleles were obtained from all samples. The study demonstrates that InnoQuant can be a very effective tool in processing high throughput property crime specimens as a screening test to identify samples that will not produce DNA profiles and by providing more reliable quantification data to obtain optimal STR profiles.
Introduction
Property crime is a category of crime that includes, among others, burglary, larceny, theft, motor vehicle theft, arson, shoplifting, and vandalism. Property crime involves the taking of property, and does not involve force or threat of force against a victim. Property crimes are high-volume crimes, with vehicles, cash, electronics, power tools, cameras, and jewelry often targeted. In September 2016, the FBI released the 2015 edition of its annual report crime in the United States, a statistical compilation of offense, arrest, and police employee data reported voluntarily by law enforcement agencies that participate in the Bureau’s Uniform Crime Reporting (UCR) Program [1]. This latest report reveals that there were an estimated 7,993,631 property crimes (burglaries, larceny-thefts, and motor vehicle thefts) reported by law enforcement in 2015. Financial losses suffered by victims of these crimes were calculated at approximately $14.3 billion.
In 2008, Roman JK et al. found resolution rates of property crime doubled when DNA evidence was collected, prosecutions doubled, and DNA was much more effective than fingerprints in using evidence databases [2]. Therefore, the collection, submittal, and testing of forensic biological evidence in a property crime has been proven an effective tool for the successful resolution of the case. At the advent of DNA testing, most police agencies, as a matter of policy and practice, collected DNA evidence only in violent crimes, such as homicide and sexual assault. This, in part, is based on the belief that it is too expensive to collect biological evidence (and perform DNA analysis) in high-volume crimes, such as property crime. However, the cost of performing DNA analysis has decreased, legislation for the inclusion of non-violent convicted felons in DNA databases was established in many states, and the number of profiles in state and national DNA databases has increased. Based on information in these databases, many property crime offenders do not limit their activities to crimes against property and often escalate to other offenses, including violent crimes and drug deals [3]. Therefore, arresting burglars who otherwise would not be caught and brought to justice, using DNA as part of the criminal investigation, has the potential to prevent future crimes that may be perpetrated by these individuals.
The types of biological samples commonly observed in property crimes are blood, saliva, hair, tissue, human waste, skin cells on items possibly left behind by the offender, and touch DNA. Varying degrees of degradation as a result of environmental insults, storage conditions, or age are typically observed in these types of DNA specimens. These types of samples may need to be excessively re-worked since their level of degradation may not be known until after amplification and detection, at which time adjustments may be made to the amount of input DNA in the amplification reaction in order to produce a useful STR profile (i.e. gain more alleles from degraded DNA samples). As more law enforcement agencies have begun to utilize DNA technology for non-violent crimes, crime laboratories must streamline and refine existing workflows to accommodate an increased number of challenging samples. Given that the cost of DNA testing depends on the quality of the DNA evidence collected and whether or not a profile is obtained, it is crucial to count on tools in the forensic laboratory that will correctly guide the examiner to yield the most probative and useful DNA profile in the first attempt, without resorting to costly and time consuming repeat analysis.
Next-generation qPCR kits for quantification of human DNA aim to provide information on the extent of sample degradation prior to STR amplification in order to adjust input DNA to reduce rework, and associated reagent and processing costs, of degraded forensic DNA specimens [4-7]. Recently, Zupanic Pajnic I et al. reported that the detection of a long quantification target with the PowerQuant® System (a similar qPCR system providing a Degradation Index) is needed in order to obtain useful STR results [8]; however, the degradation ratio ([short quantity value ng/μL] / [long quantity value ng/μL]) is not a good predictor of STR profile success in cases involving ancient and second world war bone samples.
We report here results of retesting performed on actual property crime casework samples using one of these next-generation quantification systems, the InnoQuant® Human DNA Quantification & Degradation Assessment Kit [4]. InnoQuant uses two independent retrotransposable elements (RE) genomic targets to provide an assessment of degradation in a forensic sample: a “Short” high copy number Alu based target of 80 bp, a “Long” target from another high copy number retrotransposon, SVA, of 207 bp, and an internal positive control (IPC) to assess PCR inhibition [9,10]. The use of high copy number REs with qPCR has previously been shown to be advantageous over single-copy loci to increase the sensitivity of detection of human DNA [9-14]. Alu REs are mobile insertions that have amplified to a copy number of over 1 million elements throughout primate evolution and comprise roughly 10% of the human genome [11]. When approached collectively, human specific and primate-specific Alu based assays provide a powerful tool for sensitive human DNA identification and quantitation because of their high copy number. While some recently integrated Alu insertions remain polymorphic in the human population, many ultimately reach fixation for the presence of the Alu insertion. It is these fixed markers that make outstanding candidates for the accurate and sensitive detection of human DNA, while their ubiquitous nature in the human genome provides reproducibility in quantitation values among varying population groups. The InnoQuant kits employ RE targets for the autosomal detection of two different sized fragments of human DNA, which provide a “Degradation Index” [4]. Due to the unique ability of the InnoQuant system to analyze both short and long fragments, Alu and SVA respectively, which are both retrotransposon targets with higher than 1700 copies per cell, this system is extremely sensitive for both autosomal targets [9,10].
The purpose of this study is to retrospectively evaluate property crime case evidence samples that were previously processed using the Applied Biosystems® Quantifiler® Human DNA Quantification Kit (ThermoFisher) as the DNA quantification method for input DNA and determine if the InnoQuant quantification system could provide more useful information compared to the established systems. One of the objectives of this study is to identify samples that are unlikely to produce STR profiles, based on long and short fragment DNA quantification, in order to save processing time and materials. The second objective of this study is to provide a more accurate prediction of the optimal input DNA amount for PCR amplification of these evidence samples in order to obtain the most informative STR DNA profile results.
Materials and Methods
Property crime evidence samples
Two-hundred fifteen property crime samples primarily consisting of touch DNA swab samples along with a few blood sample swabbings (approximately 2%) were tested using Cellmark Forensics’ standard methods in the Biotracks™ high throughput section. The standard methods included extraction of DNA with the BioSprint 96 DNA Blood Kit (Qiagen), quantification with the Quantifiler® Human DNA Quantification Kit (ThermoFisher) and STR typing with the AmpFlSTR Identifiler® Plus PCR Amplification Kit (ThermoFisher) using the manufacturer recommended protocols with one exception: a 12.5 μL Identifiler Plus total reaction volume with a 500 pg input DNA target (5 µL sample volume) was used. The Applied Biosystems® 3130xl Genetic Analyzer was utilized for collection of amplified fragments, and data analysis was performed with GeneMapper® ID using an analytical threshold of 75 RFU and a stochastic threshold of 130 RFU. The input DNA used in the amplification reaction was determined by the Quantifiler Human DNA quantification results. Herein the sex determining marker, Amelogenin, was excluded from the Identifiler Plus STR profile recovery analysis since it is one of the smallest amplicon markers, composing of only two alleles, X and Y. In addition, the size difference between X and Y is ~5 bp [15].
Quantification methods
In this study, reanalysis was performed between 2-6 months after being tested and reported using the standard methods described above (storage of DNA extracts at -20 °C). The 215 property crime samples, previously analyzed with the Quantifiler kit, were quantified with the InnoQuant kit (InnoGenomics Technologies). The InnoQuant kit uses TaqMan™ assay real-time PCR technology with a set of fluorescent dyes that allows the detection of three targets (two genomic targets plus an internal PCR control) to be amplified in one reaction. The InnoQuant kit utilizes two independent retrotransposon genomic targets (each over 1,700 copies per genome) to obtain quantification of an 80 bp "Short" DNA fragment and a 207 bp "Long" DNA fragment in the presence of a synthetic target as an internal positive control (IPC) providing an assessment for the presence of PCR inhibitors in the test sample [4]. In contrast, the Quantifiler Human kit utilizes a single copy genomic target in the presence of an IPC [16]. The InnoQuant system’s short, long, and IPC targets are labeled with FAM, Cy5, and Cy3, respectively. The short fragment is from the Yb8 Alu sequence, and the long fragment is from a separate RE, SVA, both having copy numbers in excess of 1700 copies per genome [9-10].
Assessment of DNA degradation with the InnoQuant degradation index
The ratio of the two quantitation values of “Short” and “Long” quantities of InnoQuant provides a "Degradation Index", or a qualitative measure of a sample's degradation. Degradation Indices (DI) for the 215 DNA samples were determined by the ratio of the two InnoQuant targets, or DI (80/207)=[short quantity value ng/μL] / [long quantity value ng/μL]. The DI provides an estimate of how degraded a sample is. A DI of 1 is a high quality sample and a DI greater than 3 usually indicates moderate degradation. The higher the DI, the more degraded a sample is [4]. The effect of DNA degradation on STR profile recovery was assessed with the samples that were amplified with a sufficient amount (500 pg) of DNA template input based on the Quantifiler results.
Statistical analysis
Area-Under-the-Receiver-Operating-Characteristic Curve (AUROC or AUC) was analyzed to assess predictive power of each quantification target (Quantifiler Human, InnoQuant-Short, and InnoQuant-Long) using the JMP Pro 13 software (SAS, Buckinghamshire, UK) [17]. Various quantity cutoff values of each method were evaluated to examine true positive and true negative rates in order to identify samples with insufficient DNA for STR profiling [18]. Linear regression analysis was performed to find correlations between levels of STR profile recovery and total amounts of DNA template input obtained by each target, and the resulting R squared values were assessed.
Optimizing the target DNA input for STR typing
Based on the initial Quantifiler results, 23 samples should have had sufficient DNA to reach the target 500 pg input DNA to obtain a full profile with Identifiler Plus. Of these, 13 samples did not produce allelic data above the analytical threshold at some loci, and 18 samples did not produce allelic data above stochastic threshold at some loci. To evaluate whether targeting the amplification reaction with InnoQuant could improve the results for these samples, those with sufficient remaining DNA extract (n=6) were re-amplified with Identifiler Plus based on the InnoQuant-Long quantification value.
Results and Discussion
From the initial testing described above, 23 out of 215 samples had sufficient concentrations (above 100 pg/μL), based upon the Quantifiler results, to reach the desired input DNA target of 500 pg. The rest of the samples (192 samples; ~90% of total samples) did not have a sufficient DNA concentrations to reach 500 pg input for Identifiler Plus STR typing. Figure 1 summarizes the STR results for the 23 samples that were amplified with a sufficient amount of DNA input based upon the Quantifiler results. Among the 23 samples with 500 pg DNA input, only 10 samples achieved allelic data for all 15 STR loci with the analytical threshold of 75 RFU. When the stochastic threshold of 130 RFU is applied, the number of the samples that achieved 15 STR loci is reduced to 5 samples. It should be noted that no samples exhibited inhibition, based on the IPC results. Unexpectedly, more than half of the samples with 500 pg DNA target input did not produce a full STR profile using either the analytical or stochastic thresholds. A likely explanation for the poor profile recoveries with seemingly sufficient DNA input (500 pg) is that these DNA samples were likely degraded to some extent. However, the level of DNA fragmentation is not retrievable from the Quantifiler results.
Figure 2 summarizes STR typing results for the rest of the samples (N=192). The Quantifiler quantification results for these samples were all less than 100 pg/μL. Therefore, these samples did not achieve the desired 500 pg input DNA for Identifiler Plus amplifications, meaning that less than 500 pg of DNA was amplified. Among these samples, 121 samples (63%) exhibited no STR allele calls, and 71 samples (37%) achieved at least 1 allele call above the analytical threshold. When the stochastic threshold was used, 148 samples (77%) produced no STR allele calls, and 44 samples (23%) achieved at least 1 allele call. Eight samples had STR allele data at all 15 STR loci above analytical threshold, and 4 samples had STR allele data at all 15 STR loci above the stochastic threshold.
The quantification results for the 215 case samples using Quantifiler, InnoQuant-Long, and InnoQuant-Short are summarized in Figure 3. The DNA quantification results of 215 samples were sorted into three categories: “undetermined” (i.e. no quantification value obtained), less than 100 pg/μL, and more than 100 pg/μL. With the initial testing using the Quantifiler Kit, 66 samples (31% of all 215 samples) produced an “undetermined” result. In contrast, with the InnoQuant-Long target, 45 samples (21%) produced an “undetermined” result, whereas only 5 samples (2%) produced an “undetermined” result with the InnoQuant-Short target (Figure 3). This is not unexpected, given the differences in the genomic targets for these two kits: the Quantifiler Human Kit employs a single copy target, and the InnoQuant Kit employs multi-copy targets; the Yb8 Alu (short target) lineage contains approximately 1800 copies per genome and SVA (long target) contains approximately 1700 full length element copies per genome [9,10,16]. The large copy number targets utilized in InnoQuant provide a highly sensitive dynamic range, while minimizing the effect of variation between individuals, resulting in highly reproducible quantitation values. The InnoQuant system can accurately and consistently measure the DNA quantity in a sample as low as 1 pg/μL [4]. In this study, the InnoQuant Kit, particularly the short target, exhibited the highest sensitivity thereby greatly reducing false negatives. In addition to target copy number, the amplicon size of the target sequence also influences the sensitivity of a quantification result when DNA samples are degraded. The amplicon size of InnoQuant-Long is 207 bp which is the longest amplicon of the three targets tested in this study. The amplicon size of InnoQuant-Short is 80 bp, and that of Quantifiler is 62 bp [4,16]. There were 45 samples that did not produce quantification values (“Undetermined”) with the InnoQuant-Long target, which is nine times higher than that of the InnoQuant-Short target (Figure 3). This indicates that some samples in the “less than 100 pg/μL” category, as measured with the InnoQuant-Short target, were degraded to some extent and that those samples were not able to be quantified with the InnoQuant-Long target. Interestingly, the Quantifiler target exhibited the highest number of “undetermined” (66 samples) despite having the shortest amplicon size of 62 bp, which demonstrates the power of the multi-copy DNA targets in InnoQuant for increased sensitivity. It should be noted that the InnoQuant runs were performed between 2-6 months after the initial Quantifiler runs with DNA extract storage at -20 °C, and therefore, no degradation of the DNA extracts was expected during this time period. Comparison of the InnoQuant-Short and InnoQuant-Long results for the higher DNA quantities (more than 100 pg/μL) suggests that some of them were also degraded, as more samples have DNA quantities above 100 pg/μL when measured with InnoQuant-Short (28 samples) as compared to the InnoQuant-Long measurements (12 samples).
Assessment of degradation for the DNA samples by DI(80/207) and its effect on downstream amplification
Degradation indices of the samples obtained from the InnoQuant Short and Long quantity results were assessed. Forty-five samples that did not have sufficient quantity values to calculate the DI (i.e. the long target produced an “undetermined” result, Figure 3) were omitted from this analysis. Figure 4 shows the total of 170 samples grouped by DI of the InnoQuant assay. 27 samples (16%) had a DI less than 3, and the vast majority of property crime samples (76%) exhibited a DI between 3 and 10 (68 samples for DI=3-5 and 61 samples for DI=10-15). From previous studies with InnoQuant it has been shown that samples with a DI>3 are likely to exhibit some allele dropout and samples with a DI>5 almost always exhibit allele dropout [7]. Approximately 84% of the samples had a DI>3 and 44% had a DI>5. This indicates sufficient degradation to cause issues in obtaining optimal DNA STR typing results.
According to the manufacturer, the optimal amount of input DNA, to obtain a full STR profile using Identifiler Plus is 1 ng, which would equal a quantification value of 100 pg/μL with addition of 10 μL sample volume in a full PCR reaction volume (25 μL) [15]. In this study, a half reaction volume (12.5 μL) was used for the Identifiler Plus amplification. Therefore, the optimal amount of DNA is 500 pg, and the sample volume would be 5 μL with a quantification value of 100 pg/μL.
Only 23 of the 215 samples had a quantification value of at least 100 pg/μL, as measured by the original Quantifiler Human assay. Based upon the Quantifiler results, 500 pg, for each DNA sample, was amplified in a half reaction volume (12.5 μL) with Identifier Plus. There were seven samples with a DI value <3, nine samples with DI between 3-5, and seven samples with DI between 5-10 (Table 1). Of the samples that purportedly had enough DNA input to produce a full profile, only those with DI<3 actually produced full STR profiles with 100% efficiency when the analytical threshold of 75 RFU was applied. When the stochastic threshold of 130 RFU was used, the number of the samples that produced a full profile decreased from seven to five samples. Only three out of nine samples (33%) with DI=3-5 produced a full profile with the 75 RFU analytical threshold, and none of those samples produced a full profile with the 130 RFU stochastic threshold. The samples with DI=5-10 did not produce full profiles with either the analytical or the stochastic threshold despite the fact that a target input amount of 500 pg DNA was utilized for the of Identifiler Plus amplifications. This indicates that even moderate degradation in a sample has extensive downstream implications for obtaining optimal STR profiles. These observations clearly illustrate the importance of knowing a sample’s degradation level prior to proceeding to STR amplification and genotyping.
Evaluation of Quantifiler and InnoQuant targets as a predictor of STR outcome by ROC curve analysis
A majority of samples used in this study had insufficient DNA to obtain a usable DNA profile. There were 121 samples that produced no STR profile data above the analytical threshold, and 148 samples that had no allelic data above the stochastic threshold. 154 samples did not produce STR profile results for at least 5 loci (72% of the 215 samples) with the established analytical threshold, and 179 samples did not produce STR profile results for at least 5 loci (83% of the 215 samples) with the established stochastic threshold (Figures 1 and 2). Identifying samples that are unlikely to produce STR profiles during the quantification stage could eliminate unnecessary processing of a significant number of submitted samples.
The quantitation values from Quantifiler and InnoQuant were evaluated to assess if the DNA quantification values obtained could accurately predict which samples would not produce STR profiles. The predictive capability of each quantification method was examined by means of the area under the receiver operating characteristic, ROC curve (AUC). The ROC curve is a popular method of displaying the accuracy of a marker for distinguishing between two populations. In a ROC curve, sensitivity is plotted as a function of 1-Specificity for different cutoff points of a parameter. Each point on the ROC curve represents a sensitivity/specificity pair corresponding to a particular decision threshold. Accuracy of a test is measured by the area under the ROC curve, or AUC. An AUC of 1 represents a perfect test; an AUC of 0.5 represents no predictive capability [17]. In this study, ROC curves were used to evaluate the effectiveness of the quantification markers (Quantifiler, InnoQuant-Short, and InnoQuant-Long) for distinguishing the samples producing STR allelic data from those failing to produce STR results. Terms that are associated with ROC analysis are summarized in Table 2 with the corresponding meaning as they are applied in this study.
Figure 5 shows the ROC curves of the InnoQuant-Short and InnoQuant-Long targets. InnoQuant-Long exhibited the highest AUC of 0.967, followed by InnoQuant-Short with an AUC of 0.959. The lowest AUC of the three methods was Quantifiler with AUC of 0.915. This result indicates that quantification with InnoQuant-Long has the best predictive capability for the downstream application of STR typing in this study.
Evaluation of cutoff threshold values for each quantification marker
Two quantitation cutoff threshold values for each quantification marker were chosen based on the following criteria. The cutoff threshold values listed in Table 3 were selected to maximize specificity (i.e. maximizing the number of true negatives). If these quantity cutoff values are selected, none of the samples yielding zero allelic information would be subjected to STR typing. However, the highest specificity comes at the expense of sensitivity. The sensitivity of Quantifiler is less than 50% with 53 false negatives. InnoQuant-Short and InnoQuant-Long have better sensitivities (63.8% for Short and 67.0% for Long) compared to Quantifiler with less false negatives (34 samples for InnoQuant-Short and 31 samples for InnoQuant-Long). InnoQuant-Long exhibited the lowest number of false negatives of all the targets tested (Table 3).
The cutoff threshold values listed in Table 4 were selected to optimize the quantification markers’ differentiating ability when equal weight is given to specificity and sensitivity. From the maximum of Youden's index (J) of the ROC curve, which is J=maximum {sensitivity + specificity - 1}, a cutoff value to optimize both sensitivity and specificity with the same weight can be found [17,18]. With the cutoff values listed in Table 4, an increase in sensitivity and a decrease in specificity for each marker, compared to the cutoff values selected to maximize specificity, can be seen (Table 3). The false negative rates are drastically reduced with these specified cutoff values. Comparisons of sensitivity and specificity for the three quantification markers show that InnoQuant-Long has the highest sensitivity (94.7%) and the highest specificity (93.4%) with 6.6% false positive rate and 5.3% false negative rate. Quantifiler exhibits the highest number of false negatives (18 samples), and InnoQuant-Long exhibits the lowest number of false negatives (5 samples). The false negative samples are of highest concern for the screening application, as they would be potentially excluded from STR typing even though they may contain useful allelic information. Table 5 lists the false negative samples of each quantification marker with their respective potentially missed STR profiles. Using the thresholds listed in Table 4, the 5 samples that were potentially missed with InnoQuant-Long contain very minimal STR information: 4 samples exhibited 1-allele profile and 1 sample exhibited a 3-allele profile (Table 5). These partial STR profiles are not interpretable or useful and would likely be reported by a crime laboratory as “no conclusion can be drawn”. The severity of missing profiles increases with an increase in false negative rates. InnoQuant-Short exhibits a higher false negative rate (7.4%) than that of InnoQuant-Long (5.3%) as a result of the addition of two more samples into the false negative category, one with a 2-allele profile and the other with a 6-allele profile. Quantifiler exhibits the highest false negative rate of 19.1% with 18 false negative samples (Table 4). Three of these samples contain more than 10 alleles, which are useful profiles for identification and possible database upload. All of the analyses performed here with the AUC analysis indicate that InnoQuant-Long has the best predictive capability for the downstream STR application.
Correlation between STR results and quantification by three targets
The vast majority of samples tested did not have a sufficient DNA concentration to reach the target 500 pg of total input DNA in the PCR reaction. As a result, these samples were amplified with no dilution. The total input DNA could be determined based on the quantitation values. A comparison was done to see how well the predicted input DNA for the different quantitation targets correlated with the number of loci that produced allelic data. To determine how well the predicted input DNA from different quantitation targets correlated with the number of loci exhibiting allelic STR data, the samples’ total input DNA into the Identifiler PCR reaction as determined by the Quantifiler, InnoQuant-Short, and InnoQuant-Long targets were analyzed for the number of loci detected above the analytical threshold of 75 RFU by the Identifiler Plus kit (Figure 6). Eleven samples with high DNA quantity values that gave full STR profiles and reached the saturation maximum for alleles produced are not included in Figure 6. The plotted data were then fitted into a linear model by using the least squares method to calculate the line of best fit, and resulting R squared values were compared. R squared (R2) is a statistical measure of how close the data are to the fitted regression line. These results show that input DNA estimated by the InnoQuant-Long target was the best predictor of STR profile success with a much stronger correlation (R2=0.80) than Quantifiler (R2=0.61) or the InnoQuant-Short (R2=0.66) targets. This is likely due to the fact that the InnoQuant-Long target is 207 bp in size which is in the mid-range of a typical STR marker. The alleles of Identifiler Plus range from ~100 bp up to ~360 bp [15]. The 62 bp target size for Quantifiler and the 80 bp target size of InnoQuant-Short can be as good a predictor as InnoQuant-Long when one significant condition is met, i.e. there is no degradation in the tested DNA samples.
Of the 23 samples that had sufficient DNA concentrations to amplify the target 500 pg of total DNA, 13 did not produce allelic data above analytical threshold at some loci. Examining the DI of these samples revealed that all of these samples had a DI>3, which indicated at least moderate degradation (Table 1). To evaluate whether targeting with InnoQuant could improve the results for these samples, the samples with sufficient remaining DNA extracts were re-amplified based on the InnoQuant-Long quantification value. As Table 6 demonstrates, if the InnoQuant-Long quantitation value is used to target samples, significantly more allelic data will be obtained from degraded samples. Using InnoQuant can help improve first pass success rates and minimize sample reprocessing. Figure 7 shows the electropherograms of Sample E’s two amplifications and demonstrates the improved allele recovery if the InnoQuant-Long target is used to estimate the DNA input amount. For this sample, using Quantifiler, 8 loci were recovered above stochastic threshold, whereas using the InnoQuant-Long target a nearly complete 14-locus profile was recovered above stochastic threshold for this sample.
Conclusion
The use of assays to provide information about the degradation state of a forensic sample has been previously published [19-22]. Laboratories that process forensic samples, particularly those that identify human remains which may be in an increased state of degradation, greatly benefit from having information regarding the quality or integrity of a sample prior to PCR amplification of the typing system. The present study demonstrated that actual forensic property crime samples also exhibit moderate to high degradation states, which may cause issues with targeting STR or other typing systems. Using a qPCR system that targets multi-copy REs (over 1700 copies/genome) provides an added benefit to these laboratories, namely increased sensitivity of both short and long sized fragments, and reproducibility of quantity values among population groups [4,7].
In this study, 215 property crime samples primarily consisting of touch DNA swab samples were extracted and quantified first with the Quantifiler Human system, and retrospectively with the InnoQuant system. The quantification results for the evidence samples revealed the majority (89% with Quantifiler, 94% with InnoQuant-Long, and 87% with InnoQuant-Short) had DNA concentrations less than 100 pg/μL, and these samples were not able to reach the optimal amount of DNA template input recommended by the manufacturer for the Identifiler Plus amplification reactions (Figure 3). In addition to the low level DNA concentrations, the majority of these evidence samples were moderately or highly degraded, as 84% of the samples among those that gave a quantity value with both InnoQuant-Short and InnoQuant-Long had DI(80/207) values above 3 (Figure 4). These data confirm anecdotal observations that laboratories deal with many low quality DNA evidence samples from which obtaining useful STR profiles is challenging. In fact, 121 out of 215 samples (56%) tested in this study produced no STR profile data above the analytical threshold. It would be better to identify these STR true negative samples during the quantification stage in order to eliminate the unnecessary processing of a significant number of samples. This will lead to a more efficient workflow with a high throughput rate for sample processing while saving money and time.
Assessment of the predictive capability of each quantification method using ROC analysis revealed that the InnoQuant-Long target had the highest capability with AUC of 0.967 (Figure 5). This may be due to its size correlation with STR fragments as well as its high copy number SVA target, providing the most sensitive and accurate qPCR quantitation system for “STR amplifiable” DNA fragments. The correlation analysis clearly exhibited that InnoQuant-Long quantity data correlated with profile success significantly better than the other targets studied (Figure 6). With the aid of Youden's Index, the optimal cutoff threshold quantity was identified as 0.00358 ng/μL for InnoQuant-Long with the true positive rate (sensitivity) of 94.7% and the true negative rate (specificity) of 93.4% [18]. In other words, if these 215 property crime samples investigated retrospectively in this study were quantified initially using InnoQuant, and if only the DNA samples having equal to or higher than the cutoff threshold quantity of 0.00358 ng/μL proceeded to amplification, the laboratory could have saved processing of 113 (out of 121) STR true negative samples while greatly reducing the number of false negatives (5 with InnoQuant-Long vs. 18 with Quantifiler). At the same time, the laboratory would have obtained STR data from 89 (out of 94) STR true positive samples (Table 4). The 5 STR true positive samples that would be missed from the STR amplification contained very minimal STR information: four samples with 1 allele and one sample with 3 alleles, and only eight STR true negative samples would be subjected to the STR amplification (Tables 4 and 5). The vast majority of forensic samples in this study exhibited at least moderate degradation, including the samples that had a sufficient concentration (above 100 pg/μL) for optimal STR amplification. However, this study showed that Quantifiler could not predict failure in obtaining a full STR profile from these DNA samples with higher concentrations. InnoQuant provides an informative tool, the Degradation Index (DI), to assess the degradation status of DNA samples, which can be used by an examiner to make an adjustment to target DNA input in order to obtain optimal DNA profiles, which may result in improving the first pass success rates and minimizing sample reprocessing, or alternatively, make more informed choices at the quantitation stage such as proceeding directly with alternative typing systems such as mini-STR, INDEL or INNUL analysis, or mtDNA testing.
The sensitivity and specificity thresholds determined in this study are specific to this sample set and are subject to vary with different laboratory processes, amplification kits, or quantitation kits than those used in this study. For example, the optimal DNA quantification cutoff values for screening and other parameters such as number of allele recovered etc. may differ when using newer STR kits such as the GlobalFiler™ PCR Amplification Kit or the PowerPlex® Fusion System. For this reason, laboratories should use a similar approach during internal validation studies to both develop thresholds specific to their process and test these thresholds with a fresh set of casework-like samples. However, this study clearly indicates the predictive value of the InnoQuant system, and particularly the InnoQuant long target, for increasing downstream STR recovery in the processing of property crime evidence, or other forensic samples exhibiting DNA degradation.
As more law enforcement agencies have begun to utilize DNA technology for non-violent crimes, crime laboratories must streamline and refine existing workflows to accommodate an increased number of challenging samples. Overall, this study demonstrates that the InnoQuant DNA degradation assessment and quantification system can be a very effective tool in the processing of high throughput property crime specimens. InnoQuant can be used as a screening test to identify samples that will not produce informative DNA profiles, and also can provide more reliable quantification data to obtain optimal STR profiles.
Acknowledgment
This material is based upon work supported by the National Science Foundation under Grant No. 1230352. Any opinions, findings, and conclusions or recommendations expressed in this material are those of the authors and do not necessarily reflect the views of the National Science Foundation.
References
- (2015) About crime in the U.S. (CIUS): by offense, by region, by state, by local agency. Crime in the United States.
- Roman JK, Reid S, Reid J, Chalfin A, Adams W, et al. (2008) The DNA field experiment: cost-effectiveness analysis of the use of DNA in the investigation of high-volume crimes. Document No: NCJ 222 318, Urban Institute Justice Policy Center, Washington, D.C., USA.
- Zedlewski E, Murphy MB (2006) DNA analysis for “minor” crimes: a major benefit for law enforcement. National Institute Justice J.
- Pineda GM, Montgomery AH, Thompson R, Indest B, Carroll M, et al. (2014) Development and validation of InnoQuant™, a sensitive human DNA quantitation and degradation assessment method for forensic samples using high copy number mobile elements Alu and SVA. Forensic Sci Int Genet 13: 224-235.
- Ewing MM, Thompson JM, McLaren RS, Purpero VM, Thomas KJ, et al. (2016) Human DNA quantification and sample quality assessment: developmental validation of the PowerQuant(®) system. Forensic Sci Int Genet 23: 166-177.
- Holt A, Wootton SC, Mulero JJ, Brzoska PM, Langit E, et al (2016) Developmental validation of the Quantifiler(®) HP and Trio Kits for human DNA quantification in forensic samples. Forensic Sci Int Genet 21: 145-157.
- Loftus A, Murphy G, Brown H, Montgomery A, Tabak J, et al. (2017) Development and validation of InnoQuant® HY, a system for quantitation and quality assessment of total human and male DNA using high copy targets. Forensic Sci Int Genet 29: 205-217.
- Zupanič Pajnic I, Zupanc T, Balazic J, Gersak ZM, Stojkovic O, et al. (2017) Prediction of autosomal STR typing success in ancient and Second World War bone samples. Forensic Sci Int Genet 27: 17-26.
- Shewale JG, Schneida E, Wilson J, Walker JA, Batzer MA, et al. (2007) Human genomic DNA quantitation system, H-Quant: development and validation for use in forensic casework. J Forensic Sci 52: 364-370.
- Wang H, Xing J, Grover D, Hedges DJ, Han K, et al. (2005) SVA elements: a hominid-specific retroposon family. J Mol Biol 354: 994-1007.
- Walker JA, Kilroy GE, Xing J, Shewale J, Sinha SK, et al. (2003) Human DNA quantitation using Alu element-based polymerase chain reaction. Anal Biochem 315: 122-128.
- Walker JA, Hedges DJ, Perodeau BP, Landry KE, Stoilova N, et al. (2005) Multiplex polymerase chain reaction for simultaneous quantitation of human nuclear, mitochondrial, and male Y-chromosome DNA: application in human identification. Anal Biochem 337: 89-97.
- Nicklas JA, Noreault-Conti T, Buel E (2012) Development of a real-time method to detect DNA degradation in forensic samples. J Forensic Sci 57: 466-471.
- Shewale JG, Liu RH (2014) Forensic DNA analysis: current practices and emerging technologies. CRC Press, Taylor & Francis Group, Boca Raton, USA, pp. 405.
- Wang DY, Chang CW, Lagacé RE, Calandro LM, Hennessy LK (2012) Developmental validation of the AmpFℓSTR® Identifiler® Plus PCR amplification kit: an established multiplex assay with improved performance. J Forensic Sci 57: 453-465.
- Green RL, Roinestad IC, Boland C, Hennessy LK (2005) Developmental validation of the Quantifiler real-time PCR kits for the quantification of human nuclear DNA samples. J Forensic Sci 50: 809-825.
- Hajian-Tilaki K (2013) Receiver Operating Characteristic (ROC) curve analysis for medical diagnostic test evaluation. Caspian J Intern Med 4: 627-635.
- Schisterman EF, Perkins NJ, Liu A, Bondell H (2005) Optimal cut-point and its corresponding Youden Index to discriminate individuals using pooled blood samples. Epidemiology 16: 73-81.
- Hudlow WR, Chong MD, Swango KL, Timken MD, Buoncristiani MR (2008) A quadruplex real-time qPCR assay for the simultaneous assessment of total human DNA, human male DNA, DNA degradation and the presence of PCR inhibitors in forensic samples: a diagnostic tool for STR typing. Forensic Sci Int Genet 2: 108-125.
- Hughes-Stamm SR, Ashton KJ, van Daal A (2011) Assessment of DNA degradation and the genotyping success of highly degraded samples. Int J Legal Med 125: 341-348.
- Swango KL, Timken MD, Chong MD, Buoncristiani MR (2006) A quantitative PCR assay for the assessment of DNA degradation in forensic samples. Forensic Sci Int 158: 14-26.
- Smith BC, Vandegrift E, Fuller VM, Allen RW, School of Forensic Sciences (2015) Evaluation of degradation in DNA from males with a quantitative gender typing, endpoint PCR multiplex. J Forensic Sci 60: 399-408.