
Journal of Cytology & Molecular Biology
Download PDF
Research Article
*Address for Correspondence: Masood Sepehrimanesh, Ph.D, Gastroenterohepatology Research Center, Shiraz University of Medical Sciences, Po. Box: 7134845794, Shiraz, Iran, Tel/Fax: +98-71-36474263; E-mail:sepehrimaneshmasood@gmail.com
Citation: Sepehrimanesh M, Kazemipour N. Relationship Between the Types of the Extraction Buffer with Quality of the 2-Dimensional Electrophoresis Proteomic Map. J Cytol Molecul Biol. 2015;2(1): 3.
Copyright © 2015 Sepehrimanesh M, et al. This is an open access article distributed under the Creative Commons Attribution License, which permits unrestricted use,distribution, and reproduction in any medium, provided the original work is properly cited.
Journal of Cytology & Molecular Biology | Volume: 2, Issue: 1
Submission: 18 January 2015| Accepted: 03 March 2014 | Published: 08 March 2014
 Table 1: Differences in the 2-DE map of rat testis by using three different buffers.
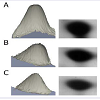
Relationship Between the Types of the Extraction Buffer with Quality of the 2-Dimensional Electrophoresis Proteomic Map
Masood Sepehrimanesh1* and Nasrin Kazemipour2
- 1Gastroenterohepatology Research Center, Shiraz University of Medical Sciences, Shiraz, Iran
- 2Department of Biochemistry, School of Veterinary Medicine, Shiraz University, Shiraz, Iran
*Address for Correspondence: Masood Sepehrimanesh, Ph.D, Gastroenterohepatology Research Center, Shiraz University of Medical Sciences, Po. Box: 7134845794, Shiraz, Iran, Tel/Fax: +98-71-36474263; E-mail:sepehrimaneshmasood@gmail.com
Citation: Sepehrimanesh M, Kazemipour N. Relationship Between the Types of the Extraction Buffer with Quality of the 2-Dimensional Electrophoresis Proteomic Map. J Cytol Molecul Biol. 2015;2(1): 3.
Copyright © 2015 Sepehrimanesh M, et al. This is an open access article distributed under the Creative Commons Attribution License, which permits unrestricted use,distribution, and reproduction in any medium, provided the original work is properly cited.
Journal of Cytology & Molecular Biology | Volume: 2, Issue: 1
Submission: 18 January 2015| Accepted: 03 March 2014 | Published: 08 March 2014
Abstract
Objective: It seems that the type of buffer for extraction of proteins from each sample is important. However, the most widely used buffer in these researches is rehydration buffer. In this study, we compared the 2 dimensional electrophoresis (2-DE) maps from different buffers.Materials and methods: 2-DE map of rat testicular tissue obtained by three distinct buffer included phosphate buffer saline (PBS (A), Tris-HCl (B), or lysis buffer (C) were evaluated and compared.
Results: 2-DE map of rat testicular tissue obtained by three distinct buffer included phosphate buffer saline (PBS (A), Tris-HCl (B), or lysis buffer (C) were evaluated and compared.
Conclusion: Our results demonstrated that using buffer 0.05 M Tris-HCl, 10% sucrose, pH 6.80 was provided good comparable results with rehydration buffer. However, buffer A was not appropriate for 2-DE. Due to the expensiveness of CHAPS and ampholite, which were used in the rehydration buffer, the replacing of it with buffer B that produced good 2-DE is recommended.
Introduction
Appropriate sample preparation is critical for obtaining high quality two-dimensional electrophoresis (2-DE) separations and reliable results in a proteomic analysis [1,2].The first step of sample preparation is the effective disruption of the cell membrane to release the entire array of proteins followed by centrifugation at relatively high speed. Before that, sample solution must be prepared by using appropriate buffer. Various buffers with different compositions, ionic strength, molarity and pH value were used, but deciding about the selection of certain buffer is still difficult. The 2-DE sample rehydration buffer (RHB) is widely used to denature and solubilize protein samples. On the other hand, phosphate saline (PBS) and Trishydrochloride (Tris-HCl) buffers are used for sample preparation for 2-DE and other analytical methods. In this study, we compare 2-DE gel patterns obtained by rat testes tissue preparation using the three conventional distinct buffers, Tris-HCl, PBS and RHB.Materials and Methods
ReagentsUrea, 3-[(3-cholamidopropyl)-dimethylammonio]-1-propane sulfonate (CHAPS), iodoacetamide, Tris, acrylamide, methylene bisacrylamide, sodium dodecyl sulphate (SDS), ammonium persulfate (APS), N,N,N′,N′-tetramethylethylenediamine (TEMED), glycerol, DTT, 2 mercapto ethanol (2 ME), Bromophenol blue (BPB) was purchased from Sigma. IPG strips (7 cm length) werepurchased from Bio-Rad, Hercules, CA,USA. Sodium monophosphate, hydrochloric acid (HCl) and sodium hydroxide were purchased from Merk.
Animals
One fourteen-weeks old male Sprague Dawley rat was selected. The animal was sacrificed by cervical dislocation and testes was immediately removed. Left testes frozen and stored in -70 °C until sodium dodecylsulfate–polyacrylamide gel electrophoresis (SDSPAGE) and 2DE gel analysis.
Protein extraction and 2 DE
Left testes from one fourteen-weeks old male Sprague Dawley rat was used. Three hundred mg of testis tissue was placed in a crucible on ice along with 6 Vol of a solution A (0.1 M phosphate buffer saline, pH 7.4), B (0.05 M Tris-HCl, 10% sucrose, pH 6.80), or C (8 M urea, 2% (v/v) CHAPS, 2% (v/v) immobilized pH gradient (IPG) buffer (pH 3-10 NL), and 2% (w/v) DTT). The tissue was thoroughly minced with surgical scissors and then grounded manually under liquid nitrogen. The homogenates were centrifuged at 14000 rpm for 15 min at 4 °C to remove tissue and cellular debris and supernatents were used as the source of protein. Protein concentration was determined according to the method proposed by Bradford, using BSA as a standard protein [3]. 2-DE was performed according to our previous reported procedure [4,5] using IPG 3-10 NL, 7 cm in 1st dimension and 12% acrylamide gels as 2nd dimension at 4 °C by using up to 1 mg protein per each strip. Immediately after electrophoresis, commassie brilliant blue staining was performed to determine differences in the protein pattern on 2-DE maps. All experiments were performed as triplicate and respected results are reported as mean and standard deviation (SD). SPSS version 20.0 was used for statistical analysis. Comparison of spot numbers and also the percentage of spot’s volume and intensity between three extraction buffers were performed using Kruskal-Wallis test.
Results
The protein content of samples provided by different buffers show no significant difference. The number of protein spots in the 2-DE map by using of buffers B and C is approximately 2 times more than buffer A (p< 0.05). Also, the most of these spots were appearing in the slightly alkaline region (pI 7.5-9.0) from all molecular weight ranges in buffers B and C. By using buffer A, the most spots were in the neutral pI (5.5-7.5) and more appeared in the low range of molecular weight (Table 1).Although the percentage of volume and intensity of the detected spots in the Tris-HCl and rehydration buffers were higher than PBS buffer (Table 1), but, the spots from all three buffers were sharp (clear edges) with good intensity and volume (Figure 1) and there were no significant differences neither in %volume, nor in %intensity between three groups.
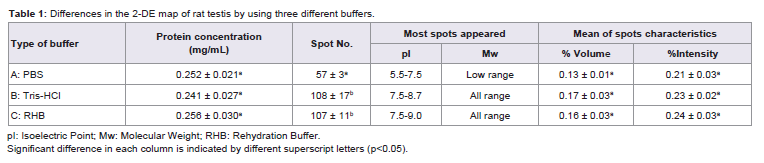 Table 1: Differences in the 2-DE map of rat testis by using three different buffers.
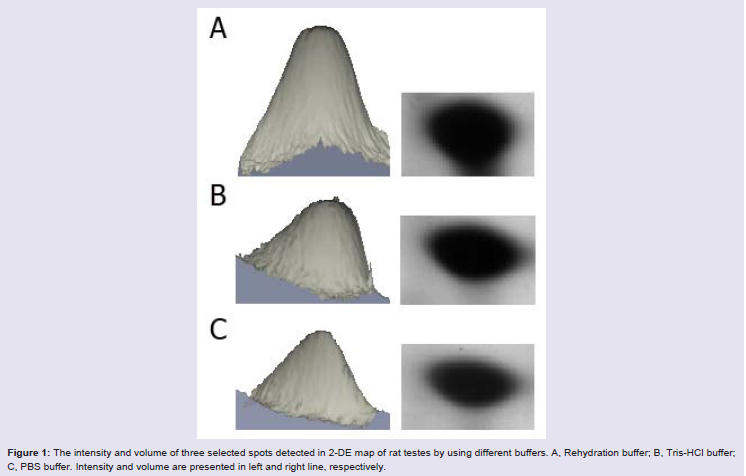
Figure 1: The intensity and volume of three selected spots detected in 2-DE map of rat testes by using different buffers. A, Rehydration buffer; B, Tris-HCl buffer; C, PBS buffer. Intensity and volume are presented in left and right line, respectively.
Discussion
This study compared the effects of different extraction buffer on the pattern of 2-DE of rat testicular proteome and demonstrated that Tris-HCl buffer (0.05 M contain 10% sucrose, pH 6.80) could be used as replacing choice for the expensive rehydration buffer.It seems that although, the type of extraction buffer is important in the picture of the 2-DE map, but RHB (buffer C) is not the only appropriated buffer. Buffer B was used by our group in a recent study to identify the effects of radiofrequency electromagnetic wave radiation on the proteome map of rat testes [6] and obtaining result were better even than rehydration buffer. The buffer B in the exact or similar manner is also used by other researchers in different fields of science [7-10] and their results may be comparable with rehydration buffer. Based on the results of this study and other previous reports and also due to the expensiveness of CHAPS and other detergents in RHB, the use of another buffer under liquid nitrogen and also on ice instead of RHB seems reasonable and recommended.References
- Jiang L, He L, Fountoulakis M (2004) Comparison of protein precipitation methods for sample preparation prior to proteomic analysis. J Chromatogr A 1023: 317-320.
- Franzén B, Hirano T, Okuzawa K, Uryu K, Alaiya AA, et al. (1995) Sample preparation of human tumors prior to two-dimensional electrophoresis of proteins. Electrophoresis 16: 1087-1089.
- Bradford MM (1976) A rapid and sensitive method for the quantitation of microgram quantities of protein utilizing the principle of protein-dye binding. Anal Biochem 72: 248-254.
- Fattahi S, Kazemipour N, Hashemi M, Sepehrimanesh M (2014) Alpha-1 antitrypsin, retinol binding protein and keratin 10 alterations in patients with psoriasis vulgaris, a proteomic approach. Iran J Basic Med Sci 17: 651-655.
- Kazemipour N, Qazizadeh H, Sepehrimanesh M, Salimi S (2014) Biomarkers identified from serum proteomic analysis for the differential diagnosis of systemic lupus erythematosus. Lupus: Epub ahead of print.
- Sepehrimanesh M, Kazemipour N, Saeb M, Nazifi S (2014) Analysis of rat testicular proteome following 30-day exposure to 900 MHz electromagnetic field radiation. Electrophoresis 35: 3331-3338.
- Zhang N, Chen R, Young N, Wishart D, Winter P, et al. (2007) Comparison of SDS-and methanol-assisted protein solubilization and digestion methods for Escherichia coli membrane proteome analysis by 2-D LC-MS/MS. Proteomics 7: 484-493.
- Singleton I, Merrington G, Colvan S, Delahunty JS (2003) The potential of soil protein-based methods to indicate metal contamination. Appl Soil Ecol 23: 25-32.
- Ogunseitan OA (1993) Direct extraction of proteins from environmental samples. J Microbiol Meth 17: 273-281.
- Valadares RB, Perotto S, Santos EC, Lambais MR (2014) Proteome changes in Oncidium sphacelatum (Orchidaceae) at different trophic stages of symbiotic germination. Mycorrhiza 24: 349-360.