
Journal of Chemistry and Applications
Download PDF


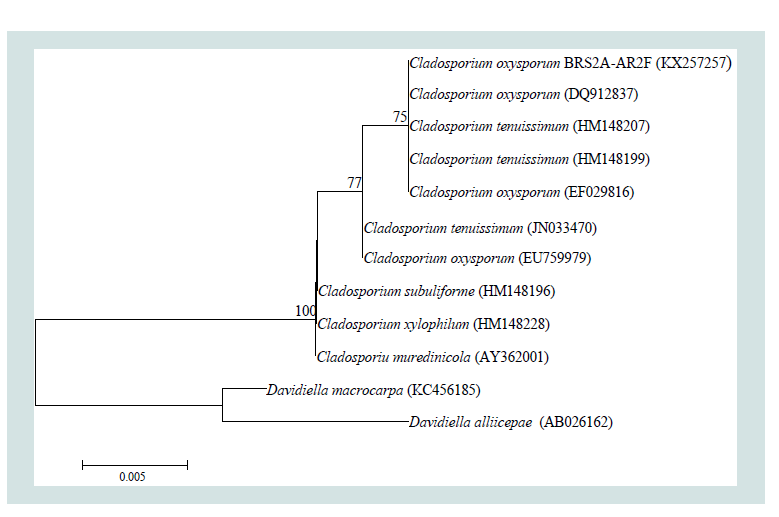 Figure 1: Neighbour-joining phylogenetic tree based on ITS1-5.8S-ITS2 gene sequences showing the relationship between strain BRS2A-AR2F and closely related species. Numbers at nodes indicate levels of bootstrap support (percentages of 1000 resamplings); only values above 50% are shown. GenBank accession numbers are given in parentheses. Bar, 0.005 substitutions per site.
 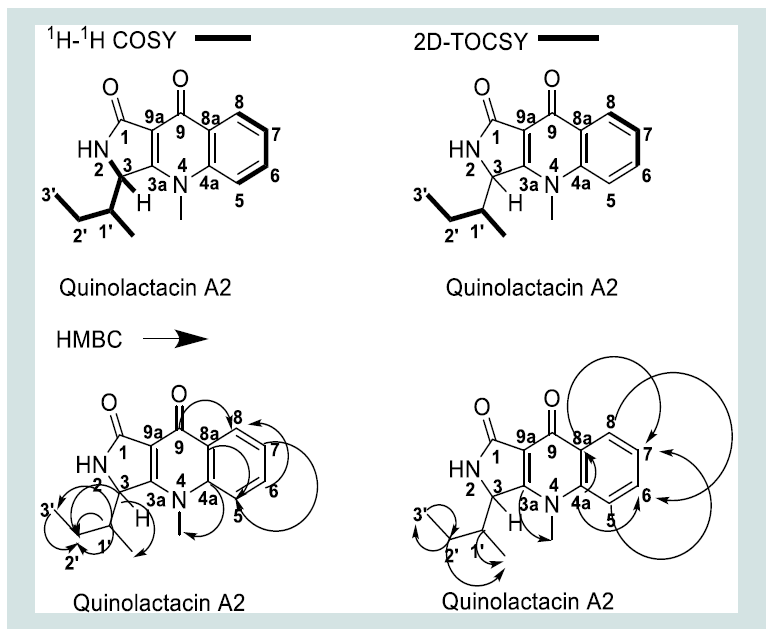 Figure 2: Full 1H-1H-g COSY, 2D TOCSY and HMBC data for quinolactacinA2.
 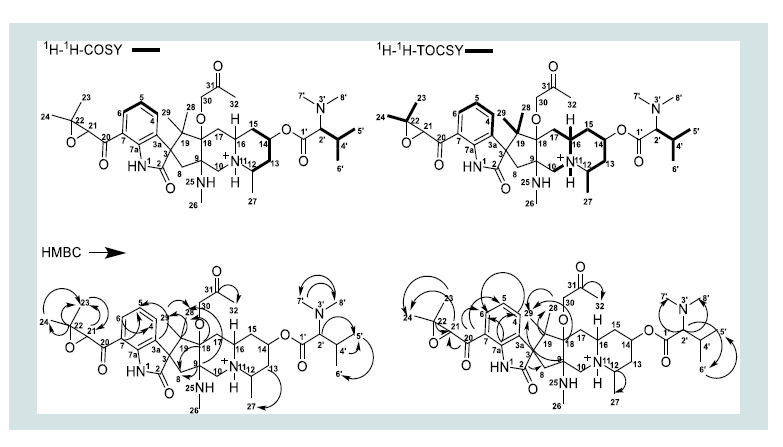 Figure 3: Full 1H-1H-gCOSY, 2D TOCSY and HMBC data for butrecitrinadin.
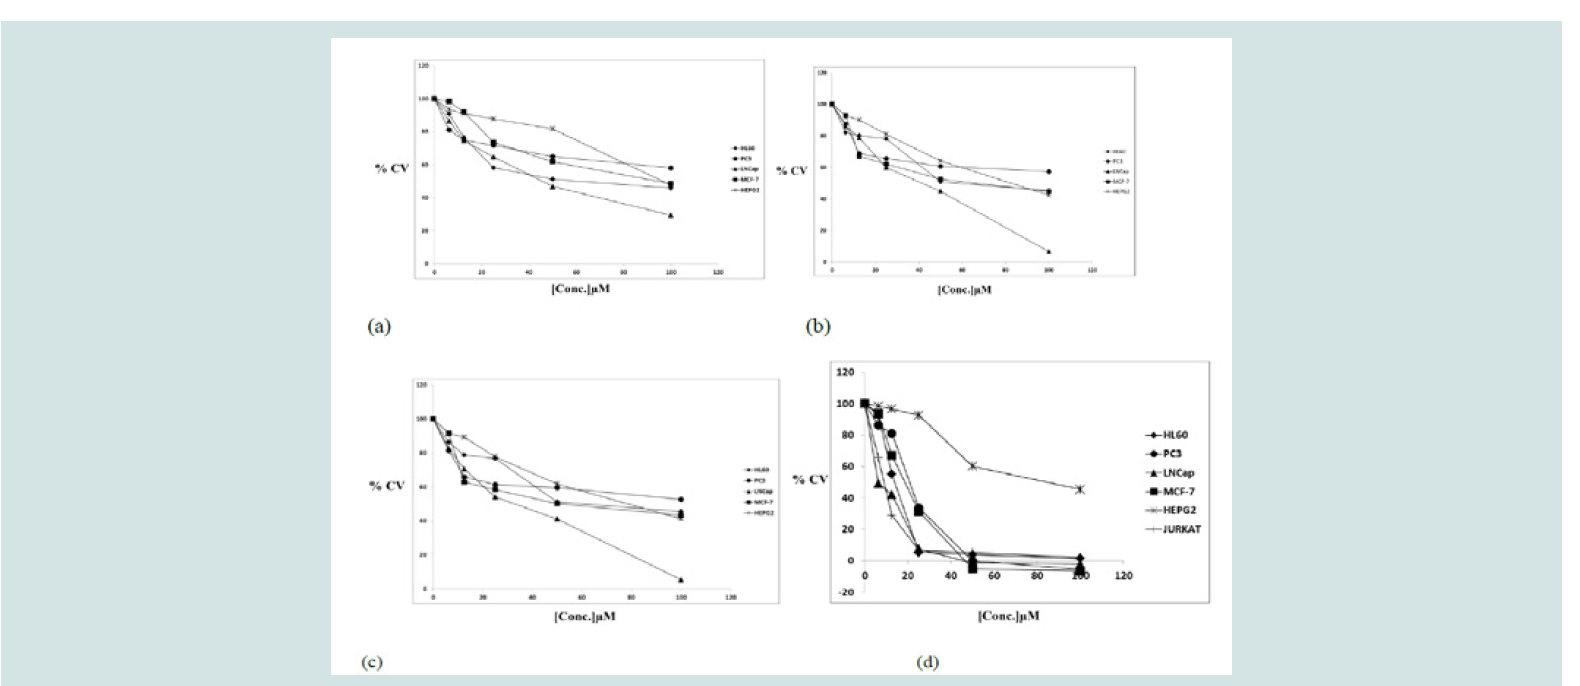 Figure 4: Anti-proliferative activities of compounds: a) quinolactacin A2, b) citrinadin A c) butrecitrinadin and d) curcumin on human cancer cell lines. The MTTAssay was used and the results are expressed as a mean of duplicate experiments done in triplicates
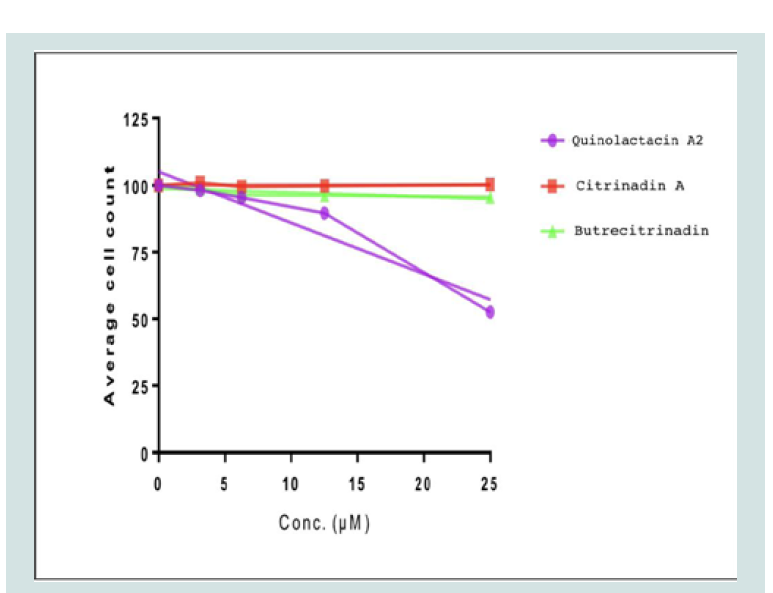 Figure 5: Anti-plasmodial activity of quinolactacin A2, citrinadin A andbutrecitrinadin on 3D7 plasmodial strain. SYBR Green I Assay was used andthe results are expressed as a mean of duplicate experiments.
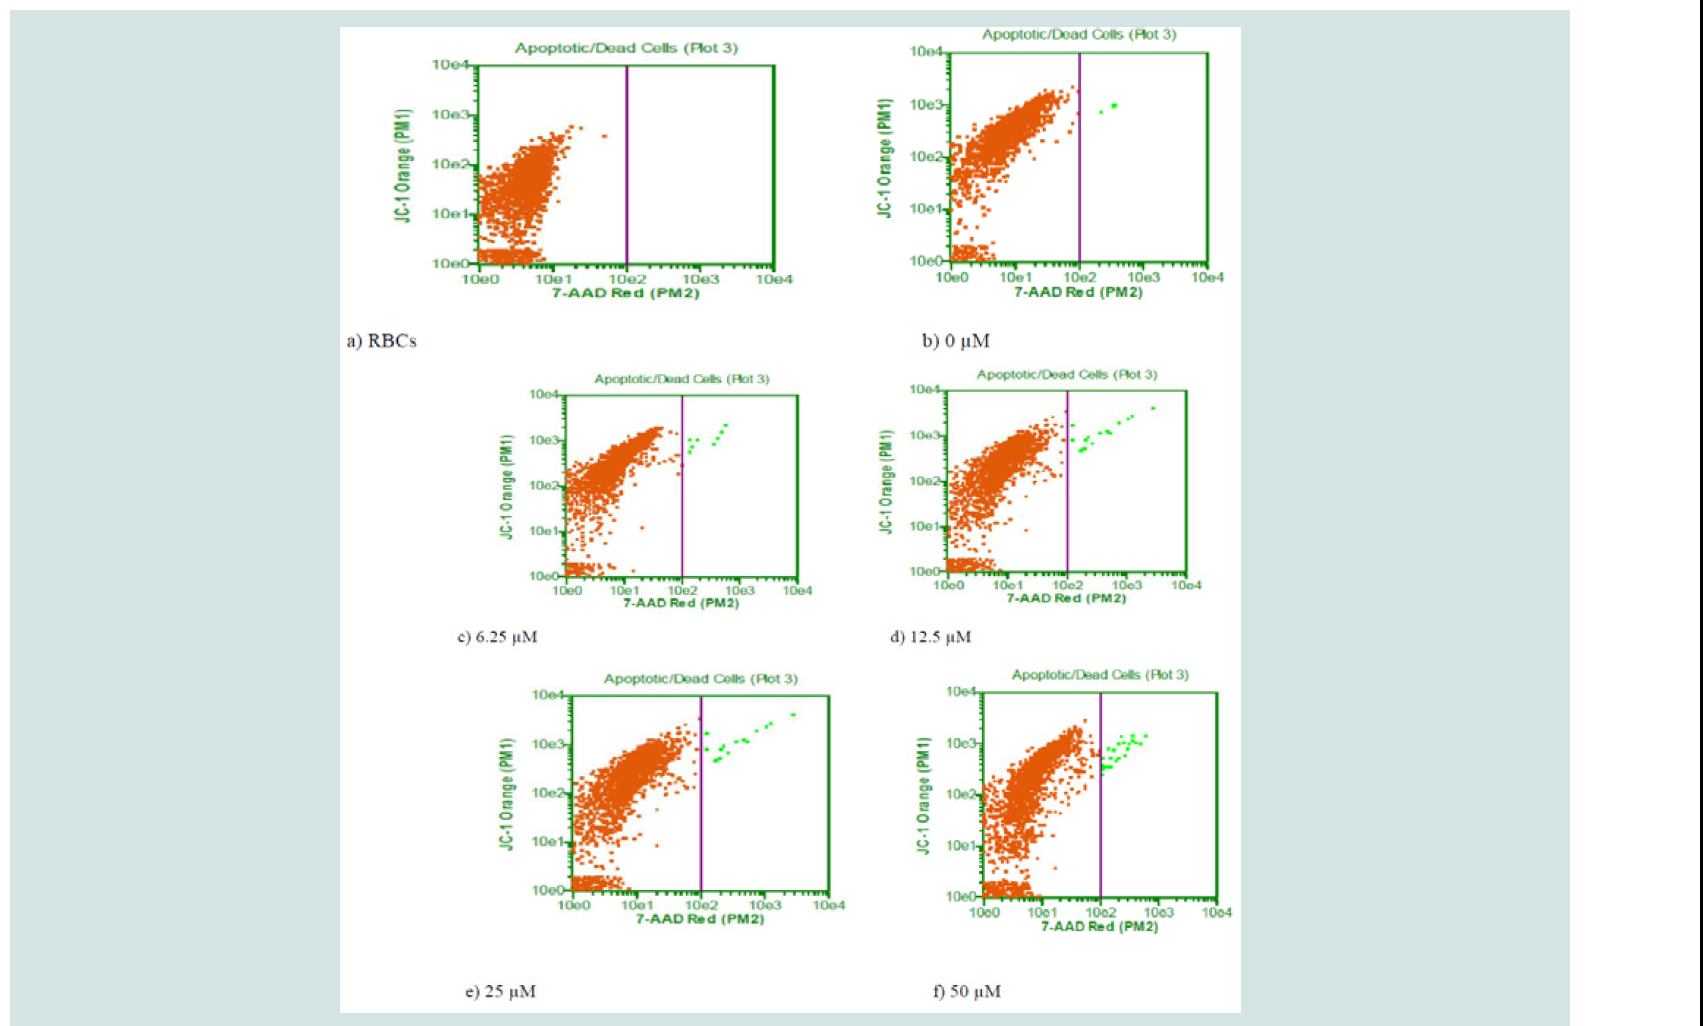 Figure 6: Effect of quinolactacin A2 on the loss of mitochondrion membrane potential. Plasmodium falciparum 3D7 strain were treated with different concentrations of quinolactacin A2: a) RBCs only b) 0 μM c) 6.25 μM d) 12.5 μM e) 25 μM f) 50 μM for 24 hours and analysed by flow cytometry after staining with JC-1.
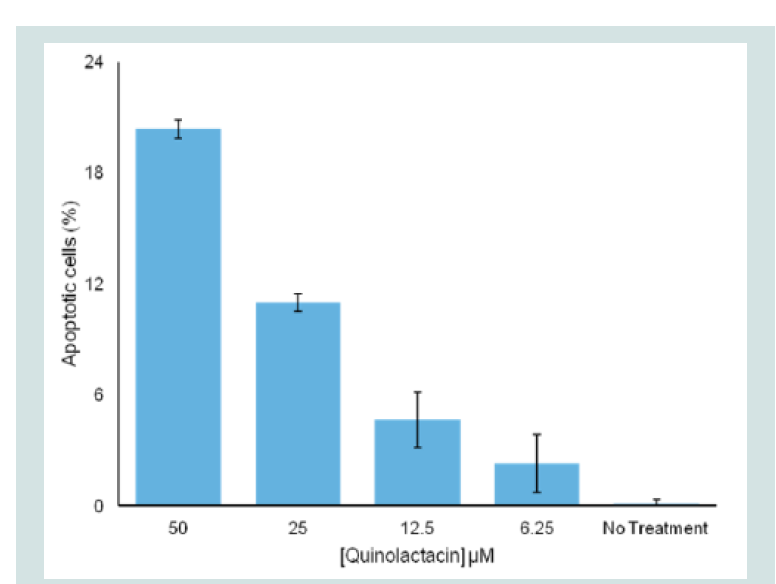 Figure 7: Percent apoptotic effect of quinolactacin A2 on the plasmodial strain after staining with JC-1. The results are expressed as a mean of triplicate readings.
Research Article
Anti-Proliferative and Anti-Plasmodia Activity of Quinolactacin A2, Citrinadin A and Butrecitrinadin co-isolated from a Ghanaian Mangrove Endophytic Fungus Cladosporium oxysporum strain BRS2A-AR2F
Kwaku Kyeremeh 1* , Kofi Baffour-Awuah Owusu 1,2 ,Mark Ofosuhene 2 , Mitsuko Ohashi 2,4 , JeffreyAgyapong 2 , Anil Sazak Camas 2 and MustafaCamas 3
- 1 Marine and Plant Research Laboratory of Ghana, Department of Chemistry, University of Ghana, Ghana
- 2 Department of Clinical Pathology, Noguchi Memorial Institute for Medical Research, University of Ghana, Ghana
- 3 Department of Bioengineering, Tunceli University, Faculty of Engineering, Tunceli, Turkey
- 4 Section of Environmental Parasitology, Tokyo Medical and Dental University, Tokyo, Japan
* Address for Correspondence: Kwaku Kyeremeh, Marine and Plant Research Laboratory of Ghana,Department of Chemistry, University of Ghana, Box LG 56, Ghana, Tel:+233207891320; E-mail: kkyeremeh@ug.edu.gh
Citation: Kyeremeh K, Owusu KB, Ofosuhene M, Ohashi M, Agyapong J. Anti-Proliferative and Anti-Plasmodia Activity of Quinolactacin A2, Citrinadin A and Butrecitrinadin co-isolated from a Ghanaian Mangrove Endophytic Fungus Cladosporium oxysporum strain BRS2A-AR2F. J Chem Applications. 2017;3(1): 12.
Journal of Chemistry and Applications| ISSN: 2380-5021 | Volume: 3, Issue: 1
Submission: 02 January, 2017| Accepted:27 February, 2017 | Published: 06 March, 2017
Submission: 02 January, 2017| Accepted:27 February, 2017 | Published: 06 March, 2017
Abstract
The compounds quinolactacin A2 (2) and citrinadin A (13) which are originally considered to be the compounds of fungi genus Penicillium, were co-isolated for the first time from the new fungal strain Cladosporium oxysporum strain BRS2A-AR2F (Genebank number KX257257) which is an endophyte of the Ghanaian mangrove plant Rhizopho raracemosa. A derivative of citrinadin A, which was named butrecitrinadin (12) was also isolated from fermentation cultures of this new fungal strain. The structures of quinolactacin A2 (2), citrinadin A (13) and butrecitrinadin (12) were determined using a combination of mass spectrometry with 1D and 2D NMR data analysis. The antiproliferative activities of the three compounds 2, 12 and 13 were tested using human cancer cell lines HL-60, Jurkat cells, LNCap, PC3, HepG2, and MCF7. The compounds were found to show some level of anti-proliferative activity against some of the cell lines compared to curcumin as a positive control. The three compounds however, showed no activity against Jurkat and PC-3 cells. Compounds 2, 12 and 13 were also tested against the chloroquine sensitive Plasmodium falciparum 3D7 strain for anti-plasmodial activity. Only 2 showed antiplasmodial activity within the concentration range tested with an EC50 value of 24.80 μM compared to artesunate 0.074. Since this represents the first study of the anti-plasmodial activity of quinolactacin A2 (2), the apoptotic activity of 2 on 3D7 plasmodia strain was evaluated by studying the effect of the compound on the mitochondrion membrane potential of the parasite. The results indicated the dissipation of the mitochondrial membrane potential (ΔΨm) and abolition of probe accumulation in a concentration dependent manner. Hence 2 may provide a drug development scaffold for apoptotic death in the stages of Plasmodium falciparum development. The three compounds 2, 12 and 13 were also tested for anti-buruli ulcer activity on Mycobacterium ulcerans MN209 characterized isolates but, were found to be inactiveKeywords
Mitochondria; Adhesive cells; Suspension cells; Apoptosis; Buruli ulcer
Introduction
The quinolactacins are novel pyrrolo [3,4-b] quinolone-type compounds isolated from fungi and are mostly methylated at the nitrogen of the quinolone moiety [ 1,2 ]. Amongst the quinolactacin compounds isolated to date, it is only quinolactacide (11) that appears to be missing the N-methyl substituent on the quinolone moiety [ 3 ]. Also, only quinocitrinine A (9) and B (10) bear additional substituents in the form of a hydroxyl group on the quinolone which isotherwise free of further substitution [ 4 ]. The γ-lactam ring however, normally bears substituents at the C-3 position. These substituents are 2-butyl in the case of quinolactacin A1/A2 (1/2) [ 5 ] and quinocitrinine A/B (9/10) [ 4 ] but, in the case of quinolactacins C1/ C2 (5/6) [ 6 ], there is a hydroxyl group at the same position in addition to the 2-butyl substituent. Quinolactacins D1/D2 (7/8) [ 6 ], have an isobutyl substituent at C-3 of the lactam ring while quinolactacins B1/B2 (3/4) [ 6 ], have an isopropyl at same position of the γ-lactam ring. In the structure of quinolactacide (11) [ 3 ], the γ-lactam ring is fully substituted to give a tetracyclic quinolone backbone which is numbered differently.
For compounds that contain a quinolone moiety, which can be found in the structures of many very important and potent antibiotics currently in the clinic [ 7- 11 ], no significant antimicrobial data has been reported for the 11 compounds presently characterized in this group. Biological activity studies have focused mainly on cytotoxicity,acetyl cholinesterase and tumour necrosis factor inhibition and insecticidal activity [ 1- 6 ]. So far, the primary source organisms for the quinolactacins has been Penicillium sp. and Penicillium citrinum [ 1- 6 ].
The citrinadins are a small group of pentacyclic alkaloids that have been found to be associated with fungi [ 12 ]. All the citrinadins possess a spirooxindole which is fused to a tricyclic system containing a quinolizidine moiety [ 12 ]. Furthermore, the substituent on the spirooxindole portion for these naturally occurring citrinadins, which is an α,β-epoxy carbonyl unit is the same [ 13 ]. The only structural difference between these compounds lies in the kind of substituents on the quinolizidine containing tricyclic ring system. In citrinadin A (13), there is an N,N-dimethyl valine residue at C-14 [ 12 ] which is absent in the structure of citrinadin B (14) [ 13 ]. For the citrinadin-type compounds PF1270 A (15), B (16) and C (17), there exist butyrate, propionate and acetate substituents respectively at the C-14 position [ 14 ].
Generally, owing to their inherent three-dimensional structure and novelty, spiro scaffolds have gained increased attention in drug discovery. In particular; chiral spirooxindoles represent a class of lead compounds for a variety of biologically diverse diseases. These include inflammation, cancer and parasitic diseases [ 15- 17 ]. Both citrinadin A (13) and citrinadin B (14) have also demonstrated cytotoxicity against murine leukemia L1210 cells with IC50 values of 6.2 and 10.0 μg/ml respectively [ 13 ]. Furthermore, citrinadin A (13) has demonstrated activity against human epidermoid carcinoma KB cells with IC50 value of 10.0 μg/ml [ 13 ]. PF1270 A (15), B (16) and C (17) have also shown high affinity for both rat and human histamine H3 receptor ligands by functioning as potent agonists with EC50 values of 0.12, 0.15 and 0.20 μM respectively [ 14 ]. As a result of the fact that, H3 receptor ligands play a role in the release of neurotransmitters such as serotonin, noradrenalin and dopamine, it is envisaged that, they may hold the potential for the treatment of diabetes, obesity and central nervous system disorders [ 14 ].
So far, all the known naturally occurring citrinadin compounds have been isolated from Penicillium citrinum and Penicillium waksmanii [ 12- 14 ].
Herein we report for the first time, the co-isolation of quinolactacin A2, citrinadin A and butrecitrinadin from a Ghanaian mangrove plant-derived endophytic fungus Cladosporium oxysporum strain BRS2A-AR2F (KX257257). To the best of our knowledge, this represents the first report of citrinadin compounds from a genus other than Penicillium and butrecitrinadin is a new compound. Using the 3-(4,5-dimethylthiazol-2-yl)-2,5-diphenyltetrazolium bromide (MTT) assay, the antiproliferative activity of the three compounds were tested against six human cell lines namely; Jurkat (Human T-lymphoblastic leukemia cells-suspension cells), HepG2 (Human hepatocellular carcinoma-adhesive cells), HL-60 (Human promyelocytic leukemia cells-suspension cells), LNCap (Human prostate cancer-adhesive cells), MCF-7(Human breast canceradhesive cells) and PC-3 (Human prostate cancer-adhesive cells). We also evaluated the anti-plasmodia activity of the three compounds on 3D7 plasmodia strain using the SYBR Green I assay and went further to evaluate the plasmodia apoptotic activity of quinolactacin A2. The compounds however, did not show any anti-buruli ulcer activity when tested against Mycobacterium ulcerans MN209.
Materials and Methods
Mangrove plant sample collection
The Western Region of Ghana is noted for its bio-diverselyrich indigenous mangrove plants. Out of the six indigenous plantsthat are characteristic of the mangroves found in Ghana, three ofthem are particularly common in the Western Region and theseare Conocarpus erectus, Laguncularia racemosa and Rhizophoraracemosa (coordinates: 4°49′43.73′N and 1°54′50.84′W). Collection ofmangrove plants was done along the banks of the River Butre ( Figure S1 with five sampling sites chosen at 100 m apart from the shore towhere the river meets the sea. The three main plant samples collectedwere Conocarpus erectus, Laguncularia racemosa and Rhizophoraracemosa but, different plant parts were sampled at different sectionsof the river. The plant parts sampled were leaves, buds, submergedroots, aerial roots, aerial stems, fruit shoots and flowers. The exactpositions of plants from which different parts were sampled werestored in a GPS and the data uploaded into Google Earth satellite database. The samples were videoed, photographed, bagged, labelledand stored at 4 °C in an ice-chest and transported to the Departmentof Chemistry, University of Ghana, Legon. Identification of the plantswas done at the Department and specimens of all plant parts collectedwere dried in newspapers for onward submission to the herbarium.
Preparation of culture median
Malt extract solid media: Approximately 15 g of malt extractand 15 g of bacteriological agar were weighed into a 1 L autoclavebottle containing 900 ml of water and stirred to mix with a magneticstirrer. The mixture was autoclaved after which it was cooled to about55 °C and then poured into petri dishes (90 mm) to fill about 2/3 ofthe volume of each Petri dish under sterile conditions (25 plates foreach 900 ml preparation). The plates were left half-open under a cleanbench until almost all the water had evaporated from the plates. Dryplates were parafilmed and kept in a fridge at 4 °C until needed.
Malt extract liquid media: Approximately 15 g of malt extractwas weighed into a 1 L autoclave bottle containing 900 ml ofwater and stirred to mix with a magnetic stirrer. The mixture wasautoclaved and allowed to cool and then stored in a fridge at 4 °Cuntil needed.
Treatment of Rhizophora racemosa and culture of BRS2A-AR2F
In the laboratory, pieces of the aerial roots of Rhizophora racemosa was surface sterilized under sterile conditions by first rinsing them with sterile artificial sea water (SASW) and then immersing them in 70% ethanol for 1 minute. The plant parts were then cut transversely at all sides into a smaller piece with a pair of flame sterilized scissors in a bio-safety cabinet. The pieces were again sterilized under sterile conditions by first rinsing them with SASW and then immersing them in 70% ethanol for 1 minute. The pieces were again cut at all sides into much smaller pieces with a flame sterilized scalpel. These pieces were again sterilized by rinsing with SASW, then immersing in 2% sodium hypochlorite for 1 minute and then rinsed again with SASW 3 times. The treated aerial roots were afterwards placed on malt extract agar plates (parent or master plates) and the plates were labelled, parafilmed and incubated at 28 °C for three weeks with daily observations to detect the appearance of new fungal colonies.
Isolation of pure endophytic fungi
Observation of the parent or master plates obtained for the aerial roots of Rhizophora racemosa starting from day one (1) to day twentyone (21) saw the appearance on the parent plates of several different colonies of marine endophytic fungi which were subsequently picked one at a time, re-cultured on fresh malt extract plates and kept at an incubation temperature of 28 °C. All the colonies initially subcultured from the parent or master plates were subsequently subcultured until very pure strains were obtained for each species, one of which was the endophytic fungi BRS2A-AR2F ( Figure S2 ).
Taxonomic identification of strain BRS2A-AR2F (Genbank Number KX257257)
Genomic DNA of strain BRS2A-AR2F was extracted using ZR Fungal/Bacterial DNA MiniPrep kit (Zymo Research, Irvine, CA, USA) according to the manufacturer’s instructions. The ITS1- 5.8SrDNA-ITS2 region of the rDNA was amplified using the forward (ITS1: 5′-TCC GTA GGT GAA CCT GCG G-3′) and reverse (ITS4: 5′-TCC TCC GCT TAT TGA TAT GC-3′) universal primers [ 18 ] with GoTaq Hot Start master mix (Promega Corp., Madison, WI, USA). Amplification was performed on a T100 Thermal Cycler (Bio-Rad, USA) as follows: 1 cycle of 2 minute at 95 °C (primary denaturation), 30 cycles of 1 minute at 95 °C (denaturation), 1 minute at 55 °C (annealing), 1 minute at 72 °C (extension) and finally 1 cycle of 5 minute at 72 °C. PCR-amplified products were sequenced using a DNA sequencer ABI PRISM 3730 XL automatic sequencer (Applied Biosystems, Foster City, CA, USA). The generated sequence of strain BRS2A-AR2F (507 bp) was compared with other fungal DNA sequences from NCBI’s Gene Bank sequence database using a BLAST (Basic Local Alignment Search Tool) http://blast.ncbi.nlm.nih.gov/) search. Multiple alignments with sequences from closely related species were performed by using the program CLUSTALW in the MEGA6 software package 19 ]. Phylogenetic tree was constructed with neighbour joining (NJ) 20 ]. Evolutionary distances were calculated using model of Jukes and Cantor (1969) 21 ]. Topologies of the resultant trees were evaluated by bootstrap analysis based on 1000 re-samplings 22 ].
Small scale culture of < Cladosporium oxysporum /strong>strain BRS2A-AR2F
The malt extract liquid broth prepared earlier was thawed in a water bath and 100 ml was transferred into an already autoclaved 250 ml Erlenmeyer flasks with non-absorbent cotton wool stuck in the mouth under sterile conditions. A single colony from a Cladosporium oxysporum strain BRS2A-AR2F plate was picked and inoculated into the broth under sterile conditions. The inoculated flask was labelled and incubated in an incubator at 28 °C for two weeks. After two weeks, the culture broth was filtered by suction filtration to separate fungal mycelia from the broth itself. The broth was extracted once with ethyl acetate and the mycelia repeatedly and alternatively extracted with methanol and dichloromethane. The ethyl acetate, methanol and dichloromethane extracts were dried under vacuum and subsequently combined to give a total crude extract (TCE).
Chemical profiling of Cladosporium oxysporum strain BRS2AAR2F
About 1 mg of the TCE obtained for the small scale culture in malt extract liquid media of Cladosporium oxysporum strain BRS2A-AR2F was subjected to high resolution mass spectrometric analysis using a Thermo Instruments MS system (LTQ XL/LTQ Orbitrap Discovery) coupled to a Thermo Instruments HPLC system (Accela PDA detector, Accela PDA autosampler, and Accela pump). The following conditions were used: capillary voltage 45 V, capillary temperature 320 °C, auxiliary gas flow rate 10-20 arbitrary units, sheath gas flow rate 40-50 arbitrary units, spray voltage 4.5 kV, mass range 100-2000 amu (maximum resolution 30,000). HPLC separations were carried out using a Phenomenex reversed-phase (C18, 250 6 10 mm, L x i.d.) column connected to an Agilent 1200 series binary pump and monitored using an Agilent photodiode array detector. Detection was carried out at 227 nm. This data provided the photodiode array profile, mass ion counts, specific UV and fragmentation pattern of all the metabolites present in the crude fermentation extracts of strain BRS2A-AR2F ( Figure S3 and ( Figure S4 ). Input of this information into the MarinLit, AntiMarin and Antibase databases provided detailed information on the compounds contained in the extract.
Large scale culture of Cladosporium oxysporum strain BRS2AAR2F
After high resolution electrospray ionization-HPLC with diode array coupled mass spectrometry analysis, it was detected that marine-derived fungus, Cladosporium oxysporum strain BRS2AAR2F produced interesting compounds. Therefore large scale fermentation in about 1 L broth was carried out to isolate these compounds. This was done by inoculating two already autoclaved 1 L Erlenmeyer flasks, sealed with non-adsorbent cotton wool, containing 500 ml of malt extract liquid broth with strain BRS2A-AR2F under sterile conditions. These flasks were labelled and incubated at 28 °C for a period of 2 months. At the end of the incubation period, the cultures filtered under suction and the mycelia separated from the broth. The broths were extracted once with ethylacetate and the mycelia combined and repeatedly and alternatively extracted with methanol and dichloromethane. The extracts obtained after drying under vacuum from the ethylacetate, methanol and dichloromethane fractions were combined to give a TCE (1.300 g).
Solvent partitioning by a modification of Kupchan’s method
Following solvent extraction of the liquid broth and mycelia of BRS2A-AR2F was solvent partitioning. The procedures adopted were a modification of Kupchan’s method (1973) [ 23 ],employing a combination of solvent systems with polarities ranging from the relatively non-polar hexane to the extremely polar water solvent. First, the TCE was suspended in water and extracted with an equal volume of dichloromethane three times. The result was two fractions, an aqueous fraction and a dichloromethane fraction. The aqueous fraction was extracted with an equal volume of sec-butanol once. Two separate fractions were obtained, the aqueous fraction from this end was discarded and the sec-butanol layer was rotary evaporated to dryness and labelled BRS2A-AR2F-WB (390.040 mg). The dichloromethane fraction (908.075 mg) obtained initially from the first partitioning process was rotary evaporated to dryness under reduced pressure. This fraction was then suspended in 90% methanol:water and extracted with an equal volume of hexane (1:1) three times. The resulting hexane layer was rotary evaporated to dryness and labelled BRS2A-AR2F-FH (248.780 mg). The 90% methanol:water layer was then phase adjusted to 50% methanol:water and extracted with an equal volume of dichloromethane (1:1) three times. Both resultant fractions were rotary evaporated to dryness under reduced pressure and labelled BRS2A-AR2F-FD dichloromethane fraction (396.955 mg) and BRS2A-AR2F-FM 50% methanol:water fraction (256.488 mg) accordingly. Fractions that separated out in the solvent partitioning process possessed defined polarities.
Purification of BRS2A-AR2-FM and isolation of compounds
High resolution electrospray ionization-HPLC with diode array coupled mass spectrometry analysis of the Kupchan solvent partitioning extracts showed that, most of the compounds of interest were in BRS2A-AR2F-FM. Hence, this fraction was subjected to a size exclusion column chromatography using Sephadex LH-20 as stationary phase and methanol as mobile phase. Five Sephadex LH- 20 fractions were collected and these fractions were concentrated under vacuum, transferred into vials and labelled BRS2A-AR2FFM- SF1-5. Analysis of the Sephadex extracts showed that, SF2, SF3, SF4 and SF5 fractions all contained interesting compounds but the quinolactacins and citrinadins were found to be concentrated in the SF2 fraction (58.00 mg). Fraction BRS2A-AR2-FM-SF2 was subjected to alternating HPLC separation and purification using a Phenomenex Luna C18 column (C18 250 × 10 mm, L × i.d.) and column chromatography by gravity using silica as stationary phase and hexane-ethyl acetate mixtures as eluents. Gradients of H2O:CH3CN (1:1 in 30 minutes and hold for 20 minutes) were used as eluents for HPLC with column flow rates set at 1.5 mL/min to afford 3.900 mg of quinolactacin A2, 1.205 mg of butrecitrinadin and 3.030 mg of citrinadin A from 58.00 mg of sample BRS2A-AR2-FM-SF2.
1D and 2D NMR analysis of quinolactacin A2, citrinadin A and butrecitrinadin
NMR data were acquired on a Varian VNMR 600 MHz andBruker 500 MHz spectrometers with either CDCl3 or CD3OD assolvents. Data acquired include 1H, 13C, DEPT-135°, 1H-1H-COSY,HSQC, HMBC and gHSQC-TOCSY.
Chemicals and reagents
RPMI-1640, Dulbecco Modified Eagle’s culture Media (DMEM), Foetal Bovine Serum (FBS), Trypsin, Gentamycin, Penicillin-Streptomycin-L-Glutamine (PSG), 4-(2-hydroxyethyl)- 1-piperazineethanesulfonic acid (HEPES), Curcumin, Artesunate, 3-(4,5-dimethylthiazol-2-yl)-2,5-diphenyltetrazolium bromide (MTT) dye, Dimethyl sulphoxide (DMSO), Sodium citrate, Adenine, Sodium bicarbonate (NaHCO3), AlbuMax II, Sodium chloride (NaCl), Potassium chloride (KCl), Sodium Phosphate Dibasic (Na2HPO4), Sodium Phosphate Monobasic (KH2PO4), Sodium bicarbonate (NaHCO3), Sodium hydroxide (NaOH), Hydrochloric acid (HCl), 5,5’,6,6’-tetrachloro-1, 1‘,3,3’-tetramethyl-benzimidalylcarbocyanine iodide and 7-Aminoactinomycin D, Phosphate-buffered saline (PBS) were purchased from Sigma-Aldrich, USA. Malt extract, and other chemicals and reagents used were of analytical grade or of the highest purity commercially available.
Cell lines tested in the cytotoxicity assay
The under listed human cancerous cell lines used in thecytotoxicity assays conducted during the course of this projectwere kind gifts from Dr. Takuhiro Uto of Nagasaki InternationalUniversity, Japan.Jurkat Human T-lymphoblastic leukemiacells (Suspension cells)HepG2 Human hepatocellular carcinoma(Adhesive cells)HL-60 Human promyelocytic leukemia cells(Suspension cells)LNCap Human prostate cancer (Adhesivecells)MCF-7 Human breast cancer (Adhesive cells)

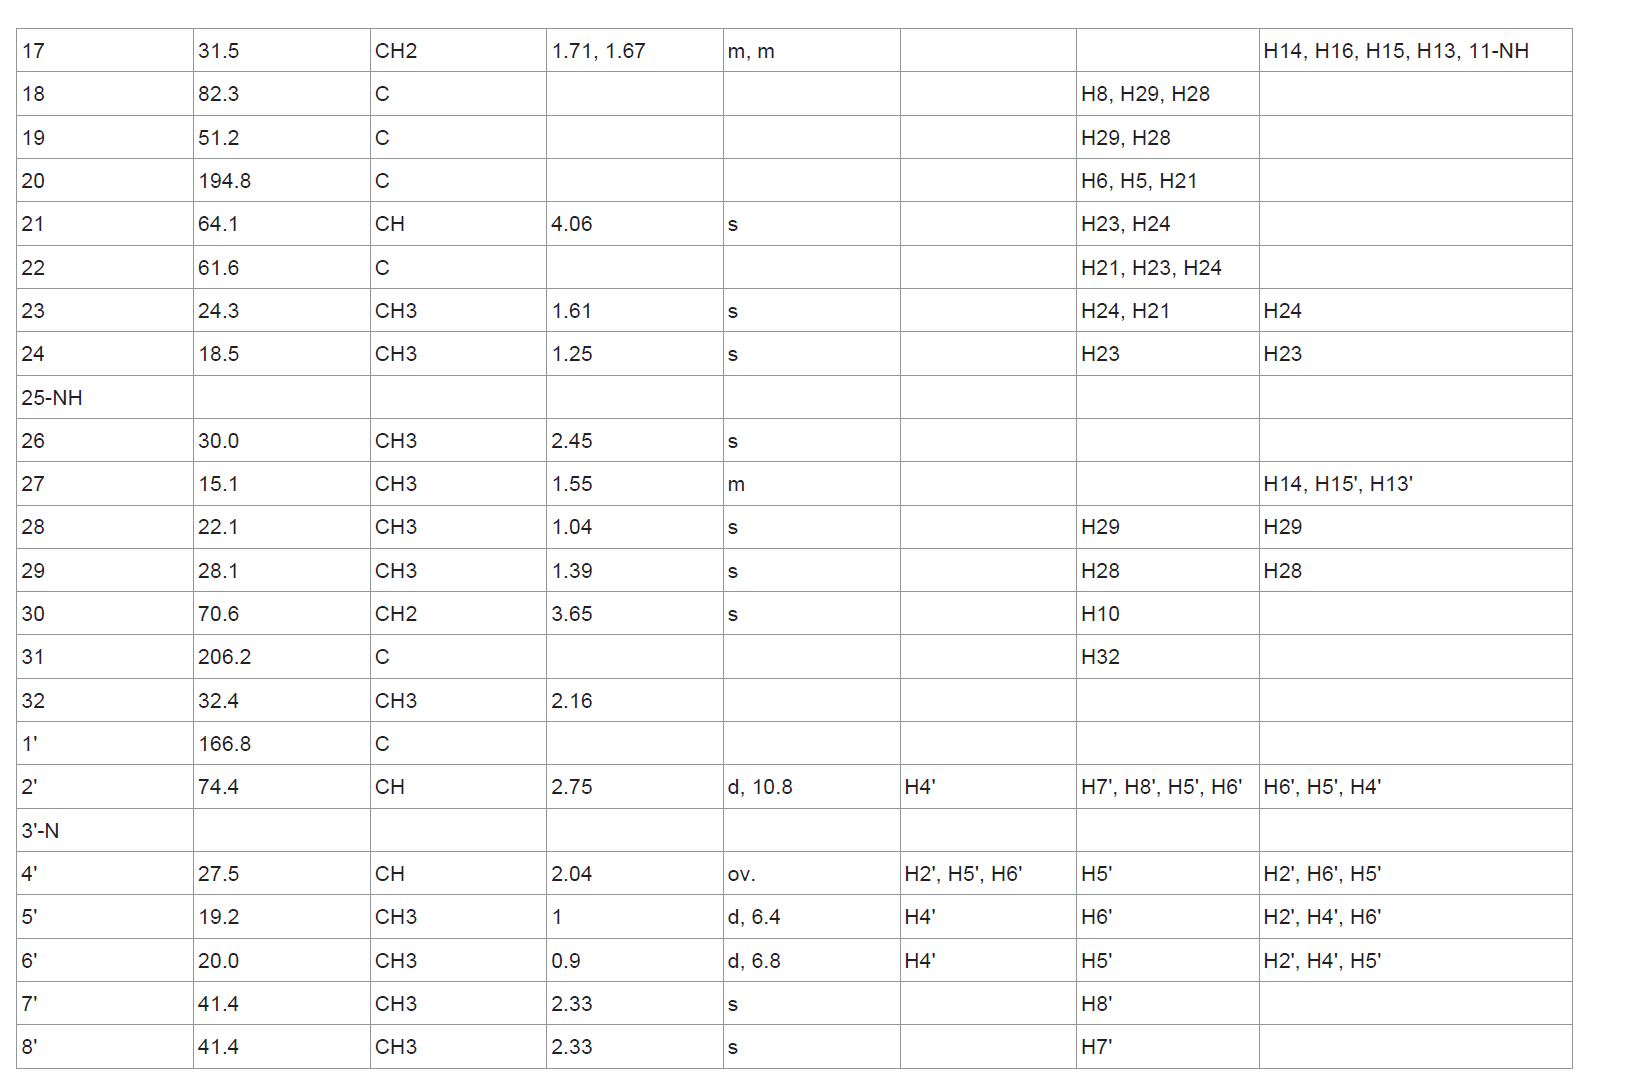 Table 1: 1H and 13C NMR data of butrecitrinadin in CDCl3.
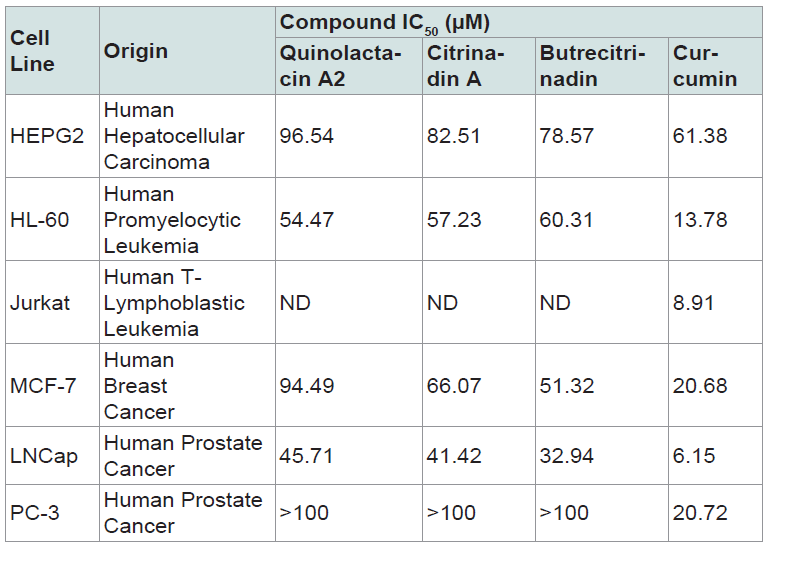 Table 2: Cell growth-inhibitory potencies of pure compounds expressed as IC50 values. Data presented are mean of two experiments done in triplicates. ND: Not Determined IC50 (μM) = Concentration that inhibits cell growth by 50%.
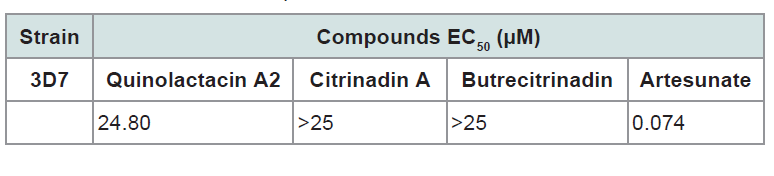 Table 3: The half maximal effective concentration of quinolactacin A2, citrinadinA and butrecitrinadin for 3D7 plasmodial strain.
 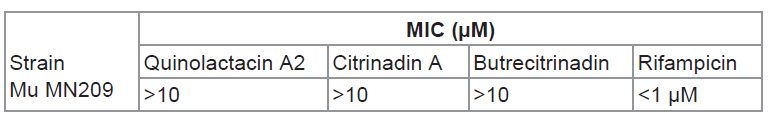 Table 4: Minimum inhibition concentration of quinolac acin A2, citrinadin A and butrecitrinadin on Mycobacterium ulcerans MN209.
Preparation of compounds for bioactivity testing
Stock solutions of the compounds were prepared at aconcentration of 10 mM. This was achieved by drying the compoundswith nitrogen gas, weighing to ascertain the mass of the compoundand dissolving in appropriate amount of DMSO in order to attaindesired concentration. The solutions were vortexed and filtersterilized into vials through 0.45 μm millipore filters under sterileconditions and stored at -20 °C until use.
Cytotoxicity studies
Cell culture and cell treatments: Jurkat, HL-60, LNCap and PC-3cells were cultured in RPMI-1640 medium, while the MCF- 7 and HepG2 cells were maintained in DMEM. All cell cultures were supplemented with 10% FBS, 1% Penicillin-Streptomycin- L-Glutamine and incubated at 37 °C in 5% CO2 under humidified atmospheric conditions. All the compounds in addition to curcumin (used as positive control) were dissolved in DMSO and stored at -20 °C until used. The DMSO concentration in the test wells did not exceed 0.1% (v/v), and the control cells were treated with the sameamount of DMSO.
Cell viability assay
The growth inhibition of the cell lines due to the test compoundsor standard was examined using the tetrazolium-based colorimetricassay (MTT Assay) to determine the viability of the cells at anyparticular time.
Principle: The assay was based on the capacity of the cellularmitochondrial reductase enzyme in living cells to reduce theyellow water-soluble substrate 3-(4,5-dimethylthiazol-2yl)-2,5-diphenyltetrazolium bromide (MTT) into purple formazan crystalswhich was soluble in acidified isopropanol. Since reduction of MTTcan only occur in metabolically active cells, the level of activity is ameasure of the viability of the cells. The colour development fromyellow to purple was monitored at 570 nm using a spectrophotometer.
Procedure : The procedures described by Ayisi et al. were followedwith modifications [ 24 ]. Dilution of the 10 mM stock solution ofeach compound was made in 1% DMSO to obtain five differentconcentrations ranging from 0 to 100 μM. Cultured suspension cells(HL-60 and Jurkat cells) were transferred into centrifuge tubes. Themono-layer adhesive cells (LNCap, PC3, HepG2, and MCF7) in the culture flasks were washed with PBS, detached with trypsin solutionand transferred into centrifuge tubes. Tubes were centrifuged at1000 rpm for 5 minutes and the pellets were re-suspended in growthmedia. Cells were counted using a haemocytometer (MARIENFELD,Germany) and a cell suspension of 1 x 10⁵ cells/ml was preparedby diluting with growth media. 100 μL (1 × 10⁵ cells/mL) of cellsuspensions were seeded into 96-well plates and incubated overnightbefore treatment. 10 μL of the compounds at different concentrationswere each added to the wells with the cell suspensions and incubatedunder the condition stated above for 72 hours. Curcumin was usedas a positive control in all assays and a colour control plate was alsosetup for each compound. 20 μL of 2.5 mg/mL MTT solution wasadded to the wells and incubated further for 4 hours in the CO2incubator. 150 μL of acidified isopropanol containing Triton-X wasthen added to stop the reaction. The reaction plates were incubated inthe dark at room temperature overnight and absorbance read at 570nm using a micro-plate spectrophotometer (Tecan Infinite M200 Proplate reader, Austria).
Percent Cell viability was determined as:
Aα = Mean absorbance of treated cells
Aβ = Mean absorbance of blank
Aγ = Mean absorbance of untreated cells
The average percentage cell viability determined at each concentration was plotted as a dose response curve using Graph Pad Prism Version 5.02. The inhibition concentration at fifty percent (IC50) values, that is, concentration of compounds or standard drug inducing 50% inhibition of cells was determined from the dose response curve by nonlinear regression analysis.
Anti-malaria activity study
Blood collection and erythrocytes preparation: Erythrocytes were obtained from blood of consented volunteers (Blood group O+). Venous blood was drawn and collected into containers with citrate phosphate dextrose (CPD) solution and kept at 4 °C overnight. This was centrifuged at 2,000 rpm for 10 minutes to separate the serum and buffy coat. Packed erythrocytes were washed three times with parasite washing medium (RPMI 1640, buffered with, 50 μg/mL gentamicin and 2 mM L-glutamine). Each washing step involved addition of wash medium, pipetting up and down thrice, centrifuging at 2,000 rpm for 10 minutes and then discarding suspended medium. After washing, medium was added to the packed erythrocytes and stored at 4 °C until use. Washed red blood cells were stored and used for up to 2 weeks maximum after which new blood had to be collected.
Giemsa-stained thin blood smear and parasitaemia determination
A drop of infected erythrocyte cultured medium was placed on a microscope slide and spread with the aid of another slide. Slides were air dried, dipped into methanol for some seconds to fix and air dry again. A 10% Giemsa stain was added to cover completely the surface of the fixed slides for at least 10 minutes and then gently rinsed off with running water. Stained slides were air dried and then viewed under a light microscope (OLYMPUS CK30) (with immersion oil at 100x objective) to determine parasitaemia. Percent parasitaemia was determined by counting the number of infected cells in a total of 500erythrocytes in the Giemsa-stained thin blood smear. Parasitaemiawas expressed as a percentage of the number of infected erythrocytesto the total number of erythrocytes counted.
In vitro cultivation of malaria parasites
Erythrocytic stages of the malaria parasite ( Plasmodiumfalciparum -chloroquine sensitive strain 3D7) were cultured in25 ml flasks using the method of Trager and Jensen (1976) withmodifications [ 25 ]. Erythrocytes were maintained at 2% haematocrit(v/v) cell suspension in complete malaria parasite medium (RPMI1640, buffered with 25 mM HEPES, supplemented with 7.5%NaHCO3, 25 ug/ml gentamycin, 5% heat-inactivated human O+ serum(from consented subject) and 5 mg/ml AlbuMax II) and incubated at37 °C under gas condition of 2% O2, 5% CO2 and 93% N2. Parasitegrowth and development were monitored with Giemsa stained thinblood smear. Parasite culture was purified by using 5% sorbitol toobtain matured erythrocyte parasitic stages (late trophozoites andschizonts) from uninfected cells. The matured erythrocyte parasiticstages (purity > 90%) obtained were used to screen the compoundsfor anti-malaria activity.
Screening for anti-malaria activity using the SYBR Green I assay
Quinolactacin A2, citrinadin A and butrecitrinadin were screenedfor anti-malaria activity by using the SYBR Green I fluorescenceassay as described by Smilktein et al. with some modifications [ 26 ].Serial dilution of the standard (artesunate) which served as anexperimental control and stock solution of compounds to yield finalconcentrations ranging from 100 ng/ml to 400 ng/ml and 3.13 μg/ml to 25 μg/ml respectively were prepared. The matured erythrocyteparasitic stages were treated with compounds and washed in 96 wellplates (Nunc) and incubated with complete malaria parasite mediumfor 24 hrs. Slides were then prepared and percent parasitaemia wasdetermined by counting the number of infected cells in a total of500 erythrocytes in the Giemsa-stained thin blood smear. Briefly,an aliquot of 5 μL per each concentration of the standard drug andcompounds was dispensed into test wells. 95 μL of complete malariaparasite medium with washed erythrocytes at 2% haematocrit andthe purified matured erythrocyte parasitic stages (1% parasitaemia)were added, and incubated at 37 °C under gaseous conditions asstated above and untreated erythrocytes were used as control. Wellscontaining erythrocytes at 2% haematocrit, infected erythrocytesat 2% haematocrit and complete parasite medium alone served asnegative controls, positive controls and blank controls respectively.Furthermore, wells containing infected parasites and 0.1% DMSOserved as reference controls. Final volume per well was 100 μL. Plateswere then incubated for 24 hrs as described above for the cultivationof malaria parasites. 100 μL aliquot of 2.5x buffered SYBR Green I(0.25 μL of SYBR Green I/mL of phosphate buffer saline) was addedto each well after the incubation period and incubated in the dark for30 minutes at 37 °C. Fluorescence was detected by Guava EasyCyteHT FACS machine (Millipore, USA).
Principle: The contrast between host erythrocytes which lackDNA and RNA and the malaria parasites which have DNA and RNA form the basis of the SYBR Green experiment. The plasmodiumparasites can easily be stained with the SYBR Green dye and quantifiedby fluorescence spectroscopy.
Apoptosis study
Mitochondrial potential: Determination of apoptosis-inducingcapabilities of compounds as indication of high anti-malaria activitieswas done by the use of the Guava MitoPotential(R) kit (GuavaTechnologies, USA) as described by the manufacturer’s instructions.A cationic dye, 5,5’,6,6’-tetrachloro-1,1‘,3,3’-tetrathyl benzimidalylcarbocyanine iodide (JC-1), was used to evaluate mitochondrialmembrane potential changes and 7-Aminoactinomycin D (7-AAD),a cell-impermeant DNA intercalator, was also used to monitor cellmembrane permeability changes. Synchronized culture parasites andpreparation of 96-well micro-titer plates were taken through the sameprocedure described above for the screening of the compounds. 2xstaining solution (4 μL of 50x staining solution/100 μL of completeparasite medium) of the Guava MitoPotential(R) kit was then addedto each well in a ratio of 1:1 (v/v) and incubated for 30 minutes at 37°C in the dark. Stained cells were analyzed on a Guava EasyCyte HTsystem.
Anti-buruli ulcer activity assay
Resazurin Microtiter Assays (REMA)
Preparation of inoculum: The Resazurin based assay as describedby Yemoa et al. was followed [ 27 ]. The assay used in detectinggrowth inhibition of microorganisms including mycobacteria wasused to access the ability of the compounds to exhibit inhibition against Mycobacterium ulcerans . The inoculum was prepared bymaking a direct broth suspension of a full loop of isolated coloniesselected from a 6 weeks Middlebrook 7H9 solid medium. Fresh Mycobacterium ulcerans MN209 characterized isolate culture wasadjusted to achieve a turbidity of 1.0 McFarland turbidity standardwhich is equivalent to 3 x 10⁸ colony forming units (CFU)/ml. Theadjusted inoculum suspension was further diluted 1:1000 in 7H9broth up to approximately 1 x 10⁵ CFU/ml.
Inoculation: Within 15 minutes after the inoculum has beenstandardized as described above, 100 μL of the adjusted inoculum wasadded to each tube containing 4 μL of the compounds in the dilutionseries with a positive control well containing only broth and the plateswere incubated.
Procedure: After 15 days of incubation, resazurin was added anda colour change observed after 48 hours of incubation.
Results
Discussion
According to BLAST analysis of the ITS region, thestrain BRS2A-AR2F displays the 100% nucleotide similaritywith Cladosporium oxysporum and Cladosporium tenuissimum and ITS data is not sufficient to discriminate for the strain species( Figure 1 ). Cladosporium tenuissimum conidiophores are up to 310(-460) μm long and are often subnodulose or nodulose with a headlikeswollen apex and sometimes a few additional nodes on a lowerlevel but, most conidiophores are neither geniculate nor nodulose. Cladosporium oxysporum conidiophores are up to 720 μm or longer and are always nodulose to nodose, with conidiogenous locirestricted to swellings on synthetic nutrient-poor agar (SNA). Loci on C. tenuissimum are often situated on swellings but, are not restrictedto them. In intercalary conidiogenous cells, loci often sit at about thesame level on the stalk, but are not connected with swellings as in C. oxysporum . They are on potato-dextrose agar (PDA) and oatmealagar (OA) conidiophores that are darker and often with swellings[ 28 ]. Microscopic observations of isolate were made from coloniescultivated on SNA, PDA and OA for 7 days at 25 °C using the methodof Bensch et al. [ 28 ]. Morphological features were consistent with thefact that strain BRS2A-AR2F belong to Cladosporium oxysporum . Thesequence was deposited in GenBank nucleotide sequence databaseunder KX257257.
Quinolactacin A2 was isolated as a very light yellow substancewhich on drying under nitrogen gas turned into very white andflaky bits that easily became airborne. Apparently, the light yellowportion was only remnants of impurities from the crude extracts. Thecompound was soluble both in dichloromethane and methanol. TheUV profile was very interesting with wavelength absorption maximaat λmax 221, 248, 255, 315 and 328 nm in 0.1% formic acid methanolsolution ( Figure s4 ). The mass spectrometry data of quinolactacinA2 was also very interesting and actually played a part to concealthe identity of this compound until late in the structure elucidationprocess. Two peaks 293.1262 and 563.2631 were very consistent in themass spectrometry data of the crude extracts as well as pure fractions containing quinolactacin A2. Initially, during the dereplication stage,these masses were entered into the databases but they returned withno hits and rightfully so. It turned out after the analysis of 1D and 2DNMR data that, 293.1262 was [M + Na]+ and 563.2631 was [2M + Na]+( Figure s3 ). The molecular weight of the isolated quinolactacin wastherefore 270.1362 representing a molecular formula of C16H18N2O2(Δ = 0.1 ppm) and nine (9) degrees of unsaturation.
The 1H, 13C and multiplicity edited gHSQC spectra, suggestedthe presence of 6 quaternary carbons, 6 methine, 1methylene and 3methyl carbons. The δH 7.50 (1H, dd, J = 8.8, 4.4 Hz, H-5), 7.68 (1H,ddd, J = 8.0, 7.2, 4.0 Hz, H-6), 7.40 (1H, ddd, J = 8.0, 7.2, 6.8 Hz, H-7)and 8.39 (1H, ddd, J = 8.8, 6.4, 4.8 Hz, H-8) were direct indication ofa spin system belonging to a di-substituted aromatic ring. Analysisof the gCOSY correlations H-6/H-5, H-6/H-7, H-8/H-7, H-7/H-8,H-7/H-6 and H-5/H-6 fully confirmed the di-substituted benzenearomatic portion of the quinolone moiety. The gHMBC correlationsC-5/H-7, C-6/H-8, C-7/H-5, C-8/H-6 and 2D-TOCSY correlationsH-6 to H-8 and H-8 to H-6 was consistent with this first substructure.Furthermore, the gHMBC correlations C-8a/H-5, H-7, C-4a/H-6,H-8 and C-9/H-8 confirmed C-8a and C-4a showing at δC 128.2and 141.3 as the two quaternary carbons in the quinolone benzenearomatic ring. C-9 at δC 173.5 was therefore the ketone functionalitypresent in the quinolone skeleton. The two quaternary olefiniccarbons that are α,β to C-9 could easily be assigned as δC 110.9 and164.1 corresponding to carbons C-9a and C-3a respectively with the gHMBC correlation C-3a to 4-CH3 confirming their placements. TheδH 2.12 (1H, ov., H-1’), 0.53 (3H, d, J = 6.8 Hz, 1’-CH3), 1.63 (1H, m,H-2’), 1.49 (1H, m, H-2’’), 1.05 (3H, t, J = 7.2 Hz, H-3’),4.76 (1H, s,H-3) and 5.98 (1H, d, J = 45.2, 2-NH) along with gCOSY correlationsH-1’/2-NH, H-3, 1’-CH3, H-2’/H-3, H-3/H-2’, H-2’’, 2-NH/H-1’ and1’-CH3/H-1’ confirmed the attachment of a 2-butyl substituent atposition C-3 of the γ-lactam ring. 2D-TOCSY correlations providedconfirmation for all the spin systems present in the compound ( Figure 2 ). All the remaining 1D and 2D NMR data are summarised in ( table s1 ) and raw data are as shown in ( s5- s10 ).
Butrecitrinadin was isolated as a very deep yellow crystalline substance that was soluble in both dichloromethane and methanol. This compound showed prominent wavelength absorption maxima at λmax 221, 250, 270 and 332 nm in a 0.1% formic acid methanol solution ( figure s4 ). The HRESIMS of this compound gave m/z = 681.4223 for [M + H]+ corresponding to a molecular formula of C38H57N4O7 (Δ = 0.2 ppm) with thirteen (13) degrees of unsaturation. Butrecitrinadin shows the same fragmentation pattern as citrinadin with a difference of m/z = 57.0335 corresponding to the formula C3H5O+ which is a substituent on the C-18 hydroxyl group of the quinolizidine containing tricyclic ring system ( s11- s12 ).
The δC chemical shifts of butrecitrinadin were extracted from the gHSQC, HMBC and DEPT-135° data. Analysis of the 1H, 13C and multiplicity edited gHSQC spectra, suggested the presence of 12 quaternary carbons, 9 methine, 7 methylene and 10 methyl carbons. The huge molecular weight of 681.4223 with about 31% of the carbon atoms being quaternary alongside the observation of only few correlations in the gCOSY spectrum was direct indication of the presence of several very short spin systems which is typical of the butrecitrinadin backbone. The only substructures obtained by analysis of gCOSY data are as shown in ( figure 3 ). The aromatic protons at δH 7.65 (1H, d, J = 7.2, H-4), 7.20 (1H, ov., H-5) and 7.76 (1H, d, J = 7.2, H-6) were direct indication of a tri-substituted benzene ring and gCOSY correlations H-5/H-6, H-4 confirmed this spin system. Furthermore, gCOSY correlations from H-14/H-13, H-13’, H-15, H-15’ and H-12/H-13, H-13’, H-15, H-15’ established the only spin system present in the quinolizidine containing tricyclic ring system ( figure 3 ). The δH 2.04 (1H, ov., H-4’), 2.75 (1H, d, J = 10.8, H-2’), 1.00 (3H, d, J = 6.4, H-5’) and 0.90 (3H, d, J = 6.8, H-6’) and gCOSY correlations H-4’/H-2’, H-5’ and H-6’ established the spin system present in the N,N-dimethyl valine residue at C-14. Diastereotopic protons were observed at positions C-10, C-8, C-13, C-15 and C-17. Unlike the gCOSY data, the gHMBC was very detailed and provided a lot of correlations to complete a large part of the structure. The aromatic benzene ring portion of the spirooxindole was completed with the aid of gHMBC correlations from C-6/H-4, C-7/H-5, C-3a/H-5, C-7a/H-6, C-7a/H-4 and C-4/H-6. The δC 185.3 (C-2) and 64.4 (C-3) along with the gHMBC correlation C-2/H-8 provided concrete evidence of the existence of an indolinone ring. The remaining part of the cyclopenta [b] quinolizidine moiety was also extended with the aid of crucial HMBC correlations C-18/H-29, C-19/H-28, C-9/H-29, C-9/H-28, C-28/H-29, C-18/H-28, C-9/H-8 and C-18/H-8 ( figure 3 ). gHMBC correlations C-24/H-23, C-23/H-24, C-22/H-23, C-22/H-24, C-21/H-23 and C-23/H-21 provided proof of the presence of the epoxy propane ring and its substituents while HMBC correlations C-2’/H-7’, C-2’/H-8’, C-2’/H-6’, C-2’/H-5’, C-5’/H-6’, C-7’/H-8’, C-8’/H-7’ and C-4’/H-5’ made it obvious that, the N,N-dimethylvaline residue was present in this structure. In order to confirm the structural assignments made by gCOSY and gHMBC data, a detailed interpretation of the 2D-TOCSY of butrecitrinadin was made. Here further confirmation of all the spin systems made it obvious that, the structure in question was butrecitrinadin. A detailed illustration of the data obtained from the 2D-TOCSY is shown in ( figure 3 ). All 1D and 2D NMR data are summarized in ( table 1 ) and raw data can be found in ( s13- s17 ).
The anti-proliferative activities of the three compounds quinolactacin A2, citrinadin A and butrecitrinadin were tested on human cancer cell lines and the results are as shown in ( figure 4 ). The compounds showed some level of anti-proliferative activity against some of the cell lines compared to curcumin as a positive control. The cell growth-inhibitory potencies of compounds, expressed as IC50 values, are shown in ( table 2 ). Quinolactacin A2, citrinadin A and butrecitrinadin, showed no activity against Jurkat and PC-3 cells but, the three compounds showed moderate anti-proliferative activity against LNCap and HL-60 cells. However, the activity of the three compounds towards HEPG2 and MCF-7 was good when compared to curcumin, a well-known potent inhibitor of cancer cell lines.
Quinolactacin A2, citrinadin A and butrecitrinadin were also tested against the chloroquine sensitive Plasmodium falciparum 3D7 strain for anti-plasmodial activity as shown in ( figure 5 ). Only quinolactacin A2 showed anti-plasmodial activity within the concentration range tested. ( table 3 ) shows the half maximal effective concentration (EC50) of quinolactacin A2, citrinadin A and butrecitrinadin for 3D7 plasmodial strain. Quinolactacin A2 gave an EC50 of 24.80 μM, while citrinadin A and butrecitrinadin gave values higher than 25.00 μM. This represents the first study of the anti-plasmodial activity of quinolactacins in general and the results proved very encouraging.
The apoptotic activity of quinolactacin A2 on 3D7 plasmodia strain was evaluated by studying the effect of the compound on the mitochondrion membrane potential of the parasite. The effect of the compound on the loss of mitochondrion membrane potential of this strain after treatment with 0 μM, 6.25 μM, 12.5 μM, 25.0 μM and 50.0 μM concentrations of quinolactacin A2 for 24 hours were analysed by flow cytometry after staining with JC-1. ( Figure 6 ) shows the percentage of apoptotic cells for the parasite after treatment with the compound and a histogram displacement is plotted in ( Figure 7 ) which indicates dissipation of the mitochondrial membrane potential (ΔΨm) and abolition of probe accumulation in a concentration dependent manner. Mitochondria play an essential role in apoptosis induction by a variety of death stimuli and therefore, the ability of quinolactacin A2 to compromise mitochondrial changes will lead to the loss of the ΔΨm which will result in cytochrome C release from the mitochondria to the cytosol. Literature provides evidence that one of the mechanisms of malaria drug resistance is mediated through a decrease in apoptosis susceptibility and hence quinolactacin A2 may provide a scaffold to apoptotic death in the stages of Plasmodium falciparum development.
The compounds quinolactacin A2, citrinadin A and butrecitrinad in were tested for Anti-buruli ulcer activity on Mycobacterium ulcerans MN209 characterised isolates and the minimum inhibitory concentrations (MICs) are shown in ( Table 4 ). All the compounds showed no interesting MICs within the concentration range tested.
Conclusion
The co-isolation of 2, 12 and 13, from the same species suggests that the biosynthetic gene clusters for making quinolactacins and citrinadins which have been independently isolated and characterized from different species of Penicillium can be found in the same genome. While the three compounds show no activity against Jurkat and PC-3 cells, each of them possess different but moderate levels of anti-proliferative activities against HL-60, LNCap, HepG2, and MCF7 when tested in comparison to curcumin. Also, while the citrinadins, 12 and 13 possess no activity against the chloroquine sensitive Plasmodium falciparum 3D7 strain, 2 was found to be active within the concentration range tested with an EC50 value of 24.80 μM compared to artesunate 0.074. 2 cause dissipation of the mitochondrial membrane potential (ΔΨm) and abolition of probe accumulation in a concentration dependent manner. Hence 2 may provide a drug development scaffold for apoptotic death in the stages of Plasmodium falciparum development. 2, 12 and 13 are inactive towards the Table 4 MN209.
References
- Kakinuma N, Iwai H, Takahashi S, Hamano K, Yanagisawa T, et al. (2000) Quinolactacins A, B and C: novel quinolone compounds from Penicillium sp. EPF-6. I. Taxonomy, production, isolation and biological properties. J Antibiot (Tokyo) 53: 1247-1251.
- Takahashi S, Kakinuma N, Iwai H, Yanagisawa T, Nagai K, et al. (2000) Quinolactacins A, B and C: novel quinolone compounds from Penicillium sp. EPF-6. II. Physico-chemical properties and structure elucidation. J Antibiot (Tokyo) 53: 1252-1256.
- Abe M, Imai T, Ishii N, Usui M, Okuda T, et al. (2005) Quinolactacide, a new quinolone insecticide from Penicillium citrinum Thom F 1539. Biosci Biotechnol Biochem 69: 1202-1205.
- Kozlovsky AG, Zhelifonova VP, Antipova TV, Adanin VM, Ozerskaya SM, et al. (2003) Quinocitrinines A and B, new quinoline alkaloids from Penicillium citrinum Thom 1910, a permafrost fungus. J Antibiot (Tokyo) 56: 488-491.
- Kim WG, Song NK, Yoo ID (2001) Quinolactacins A1 and A2, new acetylcholinesterase inhibitors from Penicillium citrinum. J Antibiot (Tokyo) 54: 831-835.
- Clark B, Capon RJ, Lacey E, Tennant S, Gill JH (2006) Quinolactacins revisited: from lactams to imide and beyond. Org Biomol Chem 4: 1512-1519.
- Heeb S, Fletcher MP, Chhabra SR, Diggle SP, Williams P, et al. (2011) Quinolones: from antibiotics to autoinducers. FEMS Microbiol Rev 35: 247-274.
- Van Bambeke F, Michot JM, Van Eldere J, Tulkens PM (2005) Quinolones in 2005: an update. Clin Microbiol Infect 11: 256-280.
- Andriole VT (2005) The quinolones: past, present, and future. Clin Infect Dis 41 Suppl 2: S113-S119.
- Aldred KJ, Kerns RJ, Osheroff N (2014) Mechanism of quinolone action and resistance. Biochemistry 53: 1565-1574.
- Soni K (2012) Fluoroquinolones: chemistry & action - a review. Indo Glob J Pharm Sci 2: 43-53.
- Tsuda M, Kasai Y, Komatsu K, Sone T, Tanaka M, et al. (2004) Citrinadin A, novel pentacyclic alkaloid from marine-derived fungus Penicillium citrinum. Org Lett 6: 3087-3089.
- Mugishima T, Tsuda M, Kasai Y, Ishiyama H, Fukushi E, et al. (2005) Absolute stereochemistry of citrinadins a and B from marine-derived fungus. J Org Chem 70: 9430-9435.
- Kushida N, Watanabe N, Okuda T, Yokoyama F, Gyobu Y, et al. (2007) PF1270A, B and C, novel histamine H3 receptor ligands produced by Penicillium waksmanii PF1270. J Antibiot (Tokyo) 60: 667-673.
- Zheng Y, Tice CM, Singh SB (2014) The use of spirocyclic scaffolds in drug discovery. Bioorg Med Chem Lett 24: 3673-3682.
- Yu B, Yu DQ, Liu HM (2015) Spirooxindoles: promising scaffolds for anticancer agents. Eur J Med Chem 97: 673-698.
- Liu J, Sun Y, Zhang X, Liang X, Wu Y, et al. (2014) Spirooxindoles, a potential novel class of anti-inflammatory agents. Inflamm Cell Signal.
- White TJ, Bruns T, Lee S, Taylor J (1990) Amplification and direct sequencing of fungal ribosomal RNA genes for phylogenetics. In: Innis M, Gelfand G, Shinsky J, White T, (Eds). PCR protocols: a guide to methods and applications, pp. 18: 315-322.
- 19.Tamura K, Stecher G, Peterson D, Filipski A, Kumar S (2013) MEGA6: molecular evolutionary genetics analysis version 6.0. Mol Biol Evol 30: 2725-2729.
- 20.Saitou N, Nei M (1987) The neighbor-joining method: a new method for reconstructing phylogenetic trees. Mol Biol Evol 4: 406-425.
- Jukes TH, Cantor CR (1969) Evolution of protein molecules. In: Munro HN (Ed). Mammalian protein metabolism, 3: 22-126.
- Felsenstein J (1985) Confidence limits on phylogenies: an approach using the bootstrap. Evolution 39: 783-791.
- Kupchan SM, Davies VH, Fujita T, Cox MR, Restivo RJ, et al. (1973) Isolation and structural elucidation of liatrin, a novel antileukemic sesquiterpene lactone from Liatris chapmanii. J Org Chem 38: 1853-1858.
- Ayisi NK, Nyadedzor C (2003) Comparative in vitro effects of AZT and extracts of Ocimum gratissimum, Ficus polita, Clausena anisata, Alchornea cordifolia, and Elaeophorbia drupifera against HIV-1 and HIV-2 infections. Antiviral Res 58: 25-33.
- Trager W, Jensen JB (1976) Human malaria parasites in continuous culture. Science 193: 673-675.
- Smilkstein M, Sriwilaijaroen N, Kelly JX, Wilairat P, Riscoe M (2004) Simple and inexpensive fluorescence-based technique for high-throughput antimalarial drug screening. Antimicrob Agents Chemother 48: 1803-1806.
- Yemoa A, Gbenou J, Affolabi D, Moudachirou M, Bigot A, et al. (2011) Buruli ulcer: a review of in vitro tests to screen natural products for activity against Mycobacterium ulcerans. Planta Med 77: 641-646.
- Bensch K, Braun U, Groenewald JZ, Crous PW (2012) The genus Cladosporium. Stud Mycol 72: 1-401.