
Journal of Bioelectronics and Nanotechnology
Download PDF
Research Article
*Address for Correspondence: Marlon Thomas, Department of Biomedical Engineering, Wichita State University, Wichita, Kansas 67260, USA, Tel: 9512754365, E-mail: marlon.thomas@wichita.edu
Citation: Thomas M, King S, Wu D. Enhanced Separation and Counting of CD4+ T Lymphocytes from Whole Blood Using a Quartz Microfluidic Magnetic Immunoassay. J Bioelectron Nanotechnol 2015;1(1): 6.
Copyright © 2015 Thomas M et al. This is an open access article distributed under the Creative Commons Attribution License, which permits unrestricted use, distribution, and reproduction in any medium, provided the original work is properly cited.
Reviewed & Approved by: Dr. Alexander Marcus Seifalian, Professor, Centre for Nanotechnology & Regenerative Medicine, University College London, UK.
Journal of Bioelectronics and Nanotechnology | Volume: 1, Issue: 1
Submission: 30 September, 2015 | Accepted: 18 December, 2015 | Published: 22 December, 2015
 Microfluidic device fabrication
 Staining of CD4+ T Lymphocytes
 Magnetic sphere capture
As expected, the slower the flow rates, the higher the capture efficiency. This is because the higher flow rates will induce shearing that is sufficient to break the bond between the cells and the antibodycoated magnetic beads. Flow at rates of 2 μl min -1or lower is in the creeping flow regime and will reduce the shear experienced by the cells.
Enhanced Separation and Counting of CD4+ T Lymphocytes from Whole Blood Using a Quartz Microfluidic Magnetic Immunoassay
Marlon Thomas1*, Stephanie King3 and Di Wu2
- 1Department of Biomedical Engineering, Wichita State University, Wichita, Kansas 67260, USA
- 2Department of Industrial and Manufacturing Engineering, Wichita State University, Wichita, Kansas 67260, USA
- 3College of Pharmacy, University of Kansas, Wichita, Kansas 66047, USA
*Address for Correspondence: Marlon Thomas, Department of Biomedical Engineering, Wichita State University, Wichita, Kansas 67260, USA, Tel: 9512754365, E-mail: marlon.thomas@wichita.edu
Citation: Thomas M, King S, Wu D. Enhanced Separation and Counting of CD4+ T Lymphocytes from Whole Blood Using a Quartz Microfluidic Magnetic Immunoassay. J Bioelectron Nanotechnol 2015;1(1): 6.
Copyright © 2015 Thomas M et al. This is an open access article distributed under the Creative Commons Attribution License, which permits unrestricted use, distribution, and reproduction in any medium, provided the original work is properly cited.
Reviewed & Approved by: Dr. Alexander Marcus Seifalian, Professor, Centre for Nanotechnology & Regenerative Medicine, University College London, UK.
Journal of Bioelectronics and Nanotechnology | Volume: 1, Issue: 1
Submission: 30 September, 2015 | Accepted: 18 December, 2015 | Published: 22 December, 2015
Abstract
The ability to economically monitor the progression of the Human Immunodeficiency Virus (HIV) infections in patients living in resourcelimited areas is of critical importance to enhance the level of care received by patients. This is particularly important because careful monitoring of T lymphocytes subsets is one of the primary measures used in determining at which point to initiate antiretroviral therapy. This information is crucial to HIV infected patients because it allows for their care providers to adjust their treatment options based on their response to treatment. In this paper, we discuss the development of a re-useable quartz microfluidic device that was designed and tested to enhance point-of-care blood analysis and offers a method for rapidly determining absolute CD4+ T lymphocytes cell counts from whole blood. Blood was first diluted 10:1 in Hepes buffer solution, mixed with the magnetic bead solution and then introduced to the microfluidic device for continuous, magnetic separation by Magnetic Field Flow Fractionation. The device used commercially available magnetic beads that are functionalized with CD4+ antibodies to bind to the Cluster of differentiation 4 (CD4+) glycoprotein on T lymphocytes isolated from whole human blood. The CD4+ cell counts were obtained using an inverted optical microscope. The traditional CD4+ T lymphocyte counts were determined using a hemocytometer, after the cells were separated from whole human blood. The data shows an inverse relationship between capture efficiencies and flow rates while linear correlation was seen between capture efficiencies and the start cell densities. This microfluidic device seems well suited for use as a point-of-care device for determining absolute counts for CD4+ T lymphocytes in resource-limited areas.Keywords
CD4+ T Lymphocytes; Absolute cell counts; Quartz microfluidic device; Human immunodeficiency virus (HIV)Abbreviations
CD4+: Cluster of differentiation 4 is a glycoprotein found on the surface of immune cells such as T helper cells; HIV: Human Immunodeficiency Virus; PDMS: Polydimethylsiloxane; PI: Propidium Iodide; PBS: Phosphate Buffered Saline; RPMs: Revolutions per Minutes; DMEM: Dulbecco’s Modified Eagle MediumIntroduction
There are over 30 million people worldwide who are infected with the Human Immunodeficiency Virus (HIV) and this number will likely continue to rise until a cure can be identified and made widely available [1-3]. Monitoring the progression of HIV infection is particularly important in determining at what point to initiate antiretroviral therapy [4-7]. Blood is generally believed to contain approximately 2% of the total lymphocyte population in the body. The T lymphocytes that express Cluster of differentiation 4 (CD4+) glycoprotein counts are often reported as the number of cells in one μl of blood [8-10]. The guidelines from the Center of Disease Control and Prevention reports that T cell counts of 200 cells μl-1, which is approximately 15% of the total CD4+ cells in the body, serve as one of the important reference points that is used to determine when an HIV infected person is considered immune deficient [11,12]. In developed nations, the standard method for performing CD4+ T lymphocyte counts is done using a flow activated cell-sorting (FACS) machine [13-15]. In resource-limited settings, current state of the art equipment like FACS may be too expensive and time-consuming to be used routinely. Due to the lack of access to modern laboratory facilities having FACS machines, physicians in developing nations sometimes make their diagnosis and treatment evaluations without knowledge of the CD4+ T lymphocyte cell count in the patient’s blood. The cost and maintenance of FACS machines make the technology expensive for medical centers and hospitals in developing nations [13-16]. For this reason, treatment options are often not customized to the patients even though it is known that the CD4+ T lymphocytes are highly variable between patients infected with HIV. As a result, many developing nations see reduced drug efficacy and subsequent increases in mortality compared to developed nations [17,18]. Therefore, there is a critical need for establishing low cost, portable, accurate methods for rapid monitoring of CD4+ T lymphocyte counts from whole blood [19].There have been several reported efforts to develop, easy-to-use methods for absolute counting of T lymphocyte subsets [20-23]. A label free detection method using an optofluidic ring resonator sensor was designed using microfluidic technology; however this method required cell lysis of T lymphocytes, which is a difficult step to automate [14]. Enzyme linked immunosorbent assays (ELISA) have been developed and used; however, the results from these methods are inconsistent [15-22]. Additionally, other immune-magnetic separation techniques have been explored but these techniques suffered from low throughput and were therefore relatively slow [18,19,22]. Miniature devices have been utilized but are not able to accurately count cells at both high and low concentrations [24-26].
The World Health Organization has set ambitious goals for the number of patients they hope can receive treatment for HIV over the next few years [27-29]. While these goals are commendable, new lower cost technology will be needed to help make this goal a reality [30-37]. Here we present a microfluidic device that has the potential of enhancing the speed and simplicity of counting CD4+ cells while maintaining the accuracy of the commercially available magnetic beads. Our reusable glass microfluidic devices utilize magnetic field flow fractionation to allow continuous concentration of magnetic beads in a flow system. In our study we evaluated the performance of the T4 Quant kit in a modified format on a glass microfluidic device. We compared the cell counts using a traditional off-chip method to our modified method using the glass microfluidic device. The capture efficiency, stability and lot-to-lot variations were compared to performing a batch process with our new device. The enhanced speed and simplicity makes this a significant addition to the current options for low-cost methods for CD4+ T lymphocyte cell counts.
Materials and Methods
Chemical and reagentsAll chemicals were analytical grade and were used without any further purification. Ethanol (200 proof) and 1 M Hepes buffer solution were purchased from Sigma-Aldrich (St. Louis, MO, USA). Whole blood samples were purchased from Zen-Bio (Research Triangle, NC, USA) at a density of 5x10^9 cells ml-1 DMEM cell media, Dynal T4 Quant Kit, SYTO-9, Propidium iodide, FluoroSphere biotin-labeled microspheres were purchased from Life Technologies (Carlsbad, CA, USA).
Microfluidic device design
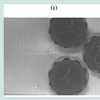
We designed the microfluidic device to have a Y-shaped focused stream of cells in the center channel in order to have an even distribution of cells. The device had Y-shaped inlets with a center channel with the blood sample and two bifurcated outlet channels on either side of the device (top and bottom). A steep indentation was created next to one outlet to facilitate magnetic field flow fractionation in the flow field, as can be seen in Figures 1a and 1b. Similar designs have demonstrated tremendous capacity for facilitating efficient biological cell separation based on magnetic, electrophoretic, gravitational and thermal field flow fractionation. Micrographs of the interior of the quartz microfluidic device can be seen in Figures 2a and 2b.
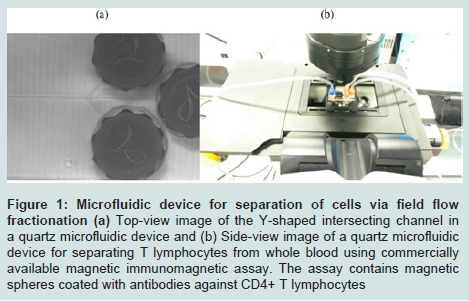
Figure 1: Microfluidic device for separation of cells via field flow fractionation (a) Top-view image of the Y-shaped intersecting channel in a quartz microfluidic device and (b) Side-view image of a quartz microfluidic device for separating T lymphocytes from whole blood using commercially available magnetic immunomagnetic assay. The assay contains magnetic spheres coated with antibodies against CD4+ T lymphocytes
The microfluidic device was fabricated by micromachining quartz using a proprietary technique (Translume, MI, USA). The microfluidic device was designed using Adobe Illustrator and then the designs were sent to a commercial glass micromachining shop for fabrication in fused quartz (Translume, Ann Arbor, MI, USA). The device thermally bonded to a sheet of fused quartz to form the bottom of the device. The channel width and depth were fabricated to be 100 μm, which was confirmed by stylus profilometry. The inlets and outlets were 2 mm circles with plastic female luer lock connectors mounted on top of the device. The luer connectors were connected to lose compatible barbed male luer connectors for any tube with a 1.6 mm inner-diameter. The device was designed to allow external magnets to fractionate magnetic particles in the flow field. There is a difference in the depth of the channel from the inlet to the outlet. The change occurs abruptly 1.0 cm along the center channel. The depth changes from 100 μm to a total depth of 1500 μm.
Sample preparation
The human blood samples were purchased from Zen Bio (Research Triangle, NC, USA) and stored at 4 °C until used. The whole blood samples were centrifuged at 4000 rpm for 3 min and the supernatant decanted. Cells were isolated and rinsed in 20 mM Hepes buffer (pH 7.4) in the centrifuge tube. The cells were re-suspended in 10 ml of 20 mM Hepes buffer. T lymphocyte cells were counted using a hemocytometer and the cell density was kept between 1x10^5 cells ml^-1 and 5x10⁷ cell mL-1. The cell viability was evaluated using a dual fluorescent assay of 5 μM SYTO 9, a cell permeable green fluorescent stain, and 1 mg mL-1 propidium iodide, a cell impermeable red fluorescent stain. A serial dilution of the cells was performed in 20 mM Hepes buffer solution. Cells were analyzed within 1 hour after thawing cells.
On-chip selection of cells
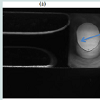
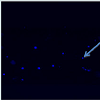
Our device was designed to count diluted whole blood or preseparated white blood cells that were derived from whole blood. In our experiments, no further processing was done. The blood cells and antibody-coated cells were mixed such that there was a 10 excess of beads. The immunomagnetic spheres coated with antibodies against CD4+ T lymphocytes were used to bind to T lymphocytes in blood and then separated by a magnetic force. The magnetic force was provided by the placement of a permanent magnetic with surface force field strength of 4400 Gauss. The cells on the separation area were counted using a counting chamber or once could use a measure of fluorescent intensity if the cells were previously labeled. This step could be auto mated in the future by using an image processing software package. Figure 2b shows immunomagenetic spheres coated with anti-CD4+ T lymphocyte antibodies that were isolated from human blood using the quartz device.
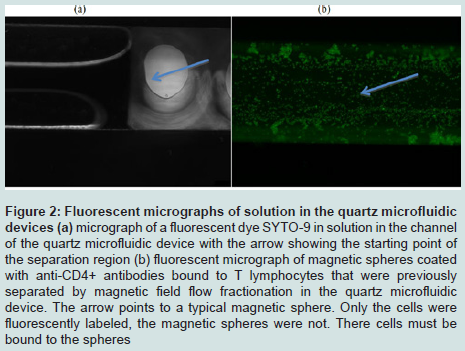
Figure 2: Fluorescent micrographs of solution in the quartz microfluidic devices (a) micrograph of a fluorescent dye SYTO-9 in solution in the channel of the quartz microfluidic device with the arrow showing the starting point of the separation region (b) fluorescent micrograph of magnetic spheres coated with anti-CD4+ antibodies bound to T lymphocytes that were previously separated by magnetic field flow fractionation in the quartz microfluidic device. The arrow points to a typical magnetic sphere. Only the cells were fluorescently labeled, the magnetic spheres were not. There cells must be bound to the spheres
Whole blood samples were removed from the refrigerator and heated to 37 °C using warm water bath. Cells were aseptically transferred to a 2 ml solution of DMEM/F-12 cell media in a conical 15 ml centrifuge tube. After 30 min, the cell solution was centrifuged at 4200 RPMs for 5 min and the media was decanted. The pelleted cells were then suspended in 20 mM Hepes buffer. To determine the number of CD4+ cells in solution, a 15 μL sample of 50 μM SYTO 9 was mixed with 450 μL of 20 mM Hepes buffer in a plastic centrifuge vial and incubated for 15 min at room temperature. Cells were centrifuged and the supernatant decanted. Cells were re-suspended in 20 mM Hepes buffer. Cells were immobilized by the magnetic immunoassay and separated on the quartz microfluidic device. The cells were then imaged by bright field microscopy.
Cell viability assay
A pipette was used to transfer 200 μL of the CD4+ cell solution into a centrifuge vial. The cell solution was mixed 50/50 with a 20 mM Hepes solution containing 5 μM SYTO 9 and 2 mg mL-1 of propidium iodide. Cells were incubated in the dye solution for 15 min and then washed and re-suspended in Hepes buffer.
Off-chip cell isolation
The CD4+ lymphocytes were isolated from lymphocyte suspensions using magnetic spheres coated with anti-CD4 antibodies. A pipette was used to transfer 100 μL of the magnetic spheres to 100 μL of lymphocyte suspension in a plastic centrifuge vial and the suspension incubated for 20 min at room temperature. The magnetic spheres with cells bound were separated from the bulk solution by an external NdFeB magnet with surface field strength of 4400 Gauss. After separation, the cells were washed with 20 mM Hepes buffer solution. The captured cells were then counted manually using an inverted fluorescent microscope (Leica, Wetzler, German).
On-chip magnetic bead capture
The initial step in the process was mixing a known amount of magnetic spheres with the CD4+ T lymphocyte samples. The cells were allowed to incubate for 15 min before introduction of the complete sample into the microfluidic device. The spheres were separated by flowing into the quartz microfluidic device with a permanent magnet placed on the bottom surface of the device. The flow rate of the beads was varied between 0.2-200 μl min-1 to determine the maximum flow rate for full capture of all cells. The beads in the device migrated towards the magnetic field and were separated from the flow stream. The cells were counted in the device by taking an image of a known region that was 100 μm x 100 μm and compared to the traditional method of collecting the cells and counting them using a hemocytometer. The T4 Quant beads were first washed with 20 mM Hepes and diluted to 5x10⁹ beads mL-1 as described earlier [38]. 10 μL of the bead solution was pipetted into a plastic centrifuge tube and mixed with 100 μL of cell solution and 890 μL of 20 mM Hepes buffer solution. The solution was mixed by pipetting back and forth and then allowed to sit for 20 min. The solution was introduced to the micro-channel at a controlled flow rate using a syringe pump (VWR Intl, USA) and stratified using an applied magnetic field. The magnetic particles and all immobilized cells were separated in one direction while the other components of the mixture with a low magnetic moment kept on their original trajectory.
Results and Discussion
Device designThe design of the quartz microfluidic device was designed in an effort to try to provide a way of efficiently separating cells in a continuous manner as opposed to the batch process of using an external magnet and waiting for a pre-set time. The continuous separation method offered some significant advantages over the traditional methods. It was able to capture cells in a flow system which opens the possibility of having an online system. The system was able to operate of a range of flow rates that varied between 0.2-200 μl min-1, as seen in Table 1 and it has higher capture efficiencies than the traditional method. While we did not compare our method to Flow Activated Cell Sorting (FASC), we expect that the relatively gentle action of the magnetic force field would be a softer separation technique compared to FASC given the fact that FASC imparts an electrical charge to separate cells which could have a dramatic impact on the cell viability. We know that the magnetic spheres are able to efficiently capture and separate CD4+ cells because we only added a fluorescent label to the T lymphocytes that were separated in Figure 2b and not to the spheres, yet one can clearly see a strong fluorescent intensity from the attached cells. The magnetic spheres are about 10x smaller than the CD4+ T lymphocytes from blood so it may be possible for multiples cells to bind to a single sphere. At a flow rate of 0.2 μl min-1, the microspheres gave the highest separation efficiencies due to the long residence time. This flow rate may be impractical for real samples, therefore, we suggest that an understanding of what capture efficiency is desired for the experiment one is interested in performing is important. If speed is a premium, then simply use the fastest rate and compromise with lower capture efficiencies.
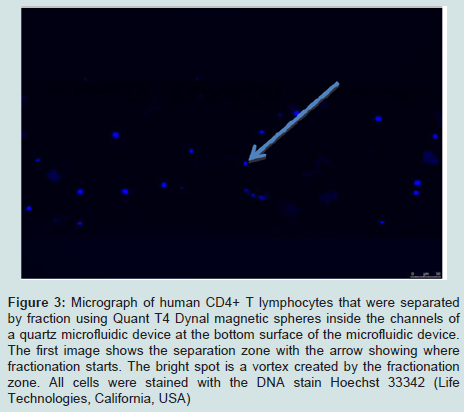
Figure 3 : Micrograph of human CD4+ T lymphocytes that were separated by fraction using Quant T4 Dynal magnetic spheres inside the channels of a quartz microfluidic device at the bottom surface of the microfluidic device. The first image shows the separation zone with the arrow showing where fractionation starts. The bright spot is a vortex created by the fractionation zone. All cells were stained with the DNA stain Hoechst 33342 (Life Technologies, California, USA)
The range of flow rates evaluated in this study was 0.2-200 μl min-1. This range was established for practical reasons; the syringe pump cannot effectively pump at a rate lower than 0.2 μl min-1 and due to the tremendous backpressures, it cannot pump faster than 200 μl min-1. The 2.0 μl min,-1 gave a reasonable compromise between capture efficiency and speed while still outperforming the traditional static off-chip method. To achieve a higher capture efficiency than the traditional method, a 10x excess of magnetic spheres: cells was used in each experiment. Our results are presented in Table 2 below. The 2.0 μl min -1 setting was used to compare starting cell densities to capture efficiencies. We should stress that this is not an optimized fluid flow rate since little work has been done to optimize the various aspects of the device but we have observed the best results at the lowest flow rate of 0.2 μl min-1. Note that the actual flow rate may be much faster than the settings on the syringe pump since the volume of the fluid in the channels is orders of magnitudes smaller than the volume of fluid in the tubing connected to the syringe. The conservation of mass will force the buffer solution to flow faster in the tube. See the results on the cell counts as a function of fluid velocity in Table 1 below.
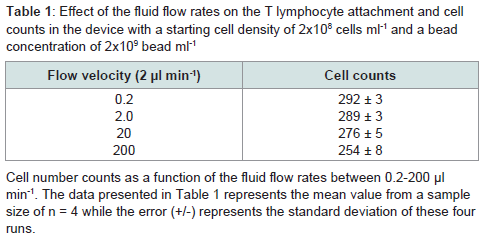
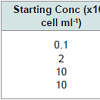
Table 1: Effect of the fluid flow rates on the T lymphocyte attachment and cell counts in the device with a starting cell density of 2x10⁸ cells ml-1 and a bead concentration of 2x10⁹ bead ml-1
Table 2 highlights results from our analysis of our microfluidic device using a whole blood sample collected from a human subject. In all experiments, we used a fluid flow rate of 2 μl min-1. In Table 2, we compare our results to those we obtained by using an off-chip separation method using a batch process and an external magnet. We evaluated the relationship that existed between the density of cells introduced to the microfluidic device and the number of cell captured and counted when flowing at 2 μl min-1 . Table 2 indicates a direct proportionality between the introduced cell density and the resulting cell number counts.
The capture efficiencies of CD4+ T lymphocyte cell counts using the on-chip method were enhanced compared to the traditional off-chip method. The data for the on-chip data was provided as a function of the fluidic flow rates and starting cell densities. We could see that the capture efficiencies between the two methods were similar, but our microfluidic method has a better separation efficiency as seen by the higher cell counts, as shown in Table 2. This is not surprising by considering that we are using a flow process. Indeed, we could increase our capture efficiencies by adding a recycle stream. The greatest advantage with using over microfluidic device with an immunomagnetic assay is the length for each analysis. The average time required for off-device analysis was greater than 60 min while the average on-chip time of analysis was less than 30 min.
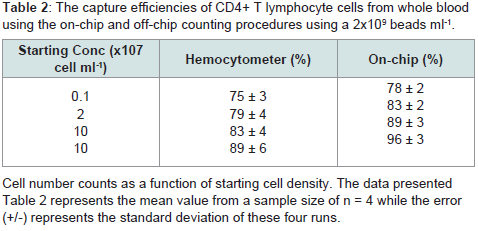
Table 2: The capture efficiencies of CD4+ T lymphocyte cells from whole bloodusing the on-chip and off-chip counting procedures using a 2x10⁹ beads ml-1.
Conclusion
In this study we demonstrated the use of a quartz microfluidic device could assist and potentially enhance the absolute counts of CD4+ T lymphocyte in whole blood. We demonstrated our findings using the commercially available T4 quant kit that featured magnetic spheres coated with anti-CD4+ antibodies. This facile and inexpensive method for modifying absolute CD4+ lymphocytes counts from whole blood could impact HIV treatment. This method was proved to be more expedient and more efficient than traditional batch, off-chip methods. Future efforts will be made to design a plugand- play read-out device, which has a built-in detection system, and would further save critical time. The demonstrated device efficiency is similar or better than those reported elsewhere for microfluidic-based systems [10,23]. We did not segregate the T lymphocytes collected from whole blood by sub-types to get a ratio metric measurement of T-lymphocyte sub-types, as reported by other groups and would likely be more challenging but could be done using a multiplexed magnetic bead assay [4,15]. Another recent report by Briggs et al. explored the linearity and reproducibility of the measurements [10]. Even with the slightly lower capture efficiencies at the lower starting cell concentrations, our method had comparable capture efficiencies when using whole blood from human subjects when compared to the traditional method at all starting cell densities explored. Our microfluidic-based method has the advantage of not requiring significant pre-treatment of whole blood samples before analysis when compared to FACS. While it is important to have accurate reporting of the data, we do not feel it is critical significance of this method is to aid in monitoring changes in the absolute CD4+ T lymphocyte counts over time especially after the initiation of anti-retroviral medications. The important factor is monitoring the progression of the disease to give insights to the attending physician as to how to modify the patient’s treatment regimen. In this way, our method offers significant time reductions over the standard off-chip method. Further studies using this device will try to establish the minimum working concentration and maximum working concentration, as the critical information to know in the treatment of HIV is whether or not the patient has passed an arbitrary threshold. The limitation on our current device will be with the limited dynamic range of the flow rates used. However, if we optimize the device to give readings in a limited region to see if we are below a well established threshold then it may not be important to have a larger dynamic range. While we still see this as a potential limitation of the device, the goal of the device is to offer diagnostic information in a clinically relevant region, as it relates to HIV. We know that if the CD4+ levels are too high,the patient is declared not immune deficient and if CD4+ levels are abnormally low then the patient is in need of critical care. The precise values are less important for assessing treatment options in resource limited settings. For this reason, we believe similar flow devices may be well-suited to impact HIV treatment and monitoring. Future studies will focus on automating our separation assay to more closely resemble a FACS system.Acknowledgements
I would like to thank Dr. Krishna Krishnan chairman of the Industrial and Manufacturing Engineering Department at Wichita State University and Dr. T.S. Ravi Professor of Mechanical Engineering at Wichita State University for their helpful suggestions and inputs to this paper.References
- Pandey A, Sahu D, Bakkali T, Reddy D, Venkatesh S, et al. (2012) Estimate of HIV prevalence and number of people living with HIV in India 2008-2009. BMJ Open 2. pii: e000926.
- Kerkhoff AD, Gupta A, Samandari T, Lawn SD (2013) The proportions of people living with HIV in low and middle-income countries who test tuberculin skin test positive using either a greater or equal to 5 mm or a greater or equal to 10 mm cut-off: a systematic review. BMC Infect Dis 13: 307.
- Tsarenko Y, Polonsky MJ (2011) 'You can spend your life dying or you can spend your life living': identity transition in people who are HIV-positive. Psychol Health 26: 465-483.
- Wang Z, Chin SY, Chin CD, Sarik J, Harper M, et al. (2010) Microfluidic CD4+ T-cell counting device using chemiluminescence-based detection. Anal Chem 82: 36-40.
- Cheng X, Gupta A, Chen C, Tompkins RG, Rodriguez W, et al. (2009) Enhancing the performance of a point-of-care CD4+ T-cell counting microchip through monocyte depletion for HIV/AIDS diagnostics. Lab Chip 9: 1357-1364.
- Cheng X, Irimia D, Dixon M, Ziperstein JC, Demirci U, et al. (2007) A microchip approach for practical label-free CD4+ T-cell counting of HIV-infected subjects in resource-poor settings. J Acquir Immune Defic Syndr 45: 257-261.
- Cheng X, Irimia D, Dixon M, Sekine K, Demirci U, et al. (2007) A microfluidic device for practical label-free CD4(+) T cell counting of HIV-infected subjects. Lab Chip 7: 170-178.
- Dieye TN, Vereecken C, Diallo AA, Ondoa P, Diaw PA, et al. (2005) Absolute CD4 T-cell counting in resource-poor settings: direct volumetric measurements versus bead-based clinical flow cytometry instruments. J Acquir Immune Defic Syndr 39: 32-37.
- Janossy G (2004) Dried blood spot technology for CD4+ T-cell counting. Lancet 363: 1074; author reply 1074-1075.
- Janossy G, Jani IV, Bradley NJ, Bikoue A, Pitfield T, et al. (2002) Affordable CD4(+)-T-cell counting by flow cytometry: CD45 gating for volumetric analysis. Clin Diagn Lab Immunol 9: 1085-1094.
- Janossy G, Jani IV, Kahan M, Barnett D, Mandy F, et al. (2002) Precise CD4 T-cell counting using red diode laser excitation: for richer, for poorer. Cytometry 50: 78-85.
- Collazos J, Knobel H, Casado JL, Grupo Espanol para el Estudio Multifactorial de la Adherencia (GEEMA) (2006) CD4 count and viral load time-courses in patients treated with highly active antiretroviral therapy and association with the CDC staging system. HIV Med 7: 504-513.
- Vajpayee M, Kaushik S, Sreenivas V, Wig N, Seth P (2005) CDC staging based on absolute CD4 count and CD4 percentage in an HIV-1-infected Indian population: treatment implications. Clin Exp Immunol 141: 485-490.
- Baecher-Allan CM, Hafler DA (2005) Functional analysis of highly defined, FACS-isolated populations of human regulatory CD4+ CD25+ T cells. Clin Immunol 117: 192.
- Baecher-Allan C, Wolf E, Hafler DA (2005) Functional analysis of highly defined, FACS-isolated populations of human regulatory CD4+ CD25+ T cells. Clin Immunol 115: 10-18.
- Oselin K, Mrozikiewicz PM, Pahkla R, Roots I (2003) Quantitative determination of the human MRP1 and MRP2 mRNA expression in FACS-sorted peripheral blood CD4+, CD8+, CD19+, and CD56+ cells. Eur J Haematol 71: 119-123.
- Stoeck M, Miescher S, Qiao L, Capasso P, Barras C, et al. (1990) Stimulation of FACS-analysed CD4+ and CD8+ human tumour-infiltrating lymphocytes with ionomycin + phorbol-12,13-dibutyrate does not overcome their proliferative deficit. Clin Exp Immunol 79: 105-108.
- Thorslund S, Larsson R, Bergquist J, Nikolajeff F, Sanchez J (2008) A PDMS-based disposable microfluidic sensor for CD4+ lymphocyte counting. Biomed Microdevices 10: 851-857.
- Gao D, Li HF, Guo GS, Lin JM (2010) Magnetic bead based immunoassay for enumeration of CD4+ T lymphocytes on a microfluidic device. Talanta 82: 528-533.
- Truett AA, Letizia A, Malyangu E, Sinyangwe F, Morales BN, et al. (2006) Efficacy of Cyto-Chex blood preservative for delayed manual CD4 testing using Dynal T4 Quant CD4 test among HIV-infected persons in Zambia. J Acquir Immune Defic Syndr 41: 168-174.