
Journal of Addiction & Prevention
Download PDF
Review Article
*Address for Correspondence: Peter Gates, Ph.D., National Cannabis Prevention and Information Centre, University of New South Wales, PO Box 684, Randwick NSW, 2031, Australia, Tel: + 61 2 9385 0269; Fax: + 61 2 6773 0201; E-mail:p.gates@unsw.edu.au
Citation: Gates P, Grove R, Copeland J. Impact of substance use on the Australian workforce. J Addiction Prevention. 2013;1(2): 6.
Copyright © 2013 Gates P, et al. This is an open access article distributed under the Creative Commons Attribution License, which permits unrestricted use, distribution, and reproduction in any medium, provided the original work is properly cited.
Journal of Addiction & Prevention |ISSN: 2330-2178 | Volume: 1, Issue: 2
Submission: 28 August 2013 | Accepted: 25 September 2013 | Published: 28 September 2013
Alcohol-related workplace absenteeism was reported by 2.9% and 2.6% of those who reported recent alcohol consumption in 2007 and 2010 and by 2.6% and 2.3% of the total workforce. This decrease over time was reflected most strongly by the professional and technical service industry and those in professional occupations. In 2007, the energy and water industry and those in trades’ people occupations reported the highest prevalence of alcohol-related absenteeism, although this did not meet statistical significance. In contrast, the lowest levels of alcohol-related absenteeism were reported by the health care and education and training industries. In 2010, the hospitality and energy and water industries and those in skilled occupations reported the highest prevalence (significantly greater than average for the hospitality industry among recent users). In contrast, those in agriculture, education and training, and professional and technical service industries and those in professional occupations each reported lower than average alcohol-related absenteeism although this difference was only statistically significant for the education and training industry among recent alcohol users.
Impact of substance use on the Australian workforce
Peter Gates1*, Rachel Grove2 and Jan Copeland1
- 1National Cannabis Prevention and Information Centre, UNSW Medicine, Australia
- 2National Drug and Alcohol Research Centre, UNSW Medicine, Australia
*Address for Correspondence: Peter Gates, Ph.D., National Cannabis Prevention and Information Centre, University of New South Wales, PO Box 684, Randwick NSW, 2031, Australia, Tel: + 61 2 9385 0269; Fax: + 61 2 6773 0201; E-mail:p.gates@unsw.edu.au
Citation: Gates P, Grove R, Copeland J. Impact of substance use on the Australian workforce. J Addiction Prevention. 2013;1(2): 6.
Copyright © 2013 Gates P, et al. This is an open access article distributed under the Creative Commons Attribution License, which permits unrestricted use, distribution, and reproduction in any medium, provided the original work is properly cited.
Journal of Addiction & Prevention |ISSN: 2330-2178 | Volume: 1, Issue: 2
Submission: 28 August 2013 | Accepted: 25 September 2013 | Published: 28 September 2013
Abstract
Objective: To determine the prevalence of substance use and related problems in the Australian workplace.Methods: We investigated two waves of data from a large nationally representative survey including descriptive and weighted comparative analyses. Measurements included workplace substance use, working under the influence of a substance in the past year, past 90 day substance-related absenteeism and past year workplace abuse.
Results: Despite overall increases in substance use at a population level, workplace problems relating to substance use either remained stable across 2007 and 2010 (drug-related absenteeism [0.5%], alcohol related absenteeism [just over 2%], going to work under the influence of alcohol or an illicit drug [approximately 6% and 5%, respectively]) or reduced (reports of workplace abuse [3.6% reduced to 2.2%; p< 0.001]. Workplace substance use problems were elevated among those in the hospitality and construction industries. In contrast, those in education and training, agriculture industries and in managerial and professional occupations were at lesser risk of many workplace problems.
Conclusions and implications: Workplace substance problems are not uniform across sectors. Public health initiatives targeting workplace substance-related problems will be improved by narrowing the target by worker industry and occupation.
Keywords
Workforce; Workplace; Employee; Alcohol; Drugs; Intoxication; Abuse; AbsenteeismIntroduction
Employee substance use may incur substantial costs to society and employers through decreased workplace productivity as well as increased employee turnover, absenteeism and worker stress [1-8]. The annual cost of reduced workplace productivity associated with alcohol and illicit drug use in Australia was estimated at approximately $5 billion in 2004 [6]. In addition to financial costs, substance use may increase the risk of occupational injury, or offsite injury leading to time off work, particularly in industries which may involve a greater frequency and severity of accidents such as the construction and mining industries [9]. Similarly, it has been shown that workplace alcohol use (defined as use during work or within two hours after, or prior to, work) is associated with an increased risk of workplace injury [1]. This risk of injury, however, may be partially explained by other problem workplace behaviours which are more frequently observed among workplace substance users compared with non-users, such as deviance, unprofessionalism and dishonesty [9,10].The ability of Australian workplaces to make an informed response to workplace drug use is impeded by a lack of information on workplace substance use which itself is unevenly manifest across different industries and social and demographic factors [11-14]. In a recent account of the influence of these characteristics, Pidd and colleagues [15] reported on data from the 2007 National Drug Strategy Household Survey (NDSHS; excluding data obtained by phone interview). Those authors found that workplace problems such as using drugs at work were particularly prevalent within the hospitality, construction and financial industries and among unskilled workers (such as labourers or sales persons) and trades. Workplace substance use was most common among young males without a university level education [15]. In contrast, alcohol use was most prevalent among individuals in professional and managerial occupations. Similar findings regarding increased substance use among males and those in construction and extraction and food preparation occupations have been reported in the US [16,17].
This pattern of important findings has not been replicated using the most recent 2010 NDSHS. As such, the impact of recent changes affecting workplace drug use, such as likely increases to the frequency of workplace drug testing (typically urine testing is implemented among subsets of existing employees, selected at randomised times to identify illicit drug use with the aim of improving worker productivity and/or safety) [18,19] and broader community drug prevention (including the introduction of workplace policies on drug use and broadly accessible prevention programs such as computer based programmes), remain unknown. The present paper addresses this gap by examining substance use related workplace problems in Australia using two waves of NDSHS data from 2007 and 2010. The aim of this investigation was to detail workplace problems (including absenteeism, going to work under the influence of a substance and workplace abuse) by industry and occupation and to identify any statistically significant changes in the prevalence of workplace problems over time.
Methods
DesignThe NDSHS [20,21] is a nationwide survey of individuals aged 12 years and older and collects information on drug use patterns, attitudes and behaviours. The survey has been conducted every two to three years since 1985 as part of the then National Campaign against Drug Abuse, with 2007 and 2010 being the ninth and tenth survey waves. Households were selected via a multistage, stratified area random sample design across all states and territories. The 2007 survey used two data collection modes; data that was collected in person following self-completion as well as data from computera-ssisted telephone interview (CATI). A total of 19,818 respondents were collected via drop and collect methods, while 3538 respondents completed CATI (for a total sample of 23,356 with a response rate of 49.3%). The CATI component of the survey methodology was dropped in 2010, with a total sample of 26,648 collected via drop and collect methods (response rate 46%). Although these response rates are relatively low, the survey is weighted in order to remain representative of the general Australian population. Further detail on survey methods can be found elsewhere [21].
Measures
Participants were asked several questions regarding work-related problems that were relevant to the present study. First, how many days in the past 90 days they had been absent from work due to their use of alcohol or illicit drugs. Second, whether or not the participant had attended work under the influence of alcohol or illicit drugs at least once in the previous 12 months before interview. Third, whether or not any person affected by alcohol or illicit drugs had recently verbally or physically abused them or placed them in fear, and if so, whether any of these incident(s) occurred in the participants’ workplace. These questions were identical across surveys with the exception of slight wording changes such as the addition of “or affected by” in the 2010 survey to the questions regarding being “under the influence of” a substance.
Workforce variables were defined for the total sample of individuals aged 14 years and over. Individuals were classified to be in the workforce (‘employed’) if they reported being in paid work at the time of survey (full-time, part-time or self-employed). The workforce was broken down further by industry and occupation. The industry breakdown was done in accordance with the Australian and New Zealand Standard Industrial Classification (ANZSIC) codes compiled by the Australian Bureau of Statistics [ABS;22]. For the 2007 survey, the occupation break down was done in accordance with the Australian Standard Classification of Occupations (ASCO) compiled by the ABS. This breakdown was updated for the 2010 survey which used the Australian and New Zealand Standard Classification of Occupations [ANZSCO;23]. Both classification systems were used to group the participants into one of five occupations – managers, professionals, trades workers, skilled workers and unskilled workers. In 2007, ‘skilled workers’ were defined as individuals working as intermediate and advanced clerical or service occupations, or intermediate production and transport occupations. In 2010, ‘skilled workers’ included those in all community and personal service occupations, clerical and administrative occupations, and machinery operator and driver occupations. In 2007, ‘unskilled workers’ were defined as those working in elementary clerical, sales and service worker occupations, or as labourers and related workers. In 2010, ‘unskilled workers’ were defined as all those in sales or labourer occupations.
Statistical analysis
The sample was weighted to account for the multistage sampling process utilised in the survey and to match the age and sex distribution of the Australian population. The 2007 and 2010 NDSHS data sets were merged in order for comparisons to be assessed (including CATI data). Strata, sample weights and clusters were matched across the two data sets in order to allow for comparisons that matched the age and sex distribution of the Australian population for each year. All cases which were reported to be ‘unanswered’, ‘not asked’ or ‘invalid’ were treated as missing and all missing variables were included in the analyses. Weighted percentages and chi-squared analyses were computed to assess work problems across employment status (industry and occupation compared to total workforce) and to assess change over time (2007 data compared to 2010 data). To control for the large number of comparisons an alpha level of α< 0.01 was considered to be statistically significant.
Results
Sample populationIn 2007, a total of 22,912 individuals aged 14 years or older completed the NDSHS (98.1% of the total sample). From this subsample, 11,789 individuals were employed (51.5% of the subsample; 56.5% male and 43.5% female), 10,362 were not in the workforce (39.8% male and 60.2% female) and 761 were recorded as missing. In 2010, a total of 26,157 individuals aged 14 years or older completed the NDSHS (98.2% of the total sample). From this subsample, a total of 13,590 individuals were employed (52.0% of the subsample; 56.2% male and 43.8% female), 11,467 were not in the workforce (40.5% male and 59.5% female) and 1,100 were recorded as missing.
Work-related problems within industry and occupation
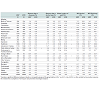
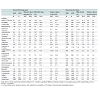
A summary of results relating to work-related problems by industry and occupation is provided in Table 1 (including the total workforce – that is, all employed individuals) and Table 2 (including employed individuals who reported recent substance use– that is, use within the past year). In 2007, 2.7% of recent illicit drug users reported at least one occasion of substance-related absenteeism. This figure reduced (non-significantly) to 2.2% in 2010. Corresponding figures among the total workforce were 0.5% in 2007 and 2010. Considering the total workforce, this kind of absenteeism was not reported by the wholesale trade and energy and water industries while the education and training industries reported a significantly lower than average prevalence. A marked, but non-significant, increase in this kind of absenteeism was noted among those in manufacturing industries (among users) and hospitality industries (among total workforce).
Table 1: Work-related problems (among total sample) reported by industry and occupation.
Table 2: Work-related problems (among users) reported by industry and occupation.
Substance-related abuse in the workplace (SRAW; that is, employees reporting being the victim of abuse in their workplace which is perpetrated by an individual affected by substance use) was reported by 3.6% and 1.6% of those who reported recent illicit drug use in 2007 and 2010 and by 3.6% and 2.2% of the total workforce. This represented a significant decrease over time in the prevalence of SRAW among the total workforce (p< 0.001). This decrease was reflected most strongly by those in healthcare and public administration and safety industries and those in professional occupations. SRAW was consistently reported by a significantly greater than average proportion of those in the healthcare and public administration and safety industries and by those in professional occupations between surveys. In 2007, among the total workforce, SRAW was reported by almost one in ten of those employed in arts and recreation industries – the highest prevalence recorded.
Going to work under the influence of alcohol (WUIA) was reported by 6.1%, and 5.8% of those who reported recent alcohol consumption in 2007 and 2010 and by 5.4%, and 5.2% of the total workforce. A consistent and significantly higher than average proportion of those in the hospitality and finance and insurance industries reported WUIA in 2007 and 2010. In contrast, a consistent and significantly lower proportion of those in healthcare and education and training industries reported WUIA across surveys. Notably, those in the arts and recreation industry reported the greatest proportion of WUIA in 2007, however; this proportion decreased (non-significantly) to be no greater than that reported by the total workforce in 2010.Going to work under the influence of an illicit drug (WUID) was reported by 13.0%, and 11.5% of those who reported recent illicit drug use in 2007 and 2010 and by 1.9% and 1.9% of the total workforce, respectively. Those in the hospitality and construction industries consistently reported a significantly higher than average prevalence of WUID in 2007 and 2010. In addition, in 2010, those in the administration and transport industries reported a significantly higher than average prevalence of WUID. In contrast, a consistent and significantly lower than average proportion of those in healthcare and education and training industries reported WUID across surveys. Notably, there were no reports in the real estate industry of WUID in 2007 or 2010; however, this industry was underrepresented in these surveys. Among those who reported recent illicit drug use, a remarkable decrease in the prevalence of WUID was noted between surveys among those in the mining, energy and water, and arts and recreation industries (prevalence was reduced from approximately one in five individuals to zero) and a significant decrease was noted among those in professional occupations (p=0.005).
Discussion
The current paper examined substance-related problems in the Australian workforce using data from the 2007 and 2010 national drug strategy household surveys (NDSHS). In addition, this study was the first to provide comparisons between the 2007 and 2010 survey data with workplace problems detailed by industry and occupation.Substance-related absenteeism
At least one drug related absenteeism in the 90 days before survey completion was reported by 0.5% of individuals in the workforce in 2007 and in 2010. When assessing only those who reported recent illicit drug use, this figure increased to 2.7% in 2007 and 2.2% in 2010. The prevalence of alcohol-related absenteeism among the total workforce was similarly low and decreased from 2.6% in 2007 to 2.3% in 2010. These percentages did not vary substantially when considering only those who reported recent alcohol use (2.9% to 2.6%, respectively). As such, workplace absence due to substance use was very uncommon overall, even amongst those reporting use in the past year.
Workers reporting the highest prevalence of drug and alcohol related absenteeism were those in the hospitality, manufacturing, administration, and energy and water (alcohol-related absenteeism only) industries and those in professional occupations (with the prevalence decreasing in 2010). In contrast, alcohol-related absenteeism was less prevalent than average among those in agriculture, healthcare, education and training industries and those in managerial occupations. Notably, drug-related absenteeism was consistently not reported at all by those in the wholesale, energy and water and real estate industries. Further, no drug or alcohol related absenteeism was reported by those in the agriculture industries in 2010.
The consistently low prevalence of substance-related absenteeism among recent users was unexpected. These results suggest that illicit substance use was not associated with an overall greater risk of related absenteeism compared to alcohol use across industries and occupations. In addition, alcohol use and illicit drug use amongst the workforce does not typically impact on a worker’s perceived ability to work (as measured by absenteeism). Importantly, however, even with a low prevalence, the costs to society incurred due to absenteeism for alcohol related absenteeism alone reach over 400 million Australian dollars [24].
Workplace abuse
In 2007 and in 2010, a total of 3.6% and 2.2% of individuals in the workforce reported being the victim of workplace abuse (referring to verbal or physical abuse or being placed in fear) perpetrated by a substance-affected individual. This represented a significant decrease over time. Workplace abuse among only those who reported recentillicit drug use also decreased over time, although this difference did not reach significance (3.6% to 1.6%). This finding was in contrast to research suggesting an association between substance use and both the perpetration and being a victim of verbal and physical workplace aggression [25].
Upon further inspection this decrease was seen to be reflected most strongly by the healthcare, public administration and safety industries and among those in professional occupations. Despite an overall decrease, the healthcare, public administration and safety industries and professional occupations each consistently reported a significantly greater than average prevalence of workplace abuse in 2007 and 2010. Further, the prevalence of workplace abuse notably increased in the construction and arts and recreation industries.
As such, no clear pattern between illicit drug use and the prevalence of workplace abuse was found. It should be noted, however, that the included measure of workplace abuse was not designed to reflect the identity of the perpetrator (for example whether they were a co-worker or client). It does appear; however, that abuse perpetrated from an employee’s client may be more common than from a colleague. This is consistent with the greater prevalence of workplace abuse among those in the hospitality and other public health occupations with a strong client focus and the lower prevalence among those in trades or construction where client interaction is minimal. Unfortunately the impact of workplace abuse on worker health and productivity were out of the scope of this study and requires additional research.
Going to work under the influence of a substance
In 2010, just over one in twenty individuals reported going to work under the influence of alcohol within the 12 months prior to survey (WUIA; 5.8% of those reporting past-year alcohol use and 5.2% of the total workforce). In comparison, just over one in ten of those who reported recent use of an illicit drug reported going to work under the influence of an illicit drug (WUID; 11.5%). This was in stark contrast to the much lower prevalence of WUID among the total workforce (1.9%). These findings support the literature which highlights that the prevalence of substance use by those in the workforce should not be considered as an indicator of substance use in the workplace [26]. In addition, these findings were in line with the results presented by Pidd and others [15] who found that among the total workforce, attending work under the influence of alcohol was more prevalent than attending under the influence of an illicit drug.
Importantly, the results showed that the propensity toward working under the influence of a substance was approximately twice as great among recent illicit drug users compared to recent alcohol drinkers. As such, any recent drug use by an employee may be predictive of attending work under the influence of a substance and thus be of interest to an employer in ensuring a safe workplace. The role of workplace drug testing which is effective in identifying any recent use is supported in this regard as are workplace health promotion policies which introduce zero tolerance regimes.
With the exception of an increase in WUID prevalence in the agriculture industry and decrease in the professional and trade occupations, the prevalence of WUIA and WUID were stable over time among illicit drug users. Notably, the hospitality and construction industries and unskilled occupations reported a greater than average prevalence of WUIA and WUID in 2007 and 2010. In addition, the finance and insurance and arts and recreation industries reported an elevated prevalence of WUIA but not WUID. In contrast, the healthcare and education and training industries and professional occupations remained less likely to report WUIA and WUID.
Finally, a marked reduction in WUID across surveys was noted in the mining, energy and water, and arts and recreation industries and professional occupations and trades. Among other factors, this reduction could reflect the introduction of workplace drug testing which is now more prevalent among some of these sectors [18,19]. Unfortunately detailing the extent to which workplace drug testing impacts the prevalence of workplace drug use was out of the scope of this study and is yet to be reviewed among Australian workplaces. Indeed, existing reviews of research on workplace drug testing show overall weak evidence for the improvement of worker productivity or safety following the implementation of urine testing programs [27]. Other factors that could potentially explain these reductions include introduced workplace policies, counselling and employee assistance programs, web-based interventions as well as increased awareness of substance use harms [28].
Limitations
There were a number of limitations within the current study methodology. Firstly, only those residing in residential dwellings were contacted to complete the NDSHS survey, thus individuals who are homeless, incarcerated or institutionalised were excluded. This is likely to limit national estimates of substance use. Secondly, the accuracy of the data was limited by the respondents own self-reported awareness of what problems were related to their own substance use. Moreover, the frequency of these stated problems was not assessed in this survey. Thirdly, the comparison of the two surveys needs to be interpreted with caution due to the differences in collection methods employed in 2007 and 2010 – particularly in regards to the classification of skilled and unskilled occupations and the use of CATI data collection in 2007 only. However, weighting and sampling characteristics have been accounted for in all analyses. Finally, due to the limited sample size as a result of assessing only those who reported an illicit drug in a particular industry, the power of analyses was reduced in some cases. This was especially the case among those in the energy and water, real estate, and arts and recreation industries.Implications and Conclusions
Among the total workforce, work problems relating to substance use largely remained stable (drug or alcohol-related absence, going to work under the influence of alcohol or an illicit drug) with the exception of workplace abuse which reduced significantly. This finding suggests that responses to substance use in the workforce and/ or general public health interventions may be having a positive effect. An additional theory could be that, although more individuals were reporting recent cannabis and other illicit drug use in 2010 compared to 2007 [20], this use was of less quantity or frequency. This theory assumes a link between the frequency or quantity of substance use and differences in workplace problems. To our knowledge this has yet to be a focus of research. An additional theory is that, in 2007 individuals were more likely to report substance-related workplace problems compared with 2010 as a result of greater workplace stress. Given the effects of the global financial crisis in 2008 and onwards fear of unemployment and related negative employment outcomes [5], the likelihood of reporting problems of less central concern may have reduced.Workplace substance use incurs substantial costs to society and employers through increased absenteeism and decreased productivity [1-6]. Importantly, the prevalence of substance related workplace problems was not seen to increase despite increases in substance use at a population level [21]. However, this finding needs to be considered in the context of the worker’s age, gender, industry and occupation. For example, substance use is known to be elevated among young males while older females report much lower use [21]. Similarly, those in the hospitality and construction industries reported an increased pattern of workplace problems. In contrast, those in education and training and agriculture industries were at less risk of workplace substance use problems. Finally, although those in healthcare industries or professional occupations reported relatively few substance-related workplace problems, these employees were at particular risk of workplace substance-related abuse most likely perpetrated by their clients. As such, future funders of public health initiatives targeting workplace problems relating to substance use should be aware that outcomes continue to be improved by narrowing the target by worker industry and occupation. In addition, these initiatives will be further strengthened by accounting for the impact of substance using clientele accessing these industries and occupation groups.
References
- Ames GM, Grube JW, Moore RS (1997) The relationship of drinking and hangovers to workplace problems: An empirical study. J Stud Alcohol 58: 37-47.
- DeSimone J (2002) Illegal drug use and employment. Journal of Labor Economics 20: 952-977.
- Frone MR. Alcohol, drugs, and workplace safety outcomes: A view from a general model of employee substance use and productivity. In: J B, MR F, editors (2004) The psychology of workplace safety. Washington, DC: American Psychological Association; 127-156.
- Harris MM. Alcohol and drug use in the workplace. In: Griffin RW, O’Leary- Kelly A, editors (2004) The dark side of organizational behavior New York: Pfeiffer: 341-372.
- Acharya V, Philippon T, Richardson M, Roubini N (2009) The Financial Crisis of 2007-2009: Causes and Remedies. Financial Markets, Institutions & Instruments 18: 89-137.
- Collins DJ, Lapsley HM (2008) The costs of tobacco, alcohol and illicit drug abuse to Australian society in 2004/05. Canberra: Commonwealth of Australia.
- Hagen R, Egan D, Eltringham A (1992) Work, Drugs and Alcohol: Occupational Health and Safety Inquiry into Alcohol, Drugs and the Workplace. Melbourne: Victorian Occupational Health and Safety Commission.
- Marchand A, Blanc M-E (2011) Occupation, work organization conditions, and alcohol misuse in Canada: An 8-year longitudinal study. Substance Use & Misuse 46: 1003-1014.
- Ramchand R, Pomeroy A, Arkes J (2009) The effects of substance use on workplace injuries. Santa Monica, CA: Rand Corporation.
- Spicer RS, Miller TR, Smith GS (2003) Worker substance use, workplace problems and the risk of occupational injury: a matched case-control study. J Stud Alcohol 64: 570-578.
- Allsop S, Pidd K. The nature of drug-related harm in the workplace. In: Allsop S, Phillips M, Calogero C, editors (2001) Drugs and work: Responding to alcohol and other drug problems in Australian workplaces. Melbourne: IP Communications Pty Ltd.
- Alcohol and Other Drugs Council of Australia (2008) Workplace alcohol & drug use needs attention.
- Allsop S, Phillips M, Calogero C (2001) Responding to alcohol and other drug related problems in the workplace Melbourne: IP Communications.
- Knudsen HK, Johnson JA, Roman PM (2004) The management of workplace deviance: Organizational responses to employee drug use. J Drug Issues 34: 121-143.
- Pidd K, Roche AM, Buisman-Pijlman F (2011) Intoxicated workers: Findings from a national Australian survey. Addiction 106:1623–1633.
- Frone MR (2006) Prevalence and Distribution of Alcohol Use and Impairment in the Workplace: A U.S. National Survey. J Stud Alcohol 67: 147-156.
- Frone MR (2006) Prevalence and distribution of illicit drug use in the workforce and in the workplace: Findings and implications from a U.S. national survey. J Appl Psychol 91: 856-869.
- Australian Drug Foundation. Workplace drug testing. Policy Talk 2012.
- Heiler K (2003) Drugs and alcohol management and testing standards in Australian workplaces: Avoiding that “morning-after” feeling. Working Paper No. 81. Sydney: Australian Centre for Industrial Relations Research andTraining.
- Australian Institute of Health and Welfare (2008) 2007 National Drug Strategy Household Survey: Detailed findings Canberra: Department of Health and Ageing: Drug Statistics Series No. 22, AIHW Category No. PHE 107.
- Australian Institute of Health and Welfare (2011). 2010 National Drug Strategy Household Survey Report. Canberra: Department of Health and Ageing: Drug statistics series No. 25. Category No. PHE 145.
- Australian Bureau of Statistics (1998) 129.0 - A guide to major ABS classifications 1998.
- Australian Bureau of Statistics (2009) 1220.0 - ANZSCO - Australian and New Zealand Standard Classification of Occupations, First Edition, Revision 1.
- Pidd KJ, Berry JG, Roche AM, Harrison JE (2006) Estimating the cost of alcohol-related absenteeism in the Australian workforce: The importance of consumption patterns. Med J Aust 185: 637-641.
- McFarlin SK, Fals-Stewart W, Major DA, Justice EM (2001) Alcohol use and workplace aggression: An examination of perpetration and victimization. J Subst Abuse 13: 303-321.
- Frone MR (2013) Alcohol and illicit drug use in the workforce and workplace. Washington, DC: American Psychological Association.
- Pidd K, Berry JG, Harrison JE, Roche AM, Driscoll TR, et al. (2006) Alcohol and work: Patterns of use, workplace culture and safety. Adelaide: AIHW.
- (2012) VicHealth Reducing alcohol-related harm in the workplace (An evidence review: summary report). Melbourne, Australia: Victorian Health Promotion Foundation.