
Journal of Analytical & Molecular Techniques
Download PDF
Research Article
*Address for Correspondence: Preston R. Arnold, Department of Biology, Brigham Young University,4102 LSB, Provo, UT 84602, USA, E-mail: preston.arnold02@gmail.com
Citation: Arnold PR, Lord NP, Smith AN, Bybee SM. The Effects of Non-Ideal Temperature Regimes on RNA Quality from Samples Stored in RNAlater-like Buffer: An Attempt to Replicate Field Conditions. J Analyt Molecul Tech 2016;2(1): 8.
Copyright © Arnold PR, et al. This is an open access article distributed under the Creative Commons Attribution License, which permits unrestricted use,distribution, and reproduction in any medium, provided the original work is properly cited.
Journal of Analytical & Molecular Techniques |ISSN: 2474-1914 | Volume: 2, Issue: 1
Submission: 15 March, 2016| Accepted: 06 May, 2016 | Published: 11 May, 2016
 RNA extraction
 To provide an empirical metric of RNA quality, a total rRNA ratio - the ratio of RNA contained under the 5S (when observable), 18S, and 28S (when observable) rRNA peaks compared to total RNA - was recorded. This ratio was shown by Schroeder et al. to be the most informative metric of RNA quality and is therefore the strongest predictor of RIN score [3]. Generally, samples with a total rRNA ratio exceeding 0.35 received a RIN score equal to or greater than 7.5 in non-insect samples [3]. Insect samples of comparable quality to noninsect samples as determined by rRNA ratio would be expected to give RIN numbers lower than 7.5 due to the nature of insect rRNA (see above). Consequently, we considered samples from our study with a total rRNA ratio equal to or exceeding 0.35 to be suitable for NGS assays, while samples with scores below this value were deemed unsuitable for such assays.
 RNA quality
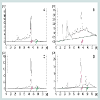
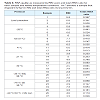 In contrast, specimens stored at 30 °C for 21 days yielded low quality, poorly-preserved RNA with large amounts of degradation visible in the electropherograms. The double peak representing the 18S and 28S bands was still present in these samples, however it was markedly reduced compared to well-preserved samples and only the 18S band was faintly detectable on electrophoretic gel (Figures 3 and 4). The average RIN score for 30 °C samples was 2.6 and the average total rRNA ratio was 0.060. Samples subjected to an initial freezing for either one or seven days before being stored at 30 °C for the remainder of the study were similarly degraded and nearly indistinguishable by electropherogram, total rRNA ratio, or gel electrophoresis results from samples left at 30 °C for the entirety of the study (Figures 3 and 4). Average RIN scores for samples initially frozen for one or seven days were 2.7 and 2.9, respectively. Average total rRNA ratios were 0.086 for samples frozen for one day and 0.08 for samples frozen for seven days. RIN scores and total rRNA ratios for each sample are given in Table 3.
 Specimens stored at room temperature showed some degradation visible in the electropherogram but also exhibited a distinct double peak indicating that the 18S and 28S subunits were largely intact (Figure 3). The 18S and 28S bands were also discernible on an electrophoretic gel, but they were not as apparent as those seen with highly preserved samples. The 5S band was not visible in gels from these samples (Figure 4). Room temperature samples returned the most variation in RIN scores with an average of 4.5. Total rRNA ratio for these samples averaged 0.245. While comparable in electropherogram appearance to temperature-oscillated samples, the RIN scores, total rRNA ratios, and appearance on an electrophoretic gel of room temperature samples suggest higher RNA quality than temperature-oscillated samples.
The Effects of Non-Ideal Temperature Regimes on RNA Quality from Samples Stored in RNAlater-like Buffer: An Attempt to Replicate Field Conditions
Preston R. Arnold*, Nathan P. Lord, Ashlee N. Smith and Seth M. Bybee
- Department of Biology, Brigham Young University, 4102 LSB, Provo, UT 84602, USA
*Address for Correspondence: Preston R. Arnold, Department of Biology, Brigham Young University,4102 LSB, Provo, UT 84602, USA, E-mail: preston.arnold02@gmail.com
Citation: Arnold PR, Lord NP, Smith AN, Bybee SM. The Effects of Non-Ideal Temperature Regimes on RNA Quality from Samples Stored in RNAlater-like Buffer: An Attempt to Replicate Field Conditions. J Analyt Molecul Tech 2016;2(1): 8.
Copyright © Arnold PR, et al. This is an open access article distributed under the Creative Commons Attribution License, which permits unrestricted use,distribution, and reproduction in any medium, provided the original work is properly cited.
Journal of Analytical & Molecular Techniques |ISSN: 2474-1914 | Volume: 2, Issue: 1
Submission: 15 March, 2016| Accepted: 06 May, 2016 | Published: 11 May, 2016
Abstract
Advances in sequencing technologies have increased the utility of RNA to many fields of biology. Ideal preservation of RNA in tissues is accomplished by flash freezing and subsequent storage at -80 °C. Buffers such as RNAlater® are commonly used to preserve RNA samples when flash freezing is not possible. RNAlater® performs optimally at subfreezing temperatures, but is also suitable for short periods at room temperature (21 °C). The effectiveness of RNAlater® when samples are stored above room temperature has not been tested. Samples collected outside of the lab are often subjected to temperatures that can exceed room temperature and fluctuate over time. Insect tissues were submerged in RNAlater-like buffer, a noncommercial RNA preservation buffer similar to commercial RNAlater, under various temperature regimes for 21 days. Tests were designed to mimic condition for tissues collected in the field and included constant temperatures of -20 °C, 0 °C, 4 °C, 21 °C, 30 °C, and temperatures that oscillated between -20 °C and 30 °C among others. RNA quality and degradation were determined by electropherograms and electrophoretic gels. Samples yielded high-quality RNA when stored in frozen (-20 °C) or cool (0 °C or 4 °C) conditions, although slightly higher RNA quality was recovered from samples stored in the 0-4 °C temperature range. RNA from samples stored at 21 °C or at oscillating temperatures of -20 °C and 30 °C were of lower quality and were unacceptable for most next-generation sequencing assays. Room temperature appears to be the critical temperature threshold above which RNA in tissues degrades rapidly. Freeze/thaw cycling was shown to mildly improve RNA quality compared to samples stored at a constant 30 °C.Keywords
RNA quantity; RNA degradation; Insect rRNA; NAP bufferAbbreviations
NGS: Next Generation Sequencing; RIN: RNA Integrity NumberIntroduction
The advent of next-generation sequencing (NGS) technologies has allowed access to the wealth of information available from RNA, providing insights into cellular function in the forms of transcriptomes, small RNAs, and gene expression levels. Accordingly,studies utilizing RNA have proliferated in many fields including microbiology, medicine, and molecular ecology [1]. RNA is inherently unstable, however, due to pervasive ribonucleases (RNases) which degrade RNA, limiting the utility of biological tissue for RNA work unless proper preservation protocols are observed [2]. Thus, researchers should determine if the RNA quality from their samples is appropriate for the desired assay and results before performing NGS assays. This is often achieved by running RNA samples on a capillary electrophoresis assay to show degradation and separate the RNA into its constituent 5S, 18S, and 28S bands. The RNA Integrity Number (RIN), a metric to objectively define RNA quality, can be calculated for each sample based on the area of these bands and degradation levels [3]. RIN scores range from 1.0 (completely degraded) to 10.0 (fully intact), and scores above 7.5 are considered acceptable for most NGS assays [4-6].RNA is ideally preserved in biological tissue by flash freezing samples in liquid nitrogen before long-term storage at -80 °C or colder. However, liquid nitrogen is not always available or practical outside of laboratory settings. Various reagents and methods are available for RNA preservation outside of these ideal conditions, among which the buffer RNAlater® (Thermo Fisher Scientific) has proven to be safe, effective, and easy to use [7]. According to manufacturer documentation, tissues preserved in RNAlater® will yield high-quality RNA after storage at room temperature (21 °C) for up to one week, or for up to one month if refrigerated (4 °C). Tissues stored in RNAlater® for periods exceeding one month require sub-freezing conditions to maintain high-quality RNA. Many studies have confirmed the ability of RNAlater® to effectively preserve RNA in samples when following manufacturer protocols for tissue storage at frozen (-20 °C), refrigerated (4 °C), and room temperatures (21 °C) [8-15].
RNA degradation in samples stored in RNAlater® over a period of time typical for field biologists of most disciplines (several weeks) remains understudied [16], especially in consideration of conditions that researchers commonly experience in the field (e.g. samples kept on ice, stored in warm environments (30 °C), or subjected to fluctuating temperatures). The few studies that have assessed the quality of RNA from samples stored at room temperature for longer than two months were unable to recover RNA of adequate quality for NGS assays [8,16]. Currently, no research has examined RNA preservation of tissues in RNAlater-like buffers when subjected to temperatures exceeding room temperature. Additionally, the only study to date examining the effect of fluctuating temperatures and freeze/thaw cycles on samples stored in RNAlater® only observed RNA quantity without measuring the effects on quality [17].
The present study aims to provide a set of reference scenarios that simulate field conditions and various preservation practices. The aforementioned studies have shown temperature to be a significant driver of RNA quality in samples stored in RNAlater®. We therefore focused primarily on understudied temperature regimes commonly experienced away from a laboratory setting over a period typical of field research.
Materials and Methods
Buffer solution preparationWe prepared an RNA preservation buffer similar to the commercial RNAlater® (Thermo Fisher Scientific) and originally called nucleic acid preservation (NAP) buffer [16] in the lab (see Appendix for formula). This solution was shown to perform as well as commercial RNAlater® (Thermo Fisher Scientific) in RNA preservation as determined by RIN score [16]. For simplicity, we will refer to this non-commercial solution as RNAlater-like buffer throughout this paper, whereas the commercial solution from Thermo Fisher Scientific will be referred to as RNAlater®.
Specimen selection
We sought tissue samples that provided control over variables that might lead to discrepancies in RNA quality or quantity. Specimens of burying beetles -Nicrophorus marginatus (Fabricius) (Coleoptera: Silphidae) - were selected from laboratory-reared opulations in the Belk lab (BYU Dept. of Biology). All beetles used in this study were part of an F3 generation that originated from a parental population collected in August 2014 near Goshen, UT. Nicrophorus marginatus larvae were reared on 20 g mouse carcasses that were kept in a 23 °C temperature-controlled room on 14:10 hour light:dark cycles. Broods were checked every morning between 8:00 and 11:00, and newly enclosed beetles were removed immediately. We then determined the sex and mass for each individual. We sought to use beetles of approximately the same weight to minimize diversity between samples. To accomplish this, all female beetles weighing between 0.280 g and 0.320 g were selected for use in our study and were processed for RNA preservation (see below) within five hours of being removed from the brood chamber. This resulted in ten beetles being processed for each temperature parameter (see below). From these ten samples, the three closest in weight to 0.300 g were selected for additional processing and analysis.
RNA preservation
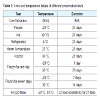
Size and thickness of tissue, as well as the presence of an exoskeleton, can have dramatic impacts on the effectiveness of RNA preservation by RNAlater® [13]. Beetles selected for the study were cut into quarters along the sagittal and transverse planes to ensure small enough tissue sizes to allow for complete permeation of the buffer solution. According to RNAlater® protocol, tissue should be suspended in 0.5 mL solution for every 0.1 g of tissue sample. Accordingly, all four sections comprising the 0.3 g beetle were immediately submerged in 1.5 mL RNAlater-like buffer solution. Although RNA work is generally performed on specific tissues rather than whole specimens, RNA extraction from entire specimens was performed to standardize tissue type and generate consistent quantities of RNA.Immediately following submersion in RNAlater-like buffer, tissues were stored under a specific temperature regime for 21 days. Temperature parameters were as follows: frozen (-20 °C), on ice (0 °C), refrigerated (4 °C), room temperature (21 °C), warm (30 °C), -20 °C for one day followed by 30 °C for 20 days, -20 °C for seven days followed by 30 °C for 14 days, and 72 hour oscillations between -20 °C and 30 °C. Tissues kept on ice were enclosed in a Styrofoam™ container (3,700 cm3) and ice was replenished every 24 hours to maintain an ice-water medium near 0 °C. One temperature regime oscillated samples between -20 °C and 30 °C every 72 hours to determine the effects of fluctuating temperature and freeze/thaw cycles on RNA quality. Samples at oscillating temperatures were moved immediately to a freezer (-20 °C) or incubator (30 °C) to minimize time spent at intermediate temperatures. Two additional temperature regimes were employed to test whether an immediate freezing of the tissues would disrupt RNase degradation activity. Tissues in these regimes were initially frozen for either one or seven days, then immediately transferred to a 30 °C incubator for the remainder of the 21 day study (20 or 14 days, respectively). Temperature parameters are summarized in Table 1.
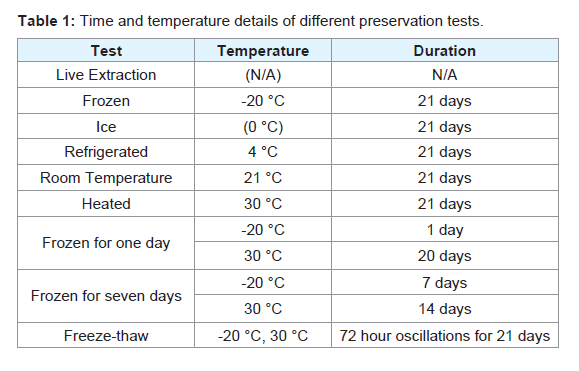
Table 1: Time and temperature details of different preservation tests.
Following the 21-day temperature storage period, three beetles from each test group were selected by weight for RNA extraction and analysis. The average weight of beetles chosen was 0.302 g (SD = 0.009 g). Additional information on the specimens used in this study is given in Table 2. All samples to be extracted were equilibrated to room temperature and then placed in 2.0 mL Tough Tubes (MoBio) with lysate buffer made from 600 μL RA1 buffer solution (NucleoSpin RNAII extraction kit, Clontech) and 6 μL β-mercapto ethanol. Entire beetles were then pulverized by vortexing on the highest setting for ten minutes with seven 2.8 mm (325 g) ceramic beads (MoBio) to create lysate. Preliminary experiments demonstrated that entire beetles provided enough organic content to prevent solutions from freely passing through filter columns. Accordingly, each 600 μL lysate was divided into three 200 μL lysates to minimize build-up. For each sample, total RNA was extracted from the three 200 μL lysates using NucleoSpin RNAII columns (Clontech) following manufacturer protocols. Finally, the three aliquots of lysate were recombined to yield complete RNA solution from each sample.
RNA quantity and purity
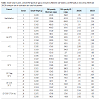
All extractions yielded an identical volume of RNA solution, thus, RNA concentration provided an appropriate and comparative metric of total RNA quantity. RNA concentration was determined using the Quant-iT RiboGreen kit (Invitrogen, Carlsbad, CA, USA) and measured on the TBS-380 mini-fluorimeter from Turner Biosystems (Sunnyvale, CA, USA) in the Brigham Young University Sequencing Center. This kit uses fluorimetry to accurately determine RNA quantity even in the presence of common nucleic acid contaminants such as proteins, urea, and ethanol [18]. Because the RiboGreen assay is accurate up to 1 ng/μL [18,19] and the majority of our samples measured over 100 ng/μL, we vortexed and diluted aliquots of our samples 1:1,000 and then ran assays according to manufacturer’s instructions. Total RNA concentration was also determined by a ND- 1000 spectrophotometer (NanoDrop, ThermoScientific, Wilmington, DE, USA). This assay uses UV spectroscopy to determine nucleotide absorption at 260 nm and is most sensitive for samples between 2.5 and 500 ng/μL [19]. Samples that initially measured more than 500 ng/μL were diluted 1:10 and re-measured to ensure accuracy.To check for contaminants, samples were analyzed using the NanoDrop spectrophotometer by comparing 260/280 and 260/230 ratios. The 260/280 ratio is commonly used to detect protein contamination, with ratios above 1.8 considered pure RNA [20]. Similarly, the 260/230 ratio is used to determine contamination of phenol and other organic compounds, and RNA is considered pure with a ratio above 1.8 [20]. Undiluted RNA concentrations, 260/280 ratios, and 260/230 ratios for each sample are given in Table 2.
Statistical analysis
To determine the effect of temperature at which samples are stored on the RNA yield, we used a generalized linear model (Proc GENMOD; SAS version 9.4, SAS Institute Inc. Cary NC). In the model, there were two response variables: RNA quantity from the TBS-380 RiboGreen assay and RNA quantity from the NanoDrop spectrophotometer, and the predictor variable was the treatment. The data did not fit the assumptions of the model, so a log transformation was used for both response variables.
RNA quality
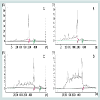
RNA quality was determined through both electrophoretic gel and the Agilent Total Eukaryote RNA 6000 Nano chip analysis. Chip analyses were conducted on an Agilent 2100 Bioanalyzer following manufacturer protocols. High-quality samples are characterized by strong 18S and 28S bands which form primary components of the RIN score [3]. Insect rRNA is unique in that the 28S rRNA subunit is made of two rRNA strands hydrogen-bonded together [21]. When heated to denature RNA secondary structure, the insect 28S subunit dissociates into two strands which co-elute with the 18S band [22], forming a sharp double peak in the 18S region. As a result, insect RNA samples run on the Agilent 2100 Bioanalyzer do not generally show a 28S peak, and the resulting RIN scores are therefore deceptively low. Running samples through the Agilent 2100 Bioanalyzer without heating reveals the presence of both the 18S and 28S bands [22], however, the persisting secondary structures lead to irregular peaks, preventing the samples from receiving an accurate RIN score (see comparison of heated vs non-heated in Figure 1). To provide consistent and comparable results for this study, samples were heated at 65 °C for two minutes before being run on the Bioanalyzer. RIN scores are reported, as they are useful in comparing against other samples within this study. However, they should not be considered representative of the values expected from non-insect samples.
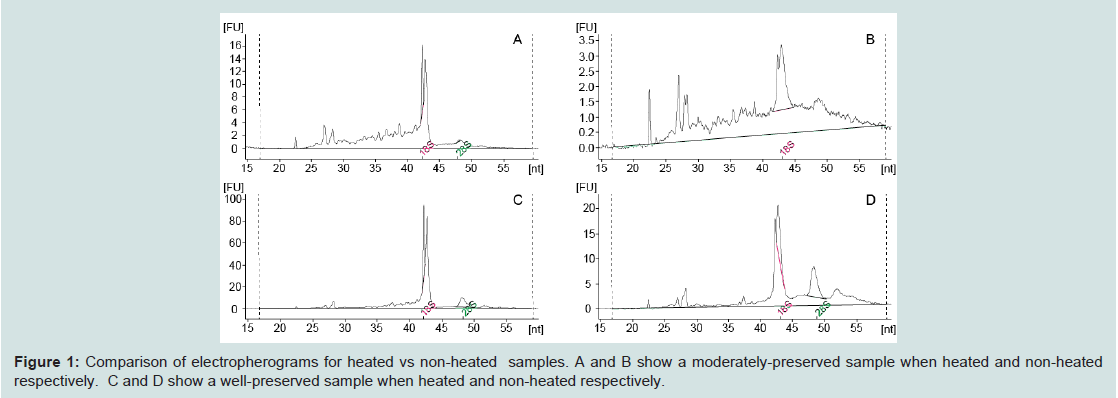
Figure 1: Comparison of electropherograms for heated vs non-heated samples. A and B show a moderately-preserved sample when heated and non-heated respectively. C and D show a well-preserved sample when heated and non-heated respectively.
As the 18S and 28S rRNAs formed a single double peak when run on the bioanalyzer, samples were run on an ethidium bromidestained 1% TBE agarose electrophoretic gel for 30 minutes at 140 V to confirm the presence of unique 18S and 28S bands. The 5S band is also visible on electrophoretic gel in RNA samples that are concentrated and well-preserved and is an indicator of high RNA quality. Electropherograms from the Agilent 2100 Bioanalyzer were therefore used with heated samples to show general degradation and calculate total rRNA ratios and RIN scores, while gel electrophoresis was used to show the presence of the distinct rRNA bands. Together, the electropherograms and electrophoretic gels give a reliable representation of RNA quality.
Results
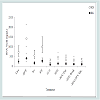
RNA quantity and purityRNA quantity, as determined by both TBS-380 RiboGreen assay and the NanoDrop spectrophotometer, exhibited less variability between temperature regimes than did RNA quality. The concentrations recovered by spectrophotometry were consistently higher than those recovered by RiboGreen. Despite the differences in measurement, both methods revealed similar trends in returned quantity (Figure 2). The results of the generalized linear model showed significant differences in the quantity of RNA yield from the nine treatments for both the TBS-380 RiboGreen assay (p = 0.0005) and the NanoDrop spectrophotometer (p = 0.0010). In both assays, the -20 °C treatment yielded more RNA than the room temperature treatments and all 30 °C treatments (including temperature-oscillated samples) (Figure 2). In the RiboGreen assay, the -20 °C treatment yielded more RNA than the room temperature treatment, all 30 °C treatments, and the ice treatment (Figure 2). In both RiboGreen and NanoDrop assays, refrigerated samples returned higher RNA quantities than room temperature samples, temperature-oscillated samples, or 30 °C that were first frozen for one week. Despite the high RNA yield from frozen and refrigerated samples, there was no significant difference between live-extracted samples and any of the treatment groups, with the exception of temperature-oscillated samples returning lower RNA concentrations than live-extracted samples as determined by RiboGreen analysis (Figure 2). There was no correlation between beetle weight and RNA yield as determined by RiboGreen (Spearman, ρ = 0.250, p = 0.201) or NanoDrop (Spearman, ρ = 0.243, p = 0.222) analyses). The 260/280 and 260/230 ratios of all samples were indicative of pure RNA (Table 2).
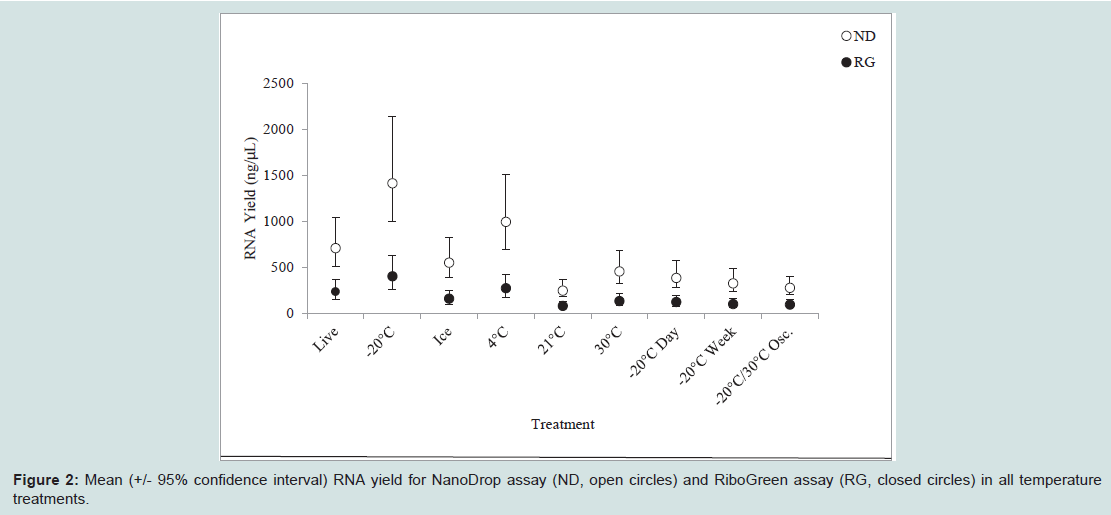
Figure 2: Mean (+/- 95% confidence interval) RNA yield for NanoDrop assay (ND, open circles) and RiboGreen assay (RG, closed circles) in all temperature treatments.
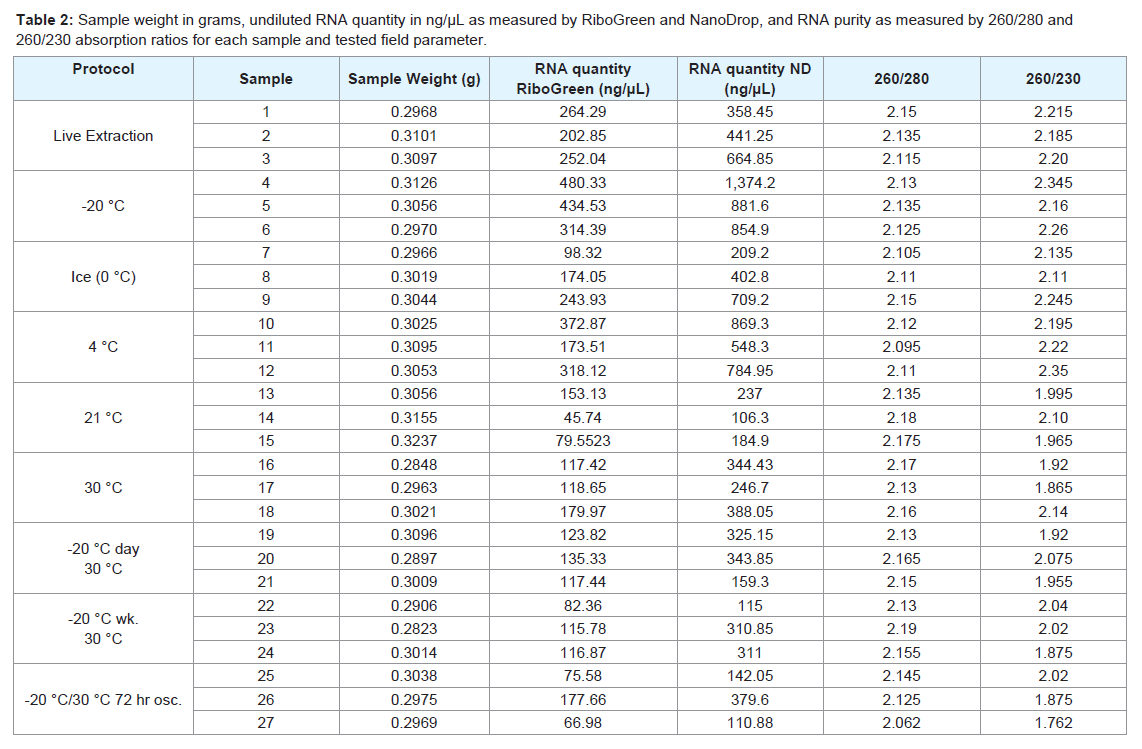
Table 2: Sample weight in grams, undiluted RNA quantity in ng/μL as measured by RiboGreen and NanoDrop, and RNA purity as measured by 260/280 and 260/230 absorption ratios for each sample and tested field parameter.
We found RNA samples preserved in RNAlater-like buffer at -20 °C, 0 °C (ice), and 4 °C for 21 days yielded high-quality, well-preserved RNA that was comparable to or exceeded the quality of RNA obtained from live specimens. This was demonstrated by clear bands showing the 5S, 18S, and 28S subunits with minimum smearing (indicative of degradation) on ethidium bromide-stained gels, and low levels of degradation and a clear double peak representing the combined 18S and 28S subunits in the electropherograms (Figures 3 and 4). RIN scores obtained from live or frozen samples were consistently near 6.0. RIN scores from refrigerated tissues averaged 6.5 while tissues kept on ice often approached 7.0. Live, frozen, on ice, and refrigerated samples all yielded total rRNA ratios exceeding 0.39 (Table 3).
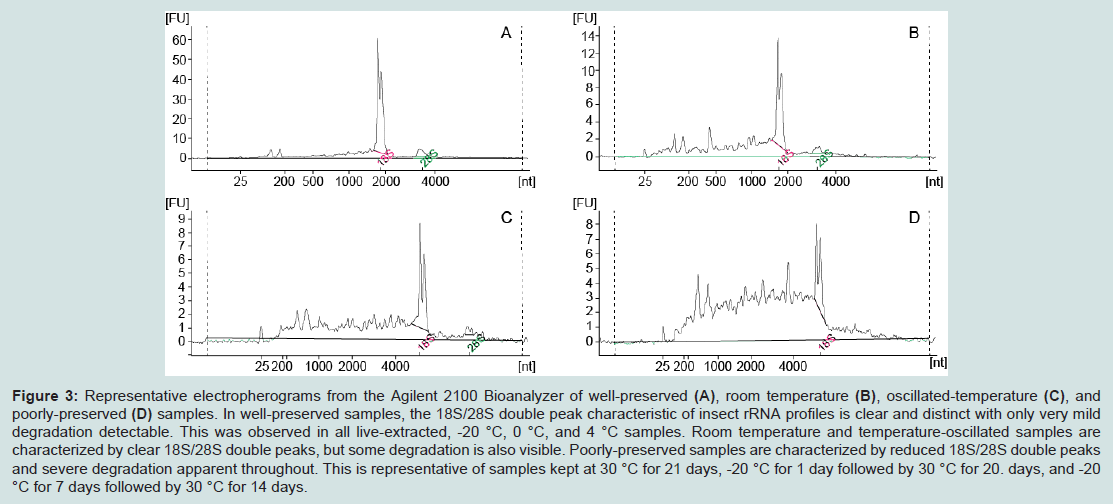
Figure 3: Representative electropherograms from the Agilent 2100 Bioanalyzer of well-preserved (A), room temperature (B), oscillated-temperature (C), and poorly-preserved (D) samples. In well-preserved samples, the 18S/28S double peak characteristic of insect rRNA profiles is clear and distinct with only very mild degradation detectable. This was observed in all live-extracted, -20 °C, 0 °C, and 4 °C samples. Room temperature and temperature-oscillated samples are characterized by clear 18S/28S double peaks, but some degradation is also visible. Poorly-preserved samples are characterized by reduced 18S/28S double peaks and severe degradation apparent throughout. This is representative of samples kept at 30 °C for 21 days, -20 °C for 1 day followed by 30 °C for 20. days, and -20 °C for 7 days followed by 30 °C for 14 days.
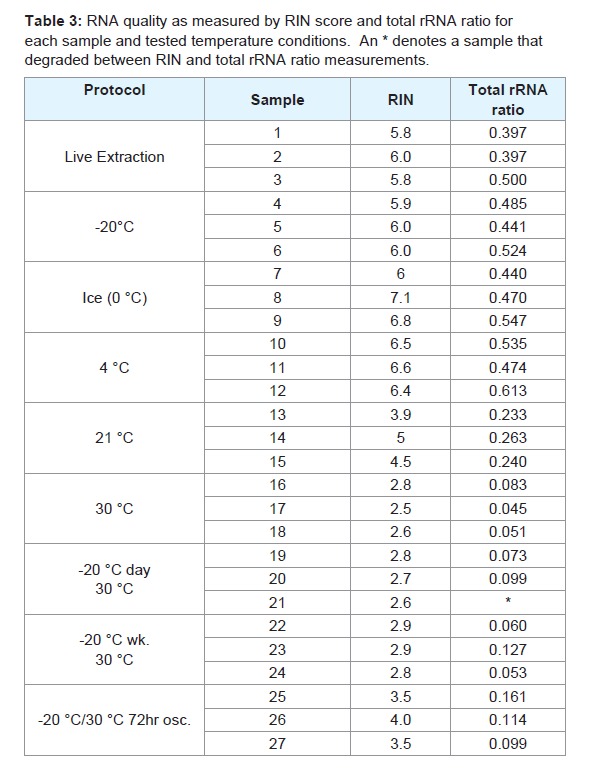
Table 3: RNA quality as measured by RIN score and total rRNA ratio for each sample and tested temperature conditions. An * denotes a sample that degraded between RIN and total rRNA ratio measurements.
Samples subjected to temperature oscillations between -20 °C and 30 °C showed moderate degradation. Temperature-oscillated samples exhibited smearing and a faint 18S band, without presence of a significant 5S or 28S bands when viewed on an electrophoretic gel (Figure 4). However, these samples also exhibited a distinct double peak representing the 18S and 28S bands, making electropherograms from these samples closer in appearance to well-preserved samples than other 30 °C derivatives (Figure 3). The RIN scores recovered for these samples averaged 3.7 and the average total rRNA ratio was 0.125 (values for each sample given in Table 3).
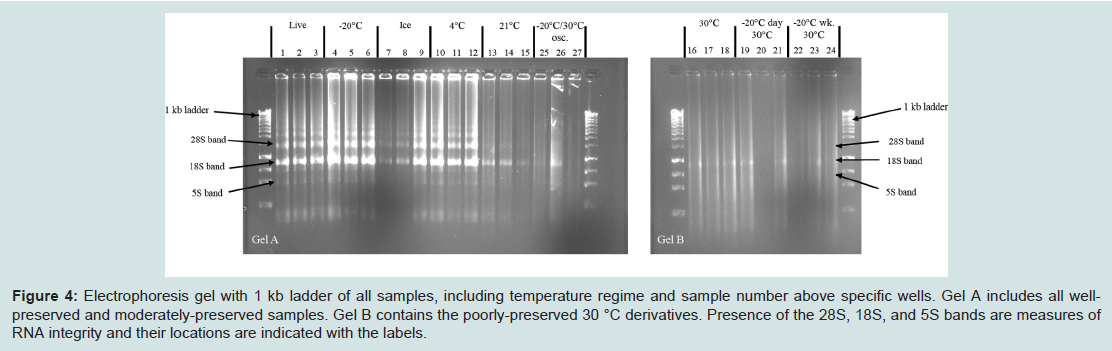
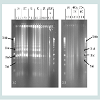
Figure 4: Electrophoresis gel with 1 kb ladder of all samples, including temperature regime and sample number above specific wells. Gel A includes all wellpreserved and moderately-preserved samples. Gel B contains the poorly-preserved 30 °C derivatives. Presence of the 28S, 18S, and 5S bands are measures of RNA integrity and their locations are indicated with the labels.
Discussion
Samples that were frozen or refrigerated yielded notably higher RNA concentrations. The reason why these two temperature treatments returned consistently higher RNA quantities is unclear. However, the trend in RNA yield approximately follows the pattern of RNA quality, with samples kept on ice presenting a potential exception. Many factors can affect RNA yield, including extraction protocol [13,23]. While previous studies have shown that different protocols can lead to different RNA yields, our results suggest that RNA quality and quantity may be correlated, at least when extracted using NucleoSpin RNAII Columns (Clontech). RNA degradation is most likely to occur along the phosphate backbone leading to fragmented RNA [2]. It is therefore possible that the RNA of degraded samples is more likely to pass through the spin columns during extraction, as NucleoSpin RNAII columns are intended to extract RNA fragments larger than 200 bp (NucleoSpin® RNA user manual). This would account for the lower concentrations seen in degraded samples. It is also possible that preserving samples in RNAlater-like buffer for three weeks facilitated additional cell lysis leading to higher RNA yield. This may help explain why frozen and refrigerated samples were generally (but not significantly) higher than live-extracted samples. Further research will be needed to address the relationship between quality and quantity of RNA extracted with filter columns.RNA quality of samples stored in RNAlater-like buffer is highly sensitive to temperature. We found that samples kept cool (-20 °C, 0 °C, or 4 °C) for 21 days yielded high-quality RNA appropriate for use in NGS assays. This is in line with manufacturer claims that samples can be preserved at 4 °C for up to one month. Of particular interest, samples preserved at 0 °C or 4 °C returned the highest quality RNA. Based on these results, researchers may obtain higher-quality RNA from samples stored on ice or refrigerated, rather than frozen, for the duration of field travel. This suggests that RNAlater-like buffer preserves samples better as a cooled liquid than it does by freezing samples in the buffer solution. It is possible that immediately freezing samples in RNAlater-like buffer does not allow sufficient time for the buffer solution to penetrate the tissue. Thus, cooled RNAlaterlike buffer may provide an ideal medium for sample preservation for periods up to 21 days. We recommend that, at the very least, researchers follow RNAlater® manufacturer protocols to refrigerate samples in the buffer solution overnight before freezing.Room temperature and -20 °C/30 °C oscillations samples yielded moderate-quality RNA. The total rRNA ratios of these samples was recovered below 0.35, suggesting that they are likely unacceptable for NGS assays. However, the quality of RNA that is acceptable for NGS techniques depends on various factors including assay sensitivity and the needed quantity of intact RNA. Additionally, the accuracy of assays run with semi-degraded samples may be increased if linear models are used to correct for the effects of RNA degradation on recovered gene expression levels [24]. While not ideal, samples that have unavoidably experienced some degradation under field conditions may still produce acceptable results and should be used at the discretion of the researcher.Samples subjected to 30 °C for 21, 20 (initially frozen for one day), or 14 days (initially frozen for seven days) were highly degraded and are probably unacceptable for most NGS assays, regardless of previous temperature treatment. In contrast, samples stored at 21 °C were of moderate quality and may still be acceptable for NGS assays in some circumstances. Despite being kept closer to 30 °C than 4 °C, the average RIN score and total rRNA ratio of RNA from 21 °C samples were approximately halfway between 4 °C and 30 °C samples. This suggests that RNA degradation rates are non-linear with regards to temperature and may increase exponentially with temperature. The nearly identical RNA quality recovered from samples stored at -20 °C, 0 °C, and 4 °C provides further evidence for an exponential relationship between temperature and RNA degradation rates in samples stored in RNAlater-like buffer. Room temperature appears to be near a critical threshold below which RNA degradation is minimal and above which RNA degradation is rapid.Samples subjected to temperature oscillations between -20 °C and 30 °C were partially degraded but were better preserved than other 30 °C treatments. One possible explanation for this result is decreased time at 30 °C. Samples that oscillated between -20 °C and 30 °C spent a total of nine days at 30 °C and returned an average RIN score of 3.7 and an average total rRNA ratio of 0.125. In contrast, 30 °C treatments spent 14 days, 20 days, or 21 days at 30 °C and gave average RIN scores of 2.9, 2.7, and 2.6, respectively with total rRNA ratios of 0.08, 0.086, and 0.06, respectively. While the additional five days at 30 °C may be responsible for the difference in RNA quality between temperature-oscillated samples and those at 30 °C for 14 days, it should be noted that the difference in RNA quality between samples at 30 °C for 14 days vs. 20 days was marginal. There are two likely explanations for the increased preservation seen with oscillating samples. The first is that rapid RNA degradation continued after nine days at 30 °C but slowed by 14 days. The second is that the freeze/thaw cycles experienced by these samples helped interrupt RNA degradation processes and allowed for slightly improved RNA preservation. In either case, the results from temperature oscillating samples demonstrate the importance of keeping samples as cool as possible. Freezing samples prior to travel or other inconveniences where storage in cool environments is not possible may help minimize degradation caused by such unavoidable, sub-ideal temperature regimes.
Conclusion
RNAlater-like buffers can be an effective solution for preserving RNA in tissue samples for periods of up to 21 days, and likely beyond with proper treatment. Our results indicate that researchers collecting samples for RNA in the field should use every available means to keep samples as cold as possible, with cooled (0 °C, 4 °C) liquid RNAlater like buffer providing an ideal medium for preservation over a 21- day period. Samples kept in cool conditions will yield high-quality RNA, even if never frozen. RNA degradation appears to increase exponentially with temperature in samples stored in RNAlater like buffer, with temperatures around 21 °C resulting in significant degradation over 21 days. Accordingly, great care should be taken to minimize the time samples are stored near or above 21 °C. Freezethaw cycles may help disrupt RNA degradation processes in samples stored in warmer temperatures. Samples should be kept cool for as long and often as possible as any samples subjected to temperatures exceeding room temperature will rapidly degrade, regardless of prior treatment.Acknowledgements
We thank Ed Wilcox (DNA Sequencing Center, Brigham Young University, Provo, UT) for training assistance for both the Agilent 2100 Bioanalyzer and the RiboGreen analyses. We thank Anton Suvorov for help generating figures and statistics. We also thank members of the Bybee Lab (Department of Biology, Brigham Young University) for their thorough review and editing of earlier versions of this manuscript. Funding for PRA was made possible by a BYU Office of Research and Creative Activities (ORCA) grant number 3462 awarded to PRA and through an NSF supplemental REU grant awarded to DEB-1265714. Funding to NPL was also provided by DEB-1265714 awarded to SMB.Author contributions
PRA, NPL, and SMB contributed to the study design and data analysis. ANS reared and provided N. marginatus samples for the study, performed statistical analyses, and helped generate figures. NPL also aided in the construction of figures. PRA conducted the research and wrote the paper, with editing and input from all three co-authors.
References
- Wang Z, Gerstein M, Snyder M (2009) RNA-Seq: a revolutionary tool for transcriptomics. Nat Rev Genet 10: 57-63.
- Houseley J, Tollervey D (2009) The many pathways of RNA degradation. Cell 136: 763-776.
- Schroeder A, Mueller O, Stocker S, Salowsky R, Leiber M, et al. (2006) The RIN: an RNA integrity number for assigning integrity values to RNA measurements. BMC Mol Biol 7: 3.
- Copois V, Bibeau F, Bascoul-Mollevi C, Salvetat N, Chalbos P, et al. (2007) Impact of RNA degradation on gene expression profiles: Assessment of different methods to reliably determine RNA quality. J Biotechnol 127: 549-559.
- Fleige S, Walf V, Huch S, Prgomet C, Sehm J, et al. (2006) Comparison of relative mRNA quantification models and the impact of RNA integrity in quantitative real-time RT-PCR. Biotechnol Lett 28: 1601-1613.
- Imbeaud S, Graudens E, Boulanger V, Barlet X, Zaborski P, et al. (2005) Towards standardization of RNA quality assessment using user-independent classifiers of microcapillary electrophoresis traces. Nucleic Acids Res 33: e56.
- Salehi Z, Najafi M (2014) RNA preservation and stabilization. Biochem Physiol: Open Access 3: 1-4.
- Bradley BJ, Pastorini J, Mundy NI (2005) Successful retrieval of mRNA from hair follicles stored at room temperature: implications for studying gene expression in wild mammals. Mol Ecol Notes 5: 961-964.
- Kasahara T, Miyazaki T, Nitta H, Ono A, Miyagishima T, et al. (2006) Evaluation of methods for duration of preservation of RNA quality in rat liver used for transcriptome analysis. J Toxicol Sci 31: 509-519.
- Weber DG, Casjens S, Rozynek P, Lehnert M, Zilch-Schoeneweis S, et al. (2010) Assessment of mRNA and microRNA stabilization in peripheral human blood for multicenter studies and biobanks. Biomark Insights 5: 95-102.
- Bachoon DS, Chen F, Hodson RE (2001) RNA recovery and detection of mRNA by RT-PCR from preserved prokaryotic samples. FEMS Microbiol Lett 201: 127-132.
- Micke P, Ohshima M, Tahmasebpoor S, Ren ZP, Ostman A, et al. (2006) Biobanking of fresh frozen tissue: RNA is stable in nonfixed surgical specimens. Lab Invest 86: 202-211.
- Gayral P, Weinert L, Chiari Y, Tsagkogeorga G, Ballenghien M, et al. (2011) Next-generation sequencing of transcriptomes: a guide to RNA isolation in nonmodel animals. Mol Ecol Resour 11: 650-661.
- Mutter GL, Zahrieh D, Liu C, Neuberg D, Finkelstein D, et al. (2004) Comparison of frozen and RNAlater solid tissue storage methods for use in RNA expression microarrays. BMC Genomics 5: 88.
- Paska C, Bogi K, Szilak L, Tokes A, Szabo E, et al. (2004) Effect of formalin, acetone, and RNAlater fixatives on tissue preservation and different size amplicons by real-time PCR from paraffin-embedded tissue. Diagn Mol Pathol 13: 234-240.
- Camacho-Sanchez M, Burraco P, Gomez-Mestre I, Leonard JA (2013) Preservation of RNA and DNA from mammal samples under field conditions. Mol Ecol Resour 13: 663-673.
- Forster JL, Harkin VB, Graham DA, McCullough SJ (2008) The effect of sample type, temperature and RNAlaterTM on the stability of avian influenza virus RNA. J Virol Methods 149: 190-194.
- Jones LJ, Yue ST, Cheung CY, Singer VL (1998) RNA quantitation by fluorescence-based solution assay: RiboGreen reagent characterization. Anal Biochem 265: 368-374.
- Aranda IV R, Dineen SM, Craig RL, Guerrieri RA, Robertson JM (2009) Comparison and evaluation of RNA quantification methods using viral, prokaryotic, and eukaryotic RNA over a 104 concentration range. Anal Biochem 387: 122-127.
- Green MR, Sambrook J (2012) Molecular cloning: A laboratory manuel. Fourth edition, Cold Spring Harbor Laboratory Press, Cold Spring Harbor, New York, USA.
- Applebaum SW, Ebstein RP, Wyatt GR (1966) Dissociation of ribonucleic acid from silkmoth pupae by heat and dimethylsulfoxide: evidence for specific cleavage points. J Mol Biol 21: 29-41.
- Winnebeck EC, Millar CD, Warman GR (2010) Why does insect RNA look degraded? J Insect Sci 10: 159.
- Ridgeway JA, Timm AE (2014) Comparison of RNA isolation methods from insect larvae. J Insect Sci 14.
- Romero IG, Pai AA, Tung J, Gilad Y (2014) RNA-seq: impact of RNA degradation on transcript quantification. BMC Biol 12: 42.