
Journal of Transplantation & Stem Cell Biology
Download PDF
Research Article
*Address for Correspondence: Schickwann Tsai, University of Utah, SOM 5C402, 26 North 1900 East, Salt Lake City, Utah 84132-4601,Tel: 801-585-0495; Fax: 801-585-0496; E-mail: schickwann.tsai@hsc.utah.edu
Citation: Wang J, Tsai S. Jagged2 Stimulates the Generation of Cytotoxic T Lymphocytes: Relevance to Acute Graft-Versus-Host Disease. J Transplant Stem Cel Biol. 2014;1(1): 7.
Copyright © 2014 Wang J, et al. This is an open access article distributed under the Creative Commons Attribution License, which permits unrestricted use,distribution, and reproduction in any medium, provided the original work is properly cited.
Journal of Transplantation & Stem Cell Biology | ISSN 2374-9326 | Volume: 1, Issue: 1
Submission: 16 July 2014 | Accepted: 28 July 2014 | Published: 01 August 2014
Reviewed & Approved by: Dr. Volker Nickeleit, Department of Pathology and Laboratory Medicine, University of North Carolina, at Chapel Hill, USA
Jagged2 Stimulates the Generation of Cytotoxic T Lymphocytes: Relevance to Acute Graft-Versus-Host Disease
Jindong Wang and Schickwann Tsai*
- Department of Medicine, University of Utah, Salt Lake City, UT 84132
*Address for Correspondence: Schickwann Tsai, University of Utah, SOM 5C402, 26 North 1900 East, Salt Lake City, Utah 84132-4601,Tel: 801-585-0495; Fax: 801-585-0496; E-mail: schickwann.tsai@hsc.utah.edu
Citation: Wang J, Tsai S. Jagged2 Stimulates the Generation of Cytotoxic T Lymphocytes: Relevance to Acute Graft-Versus-Host Disease. J Transplant Stem Cel Biol. 2014;1(1): 7.
Copyright © 2014 Wang J, et al. This is an open access article distributed under the Creative Commons Attribution License, which permits unrestricted use,distribution, and reproduction in any medium, provided the original work is properly cited.
Journal of Transplantation & Stem Cell Biology | ISSN 2374-9326 | Volume: 1, Issue: 1
Submission: 16 July 2014 | Accepted: 28 July 2014 | Published: 01 August 2014
Reviewed & Approved by: Dr. Volker Nickeleit, Department of Pathology and Laboratory Medicine, University of North Carolina, at Chapel Hill, USA
Abstract
Background: Notch receptors and their ligands are evolutionarily conserved transmembrane proteins. Results of gene targeting and cell culture studies have shown that Notch receptors and DSL ligands play important roles in the development of mouse T lymphocytes from common lymphoid progenitors. However, little is known about the functional roles of Notch receptors and DSL ligands in mature T lymphocytes. The observation that naïve mature CD8+ T lymphocytes express NOTCH-2 and effector cytotoxic T lymphocytes express NOTCH-1 and NOTCH-2 suggests that there may be a role(s) for Notch ligands in the generation and/or functionality of cytotoxic T lymphocytes.Methods: In this report, we use a novel fibroblast based Cytolytic Focus Assay to investigate whether a Notch ligand, Jagged2, has any effect on the generation of mouse cytotoxic T lymphocytes.
Results: Our results indicate that target cells-expressed Jagged2 functions as a co-stimulator to promote the generation of cytotoxic T lymphocytes from CD8+ T lymphocytes in conjunction with exogenous interleukin-2. The resulting cytotoxic T lymphocytes have the appearance of large granular lymphocytes, are CD8+ TCRβ+ NK1.1-, and readily lyse allogeneic (or xenogeneic) fibroblasts.
Conclusions: Target cells-expressed Jagged2 has a co-stimulatory function in the generation of cytotoxic lymphocytes. This activity may be clinically relevant given the well-known fact that the most common sites of acute graft-versus-host disease (i.e. gut, skin and bile duct) are also sites of concentrated DSL ligand expression. We hypothesize that target tissue-expressed DSL ligands may contribute to the pathogenesis of acute graft-versus-host disease in gut, skin and bile duct in recipients of allogeneic hematopoietic cell transplant.
Introduction
Notch receptors and their ligands, the so-called “DSL” (Delta-Serrate-Lag2) ligands, are single-pass transmembrane proteins that are highly conserved from C. elegans to humans [1-5]. In mammals, four Notch receptors (Notch-1, -2, -3 & -4) [6-9] and five DSL ligands (Jagged1, Jagged2, Delta-like1 or Dll1, Dll3 and Dll4) [10-14] have been described. The importance of Notch in T cell development has been established by gene targeting studies and by tissue culture experiments. Conditional knockout of the Notch-1 allele in the postnatal period blocks T-cell development at the CD44- CD25+ stage [15] and co-cultivation of fetal liver cells with OP-9 stromal fibroblasts expressing Dll1 induces de novo T cell development [16].Several studies have provided evidence that Notch signaling continues to regulate aspects of T cell physiology in adults including the activation and proliferation of peripheral T lymphocytes [17-20]. Specifically, it has been shown that naive human CD8+ T cells express NOTCH-2 while effector cytotoxic T lymphocytes (CTLs) expressNOTCH-1 and NOTCH-2 [21]. Importantly, NOTCH signaling (in response to dendritic cells-expressed JAGGED1 and DLL4) positively influences the priming (activation and proliferation) of naïve human CD8+ T lymphocytes [21]. Furthermore, the Notch1 intracellular domain (N1ICD, the signaling peptide of activated Notch1) has been shown to bind directly to the promoters of perforin and granzyme B in mouse CD8+ T lymphocytes and activate their transcription, thus providing biochemical evidence of Notch’s involvement in the development and/or function of CTLs [22].
In contrast to most studies, our current investigation focuses on the effects of a DSL ligand (Jagged2) expressed by target cells on the generation of CTLs. Comprehensive mapping in adult rat gastrointestinal tract has revealed that Jagged1 and Jagged2 are expressed throughout the esophagus, stomach, small and large intestines with overlapping as well as spatially distinct expression patterns for each allele [23]. For example, the expression of Jagged1 is concentrated in the middle third of the crypts in colon while expression of Jagged2 is rather uniform. In small intestine, both Jagged1 and Jagged2 are expressed in the lower third of crypts. In skin, Jagged2 expression is found in the basal layer of the entire epidermis [24-26]. Furthermore, in developing mouse embryos the lining of the entire gastrointestinal tract and all derivatives of the foregut such as the bile duct also express high levels of Jagged2 [11]. The same tissues (skin, gut and bile duct) are also prime targets of acute graft-versus-host disease (GVHD) in recipients of allogeneic hematopoietic cell transplant [27]. Taken together, these findings raise the possibility that there might be a causal relationship between the localized expression of DSL ligands in gut, skin and bile duct and the high frequency and severity of acute GVHD in these anatomic sites. In this report, we provide the first experimental evidence that target cells-expressed Jagged2 indeed has a costimulatory function in the generation of CTLs.
 Jagged-2 stimulates the formation of cytolytic foci
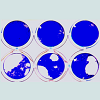 Figure 2: Jagged2 stimutes the formation of cytolytic foci.(A) A diagram outlining the Cytolytic Focus Assay used in this study. Monolayers of either Rab 9 C.6/LXSN (“RX”; negative control) or Rab 9 C.6/ LMJSN (“RJ2”; Jagged2-expressing) fibroblasts were established in 24-well plates and then seeded with mouse splenic mononuclear cells and co-cultured for 7-10 days in the presence of IL-2 (10 ng/ml). Focal lysis of the fibroblast monolayer was assessed after fixation and staining with Coomassie blue.(B) Coomassie blue-stained monolayers of RX and RJ2 after co-culturing with mouse splenic mononuclear cells (2 x 10⁶ cells/well) for 7 days with or without IL-2. Note the presence of macroscopic cytolytic foci (clear areas) in RJ2 but not the control RX monolayers.Jagged2 stimulates the generation of classic CTLs with the CD8+ TCRβ+ NK1.1- cell surface phenotype
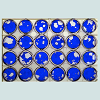 Figure 3: The effector cells in the Cytolytic Focus Assay are CD8++ TCRβ+ NK1.1-.(A) A 24-well plate of RJ2 (Jagged2-expressing) fibroblasts co-cultured with mouse splenic mononuclear cells (1x10⁶ ells per well) and IL-2 for 7 days as described in the legend of Figure 2. The monolayers were fixed and stained with Coomassie blue after the non-adherent cells were harvested.(B) The non-adherent cells in (A) were analyzed by flow cytometry for CD8 and CD45 (a pan-leukocyte marker) expression. The sorting gates for CD45+ CD8- and CD45+ CD8+ cells are indicated.(C) The sorted CD45+ CD8+ or CD45+ CD8- cells from (B) were seeded onto new RJ2 monolayers at 1-4 x 10⁵ cells/well in a 24-well plate. Phase20 contrast microscopy showed widespread cytolytic activity within 30 min of the addition of CD45+ CD8+ cells. Plates were fixed and stained with Coomassie blue after 20 hours of seeding. The CD45+ CD8- cells had no detectable cytolytic activity.(D) The CD45+ CD8+ cells from (B) were further fractionated by FACS into TCRβ+ NK1.1- (~ 94%) and TCRβ+ NK1.1+ (~ 6%) populations. Virtually all (>99.8%) cells expressed TCRβ.(E) Equal numbers of CD8+ TCRβ+ NK1.1- and CD8+ TCRβ+ NK1.1+ cells from (D) were plated onto new RJ2 monolayers. Additional RJ2 monolayers were seeded with unsorted CD8+ cells or no cells as controls. Cultures were fixed and stained after 18 hours of seeding to evaluate cytolytic activity. The CD8+ TCRβ+ NK1.1- fraction accounted for most the cytolytic activity.(F) Wright-Giemsastained cytospin preparation of sorted CD8+ TCRβ+ NK1.1- CTLs. Note the presence of prominent azurophilic granules in the cytoplasm and the ruffled cell membrane. (Bar = 20 μM)Jagged2 exerts its effects on CD8+ T lymphocytes
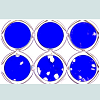 Figure 4: Jagged2 exerts its effects on CD8+ T lymphocytes. CD8+ cells were sorted (by FACS) from fresh (i.e. not co-cultured) mouse splenic mononuclear cells and co-cultured on RJ2 or RX monolayers with IL-2 at 5-20 x 104 cells per well in a 24- well plate. One million unsorted cells were added to additional wells for comparison. After 7 days, non-adherent cells were removed and the monolayers were fixed and stained with Coomassie blue. The cytolytic activity of 2 x 10⁵ sorted CD8+ cells roughly equaled that of 106 unsorted splenocytes. cells were sorted (by FACS) from fresh (i.e. not co-cultured) mouse splenic mononuclear cells and co-cultured on RJ2 or RX monolayers with IL-2 at 5-20 x 104 cells per well in a 24- well plate. One million unsorted cells were added to additional wells for comparison. After 7 days, non-adherent cells were removed and the monolayers were fixed and stained with Coomassie blue. The cytolytic activity of 2 x 10⁵ sorted CD8+ cells roughly equaled that of 106 unsorted splenocytes.Cytolytic activity depends on recognition of alloantigenTo determine if alloantigen (or xenoantigen) played a role in the generation and/or cytolytic activity of CTLs in the co-culture system, we first established a spontaneously 11 transformed fibroblast cell line, B6SF C.2, from the skin of a C57BL/6 (“B6”) mouse. After transduction with retroviral vectors LXSN and LMJSN and G418 selection, the stably transduced cell lines are referred to as B6SF C.2/LXSN (negative control) and B6SF C.2/LMJSN (expressing mouse Jagged2), respectively. Western blot analysis confirmed the expression of full-length Jagged2 in B6SF C.2/LMJSN but not B6SF C.2/LXSN (Figure 5A).
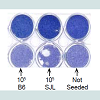 Figure 5: Cytolytic activity requires alloantigen.A clonal fibroblast cell line, B6SF C.2, was established from the skin of a B6 mouse. It was transduced with the retroviral vector LXSN (negative control) or LMJSN (expressing mouse Jagged2) and selected with G418.(A) Western analysis verifying the expression of Jagged2 in B6SF C.2 transduced with LMJSN (“BJ2”) but not LXSN (“BX”). (B) BX and BJ2 monolayers 21 were seeded with FACS-purified CD8+ lymphocytes (105 cells per well in a 24-well plate) from either the syngeneic B6 or MHCmismatched SJL mice. After co-cultivation for 7 days in the presence of IL-2 (10 ng/ml), non-adherent cells were harvested and the monolayers fixed and stained with Coomassie blue and photographed. Only cultures expressing Jagged2 and containing MHC-mismatched CD8+ lymphocytes showed macroscopic cytolytic foci. (C) Nonadherent cells harvested from the co-cultures in (B) were analyzed by flow cytometry. The total number of CD8+ cells was calculated from the total number of cells per well and the % of CD8+ cells determined by flow cytometry. Each circle represents the total number of CD8+ cells produced per well (3 wells per group). Horizontal and vertical bars represent means and standard deviations, respectively.
Materials and Methods
Cell lines and retroviral infectionsThe primary rabbit skin fibroblast cell strain, Rab-9 (ATCC CRL1414), was maintained in Dulbecco’s Modified Eagle’s Medium (DMEM; Gibco, Grand Island, NY) supplemented with 10% fetal bovine serum (FBS; Gibco). It was subcloned to obtain a clonal strain, Rab-9 C.6, with strong density-dependent inhibition of cell proliferation. The construction of retroviral vectors LXSN (negative control vector), LMJSN (expressing full-length mouse Jagged-2) and LECDSN (expressing the truncated, extracellular domain of mouse Jagged-2) has been described [11]. Rab-9 C.6 was infected with these retroviruses and selected with G418 (1 mg/ml) for 10 days.
Western blot analysis
For Western analyses, protein lysates (5 μg per lane) were separated by denaturing sodium dodecyl sulfate-polyacrylamide (7.5%) gel electrophoresis (SDS-PAGE), transferred to Hybond- ECL membranes (Amersham, Piscataway, NJ), incubated with rabbit antiserum against the intracellular domain of mouse Jagged2 [11], followed by enhanced chemiluminescence using goat-anti-rabbit Ig conjugated with horse radish peroxidase (HRP)(Amersham).
Mouse strains
Monoclonal antibodies against CD8 (clone 53-6.7) and CD45 (clone A20) were purified from conditioned media of hybridomas and conjugated with phycoerythrin (PE) or fluorescein isothiocyanate (FITC). The biotinylated antibody against NK1.1 and the PEconjugated antibody against T cell receptor β chain (TCRβ) were purchased from BD-Pharmingen (San Diego, CA). Biotinylated antibodies were secondarily stained with PE- or FITC-streptavidin (SAv; Biomedia, Foster City, CA).
Cytolytic Focus Assay
Mouse spleens were immersed in Hanks balanced salt solution containing 5% FBS and teased apart with forceps. The resulting cell suspension was filtered through an 80-μm nylon mesh and spun over a Nycodenz (specific gravity 1.077; Nycomed, Sweden) step gradient. Light-density mononuclear splenocytes were collected from the interface, washed and counted. Mononuclear splenocytes (usually1-2 x 10⁶ per well in a 24-well plate) were cocultured with preformed monolayers of skin fibroblast cell strains or cell lines in Iscove’s Modified Eagle’s Medium (IMDM) supplemented with 10% FBS, 5 x 10⁻⁵ M 2-mercaptoethanol, penicillin, streptomycin, fungizone and with or without human interleukin-2 (IL-2; Chiron, Emeryville, CA) at 10 ng/ml. After 7-10 days, non-adherent cells were harvested and the monolayers were gently rinsed with phosphate buffered saline (PBS) once and stained with Coomassie blue in methanol and acetic acid (BioRad, Hercules, CA) for 30 minutes. After staining, the monolayers were rinsed with tap water and air-dried.
Fluorescence activated cell sorting (FACS)
Mouse splenocytes were incubated for 20 minutes with optimal concentrations of PE- or FITC-conjugated antibodies against CD8 or TCRβ. Cells were sorted using a FACSVantage cell sorter (Becton Dickinson, San Jose, CA). For sorting of NK1.1+ cells, splenocytes were first incubated with biotinylated anti-NK1.1, followed by a second incubation with PE- or FITCSAv.
Quantitation of CD8+ lymphocytes
Non-adherent cells were harvested from the splenocyte/fibroblast co-cultures at the indicated times. The numbers of viable cells were counted with trypan blue. Cells were then stained with PE- or FITCconjugated anti-CD8 antibodies as well as propidium iodide (PI) and analyzed using a FACScan cytometer (Becton Dickinson). The total number of CD8+ cells in individual wells was calculated from the total number of viable cells and the percentage of CD8+ cells.
Results
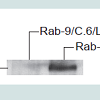
Retroviral vector-mediated expression of Jagged-2 in primary rabbit skin fibroblastsThe primary rabbit skin fibroblast cell strain, Rab-9, was subcloned twice to obtain a homogenous clone designated as Rab-9 C.6. This clonal strain exhibits strong cell density dependent inhibition of cell division and forms a stable monolayer post confluence. Rab-9 C.6 does not express Jagged2 and serves as a convenient host for expressing and testing the effects of Jagged2. Rab-9 C.6 was transduced with retroviral vectors LXSN (negative control) and LMJSN (expressing mouse Jagged2) and selected with G418. Two stable strains, Rab-9 C.6/LXSN (abbreviated as “RX”) and Rab-9 C.6/LMJSN (abbreviated as “RJ2”), were established and used in current studies. Western blot analysis confirmed the expression of the 120-kD mouse Jagged2 in RJ2 but not in RX (Figure 1).
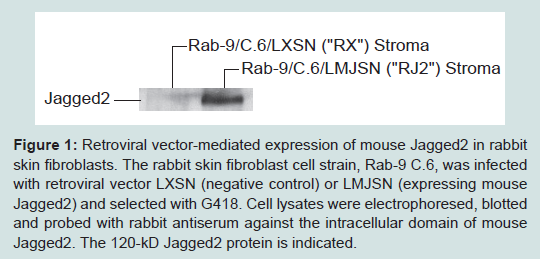
Figure 1: Retroviral vector-mediated expression of mouse Jagged2 in rabbit skin fibroblasts. The rabbit skin fibroblast cell strain, Rab-9 C.6, was infected with retroviral vector LXSN (negative control) or LMJSN (expressing mouse Jagged2) and selected with G418. Cell lysates were electrophoresed, blotted and probed with rabbit antiserum against the intracellular domain of mouse Jagged2. The 120-kD Jagged2 protein is indicated.
RX and RJ2 were used in a Cytolytic Focus Assay to assess the effects of Jagged2 on the generation of mouse CTLs. In this assay, mononuclear splenocytes from C57BL/6 (“B6”) mice were co-cultured with monolayers of RX vs. RJ2 in the presence of IL-2 in 24-well plates (Figure 2A). Serial phase-contrast microscopy of co-cultures revealed that many seeded mononuclear splenocytes proliferated in the RJ2 co-cultures and to a lesser extent in the RX co-cultures after 7 days of co-culturing. There was very little proliferation of splenocytes or cytolysis in co-cultures without exogenous IL-2 (Figure 2B), suggesting that IL-2 provided the main mitogenic stimulus in this assay. The optimal concentration of IL-2 for the formation of cytolytic foci was approximately 10 ng/ml. After 7-10 days, many cytolytic foci appeared in the RJ2 co-cultures. To compare the number and size of the cytolytic foci, the fibroblast monolayers were fixed and stained with Coomassie blue on day 7-10 of co-cultivation. As shown in Figure 2B, significantly more and larger cytolytic foci were seen in the RJ2 cocultures than in the control RX co-cultures. Taken together, these results suggest that Jagged2 provides a co-stimulatory function in the generation of CTLs or in the cytolytic activity of CTLs or both. Results of cell dose titration indicated that the frequency of the precursors of cytolytic focus-forming cells was about 1 in 25,000- 50,000 input mononuclear splenocytes, indicating that only rare precursor cells with T cell receptors capable of recognizing allo- or xeno-antigens could lead to the formation of cytolytic foci in the cocultures.
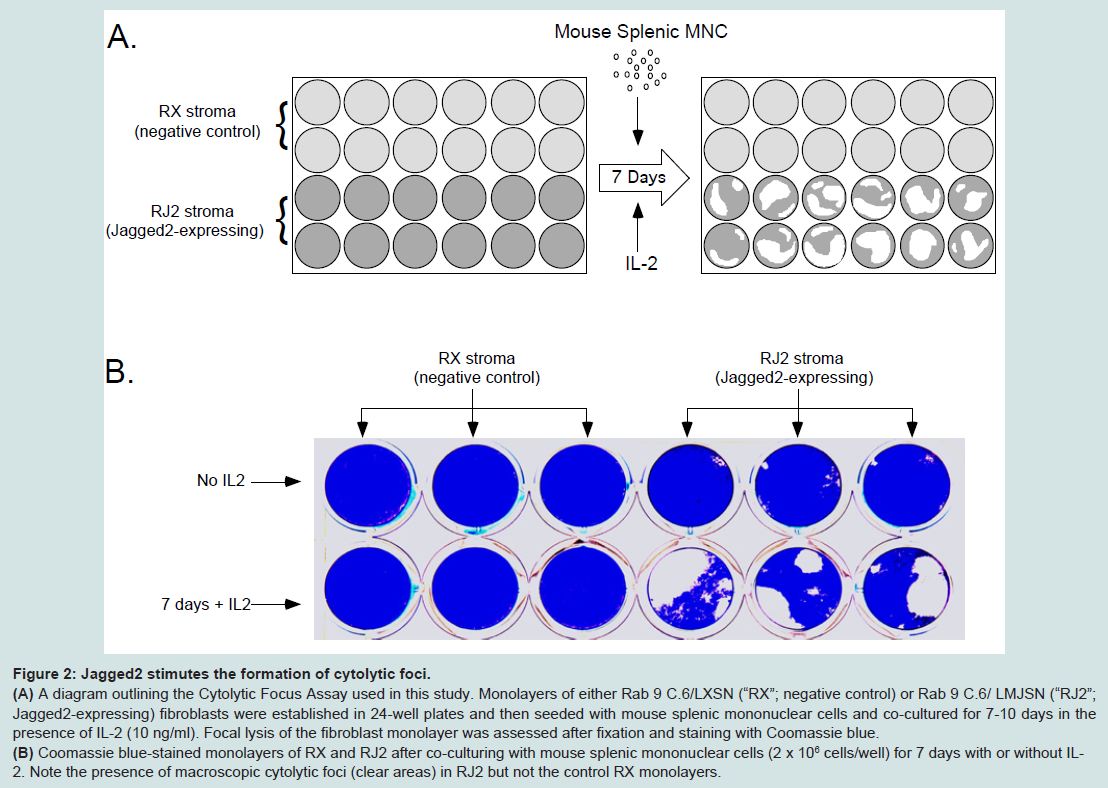 Figure 2: Jagged2 stimutes the formation of cytolytic foci.(A) A diagram outlining the Cytolytic Focus Assay used in this study. Monolayers of either Rab 9 C.6/LXSN (“RX”; negative control) or Rab 9 C.6/ LMJSN (“RJ2”; Jagged2-expressing) fibroblasts were established in 24-well plates and then seeded with mouse splenic mononuclear cells and co-cultured for 7-10 days in the presence of IL-2 (10 ng/ml). Focal lysis of the fibroblast monolayer was assessed after fixation and staining with Coomassie blue.(B) Coomassie blue-stained monolayers of RX and RJ2 after co-culturing with mouse splenic mononuclear cells (2 x 10⁶ cells/well) for 7 days with or without IL-2. Note the presence of macroscopic cytolytic foci (clear areas) in RJ2 but not the control RX monolayers.
To identify the cells responsible for the formation of cytolytic foci, we co-cultured mononuclear splenocytes with RJ2 monolayers and IL-2 (10 ng/ml) until cytolytic foci appeared (Figure 3A). The non-adherent mononuclear cells were harvested, labeled with anti-CD8 and anti-CD45 (a pan-leukocyte marker) monoclonal antibodies and sorted by FACS into CD45+ CD8+ and CD45+ CD8- fractions (Figure 3B). The sorted cells were re-seeded into new 24-well plates containing confluent RJ2 monolayers. The dose of sorted cells ranged from 1 to 4 x 10⁵ cells per well. Phase-contrast microscopy revealed widespread lysis of the RJ2 monolayers within 30 minutes of the addition of the sorted CD45+ CD8+ cells (Figure 3C, top row). In contrast, no cytolytic activity was observed in wells seeded with CD45+ CD8- cells (Figure 3C, bottom row).
To further characterize the effector cells in the CD4+ CD8+ population, CD45+ CD8+ cells were analyzed by flow cytometry according to T cell receptor β (TCRβ) and NK1.1 expression (Figure 3D). As shown in Figure 3D, over 99.8% of the CD8+ cells in the RJ2 coculture were TCRβ+. About 94% of the cells were NK1.1- and about 6% were NK1.1+. To determine which subset(s) had cytolytic activity, non-adherent mononuclear cells from day 7 RJ2 co-cultures were sorted by FACS into CD45+ CD8+ TCRβ+ NK1.1- and CD45+ CD8+ TCRβ+ NK1.1+ subsets, which were then co-cultured with new RJ2 monolayers. As shown in Figure 3E, both CD45+ CD8+ TCRβ+ NK1.1- and CD45+ CD8+ TCRβ+ NK1.1+ fractions caused widespread lysis of the RJ2 monolayers. The sorted CD45+ CD8+ TCRβ+ NK1.1- had the typical appearance of large granular lymphocytes on cytospin preparations (Figure 3F). Based on these findings, we conclude that the great majority of the effector cells in the Cytolytic Focus Assay were classic CTLs with the CD8+ TCRβ+ NK1.1- cell surface phenotype. A small minority of the effector cells had the CD8+ TCRβ+ NK1.1+ phenotype and could represent the relatively rare “NKT” cells[28].
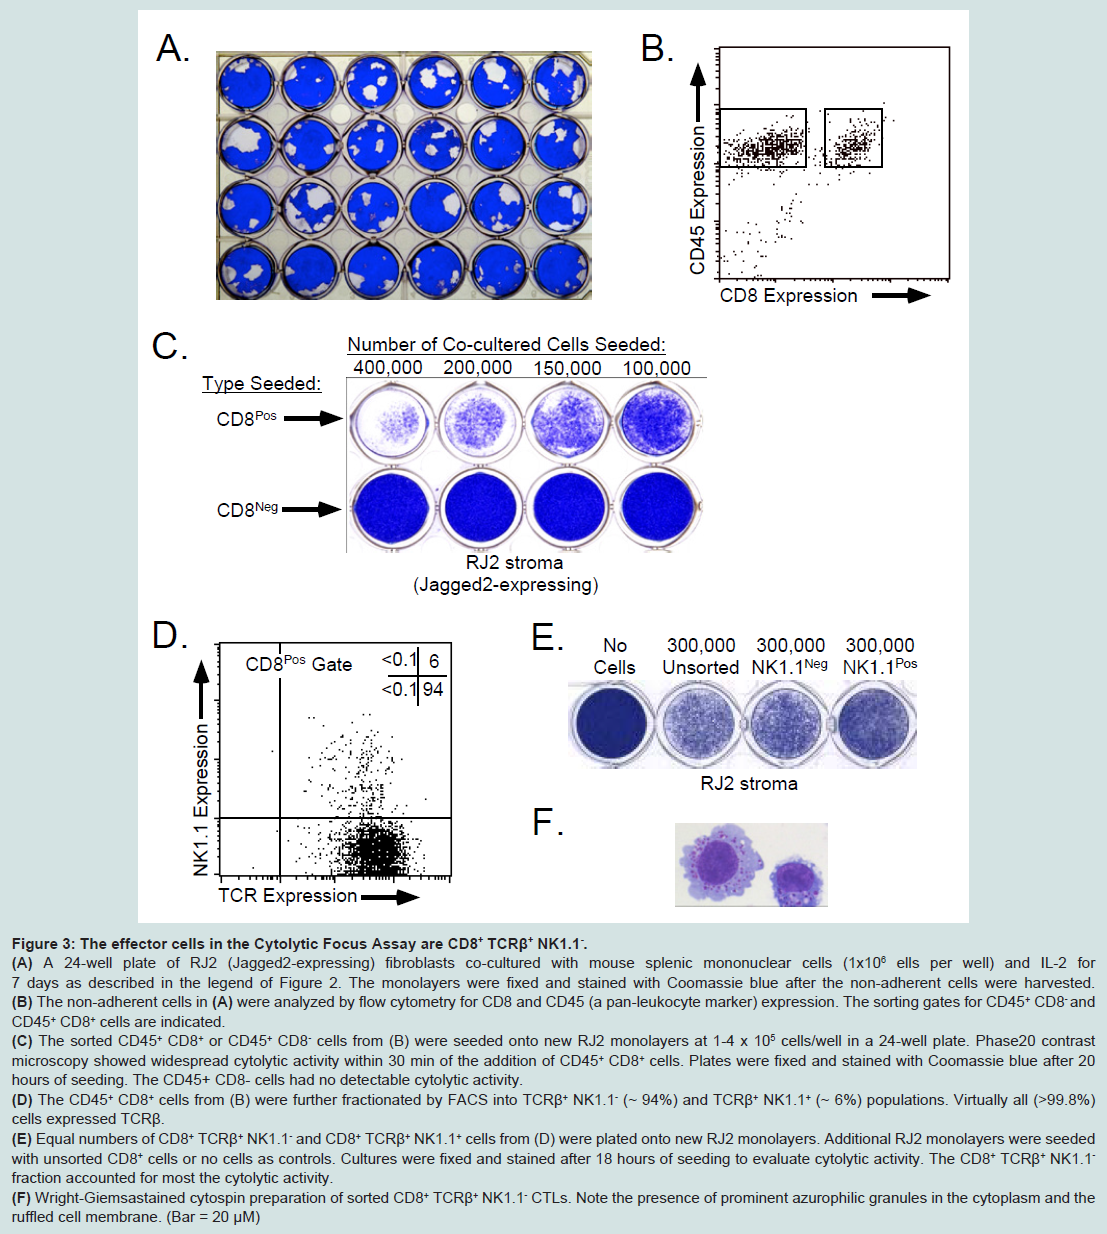 Figure 3: The effector cells in the Cytolytic Focus Assay are CD8++ TCRβ+ NK1.1-.(A) A 24-well plate of RJ2 (Jagged2-expressing) fibroblasts co-cultured with mouse splenic mononuclear cells (1x10⁶ ells per well) and IL-2 for 7 days as described in the legend of Figure 2. The monolayers were fixed and stained with Coomassie blue after the non-adherent cells were harvested.(B) The non-adherent cells in (A) were analyzed by flow cytometry for CD8 and CD45 (a pan-leukocyte marker) expression. The sorting gates for CD45+ CD8- and CD45+ CD8+ cells are indicated.(C) The sorted CD45+ CD8+ or CD45+ CD8- cells from (B) were seeded onto new RJ2 monolayers at 1-4 x 10⁵ cells/well in a 24-well plate. Phase20 contrast microscopy showed widespread cytolytic activity within 30 min of the addition of CD45+ CD8+ cells. Plates were fixed and stained with Coomassie blue after 20 hours of seeding. The CD45+ CD8- cells had no detectable cytolytic activity.(D) The CD45+ CD8+ cells from (B) were further fractionated by FACS into TCRβ+ NK1.1- (~ 94%) and TCRβ+ NK1.1+ (~ 6%) populations. Virtually all (>99.8%) cells expressed TCRβ.(E) Equal numbers of CD8+ TCRβ+ NK1.1- and CD8+ TCRβ+ NK1.1+ cells from (D) were plated onto new RJ2 monolayers. Additional RJ2 monolayers were seeded with unsorted CD8+ cells or no cells as controls. Cultures were fixed and stained after 18 hours of seeding to evaluate cytolytic activity. The CD8+ TCRβ+ NK1.1- fraction accounted for most the cytolytic activity.(F) Wright-Giemsastained cytospin preparation of sorted CD8+ TCRβ+ NK1.1- CTLs. Note the presence of prominent azurophilic granules in the cytoplasm and the ruffled cell membrane. (Bar = 20 μM)
Next, we determined whether CD8+ lymphocytes were the targets of Jagged2 stimulation in the Cytolytic Focus Assay. To this end, FACS-sorted CD8+ mouse splenocytes were co-cultured with RX (negative control) vs. RJ2 monolayers at doses ranging from 5 x 10⁴ to 2 x 10⁵ cells per well (of 24-well plates) in the presence of IL-2 (10 ng/ml) for 7 days. For comparison, additional monolayers were also co-cultured with 106 unsorted splenocytes or CD8- cells. The results showed that purified CD8+ splenocytes when co-cultured with RJ2 and IL-2 gave rise to functional CTLs that caused cytolytic foci at an efficiency 4-5 times higher than that of unsorted splenocytes (Figure 4, bottom row). No cytolytic foci were seen in the RX:CD8+ lymphocytes co-cultures (Figure 4, top row) or in RJ2:CD8- lymphocytes cocultures (not shown). These results indicate that Jagged2 exterted its effects on CD8+ lymphocytes.
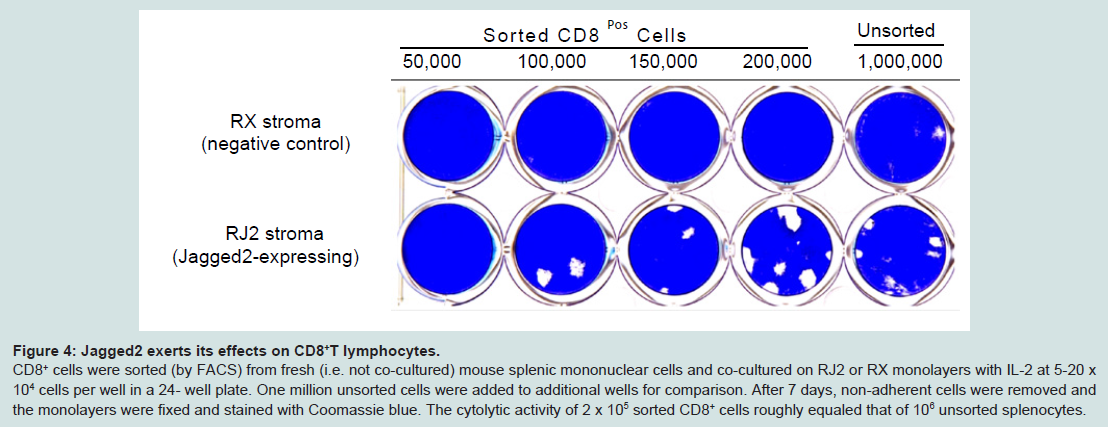 Figure 4: Jagged2 exerts its effects on CD8+ T lymphocytes. CD8+ cells were sorted (by FACS) from fresh (i.e. not co-cultured) mouse splenic mononuclear cells and co-cultured on RJ2 or RX monolayers with IL-2 at 5-20 x 104 cells per well in a 24- well plate. One million unsorted cells were added to additional wells for comparison. After 7 days, non-adherent cells were removed and the monolayers were fixed and stained with Coomassie blue. The cytolytic activity of 2 x 10⁵ sorted CD8+ cells roughly equaled that of 106 unsorted splenocytes. cells were sorted (by FACS) from fresh (i.e. not co-cultured) mouse splenic mononuclear cells and co-cultured on RJ2 or RX monolayers with IL-2 at 5-20 x 104 cells per well in a 24- well plate. One million unsorted cells were added to additional wells for comparison. After 7 days, non-adherent cells were removed and the monolayers were fixed and stained with Coomassie blue. The cytolytic activity of 2 x 10⁵ sorted CD8+ cells roughly equaled that of 106 unsorted splenocytes.
B6SF C.2/LXSN (hitherto referred to as “BX”; negative control) and B6SF C.2/LMJSN (hitherto referred to as “BJ2”) monolayers were co-cultured with 105 FACS-sorted B6 mouse (i.e. syngeneic) or SJL mouse (i.e. MHC-mismatched) CD8+ lymphocytes per well (24-well plates) in the presence of IL-2 (10 ng/ml). Neither the BX:B6 CD8+ lymphocytes nor the BJ2:B6 CD8+ lymphocytes co-cultures showed significant lysis after 7-10 days of co-cultivation (Figure 5B, left column). In contrast, many cytolytic foci were seen in the mismatched BJ2:SJL CD8+ lymphocytes co-cultures but not in the BX:SJL CD8+ lymphocytes co-cultures (Figure 5B, middle column). The nonadherent cells were harvested from all co-cultures and analyzed for CD8 expression by flow cytometry. The total numbers of CD8+ cells were calculated from the total numbers of non-adherent cells and the percentages of CD8+ cells as determined by flow cytometry. The results indicated that Jagged2 plus IL-2 stimulated CD8+ lymphocyte proliferation in both syngeneic (B6 fibroblasts:B6 CD8+) and mismatched (B6 fibroblasts:SJL CD8+) combinations (Figure 5C), although there was more CD8+ lymphocytes produced in the mismatched BJ2:SJL CD8+ co-cultures than in the syngeneic BJ2:B6 CD8+ co-cultures (3.75 vs. 2.50 x 10⁴; not statistically significant). These results indicate that Jagged2 has stimulatory effects on the generation of CTLs regardless of MHC matching status (syngeneic vs. allogeneic). However, the cytolytic activity in these co-cultures still depends on the recognition of alloantigen. Similar findings were obtained using BALB/C CD8+ splenocytes (data not shown).
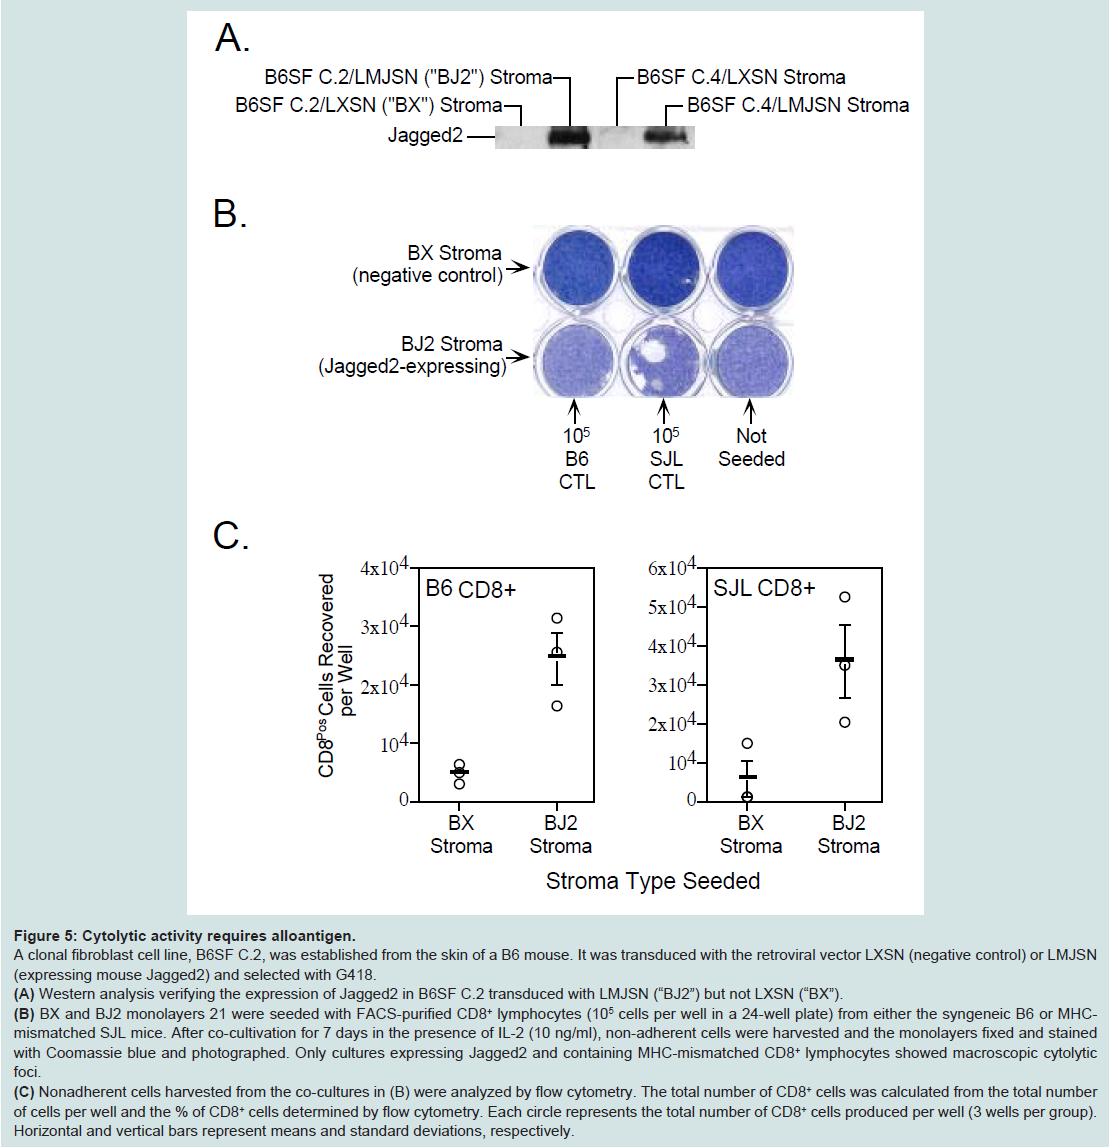 Figure 5: Cytolytic activity requires alloantigen.A clonal fibroblast cell line, B6SF C.2, was established from the skin of a B6 mouse. It was transduced with the retroviral vector LXSN (negative control) or LMJSN (expressing mouse Jagged2) and selected with G418.(A) Western analysis verifying the expression of Jagged2 in B6SF C.2 transduced with LMJSN (“BJ2”) but not LXSN (“BX”). (B) BX and BJ2 monolayers 21 were seeded with FACS-purified CD8+ lymphocytes (105 cells per well in a 24-well plate) from either the syngeneic B6 or MHCmismatched SJL mice. After co-cultivation for 7 days in the presence of IL-2 (10 ng/ml), non-adherent cells were harvested and the monolayers fixed and stained with Coomassie blue and photographed. Only cultures expressing Jagged2 and containing MHC-mismatched CD8+ lymphocytes showed macroscopic cytolytic foci. (C) Nonadherent cells harvested from the co-cultures in (B) were analyzed by flow cytometry. The total number of CD8+ cells was calculated from the total number of cells per well and the % of CD8+ cells determined by flow cytometry. Each circle represents the total number of CD8+ cells produced per well (3 wells per group). Horizontal and vertical bars represent means and standard deviations, respectively.
Discussion
In this report, we present experimental evidence that Jagged2 functions as a costimulator in the generation of effector CTLs from CD8+ T lymphocytes (IL-2 being the main stimulus) in the Cytotoxicity Focus Assay. Although alloantigens (or xenoantigens) undoubtedly provided additional stimuli through the corresponding T cell receptors, they did not appear to be essential for the proliferation (of CD8+ T lymphocytes) and functional differentiation of CTLs in the Cytolytic Focus Assay (Figure 5C, left panel; a syngeneic combination). However, they are important for the cytolytic attack on the target cells (Figure 5B, middle column; an allogeneic combination).Several lines of evidence indicate that the main effector cells in the cytolytic focus assay are CTLs rather than NK cells. First, FACS sorting of the co-cultured splenocytes showed that the great majority (~ 94%) of the effector cells in the Cytolytic Focus Assay displayed the surface phenotype of classic CTLs, i.e. CD8+ TCRβ+ NK1.1- (Figures 3D and 3E). Second, sorted CD8+ TCRβ+ NK1.1- cells harvested from the Cytolytic Focus Assay had the typical appearance of CTL on Wright-Giemsa-stained cytospin preparations (Figure 3F). Third, the generation of CTLs and the appearance (on the last days) of cytolytic foci took 7-10 days. This kinetics is similar to that of resting CTLs and differs from that of NK cells, which lyse target cells within minutes of contact. Finally, flow cytometry revealed that over 99.8% of the cells harvested from the Cytolytic Focus Assay were TCRβ+ (i.e. not NK cells) and only about 6% were CD8+ TCRβ+ NK1.1+ “NKT” cells (Figure 3D). Results of cell-dose titration studies indicate that the frequency of the precursors of the cytolytic focus-forming CTLs is about 1 in 25,000-50,000 CD8+ lymphocytes (Figure 4). This is in line with the expectation that only rare CD8+ T lymphocytes derived CTL clones with the appropriate alloantigen (or xenoantigen)-recognizing T cell receptors can mount a cytolytic attack on the target cells.
The findings described here corroborate the previous reports that Notch signaling is involved in the activation and proliferation of CTLs [21,22]. The major difference is that our current study focuses on the role of target cells-expressed DSL ligands. Taken together, these findings suggest that DSL ligands have a co-stimulatory effect on the generation of CTLs regardless of the source (target cells- vs. antigen presenting cells-expressed) or the stage of CTL differentiation (naive vs. resting). The implication is that tissues with concentrated expression of DSL ligands such as gut may experience disproportionate CTL attack in acute GVHD. Thus approaches designed to specifically reduce the effects of DSL ligands or Notch signaling may help prevent or reduce GVHD in these particular tissues. Previous attempts to decrease Notch signaling with inhibitors of γ-secretase or ADAM10 (the rate-limiting enzyme in Notch activation) were met with excessive toxicities in part due to the wide-spread expression of Notch or the ubiquitous expression of ADAM10 [29,30]. Alternative approaches employing decoy DSL ligands or molecules that disrupt the interaction between ADAM10 and its maturation and trafficking partners, the so-called “8-cysteine tetraspanins” [31,32], may offer more favorable toxicity profiles or tissue specificities.
In summary, our hypothesis regarding the co-stimulator function of target cellsexpressed DSL ligands in the generation of CTLs complements rather than detracts from the prevailing model of acute GVHD [27,33,34]. However, it may help explain the extraordinary sensitivity of gut, skin and bile duct to acute GVHD and suggest new ways to prevent or control acute GVHD in these sites.
Acknowledgements
The authors would like to thank members of the Tsai lab and the flow cytometry core for excellent technical assistance. This work was supported in part by the St. Perres Fund.References
- Fortini ME, Artvanis-Tsakonas S (1993) Neurogenesis is only part of the picture. Cell 75: 1245-1247.
- Greenwald I (1994) Structure/function studies of lin-12/Notch proteins. Curr Opin Genet Dev 4: 556-562.
- Greenwald I (1998) LIN-12/Notch signaling: lessons from worms and flies. Genes Dev 12: 1751-1762.
- Egan SE, St Pierre B, Leow CC (1998) Notch receptors, partners and regulators: from conserved domains to powerful functions. Curr Top Microbiol Immunol 228: 273-324.
- Artavanis-Tsakonas S, Rand MA, Lake RJ (1999) Notch signaling: Cell fate control and signal integration in development. Science 284: 770-776.
- Weinmaster G, Roberts VJ, Lemke G (1991) A homologue of Drosophila notch expressed during mammalian development. Development 113: 199-205.
- Weinmaster G, Roberts VJ, Lemke G (1992) Notch2: a second mammalian Notch gene. Development 116: 931-941.
- Lardelli M, Dahlstrand J, Lendahl U (1994) The novel Notch homologue mouse Notch3 lacks specific epidermal growth factor-repeats and is expressed in proliferating neuroepithelium. Mech Dev 46: 123-136.
- Uyttendaele H, Marazzi G, Wu G, Yan Q, Sasson D, Kitajewski J (1996) Notch4/int- 3, a mammalian proto-oncogene, is an endothelial cell-specific mammalian Notch gene. Development 122: 2251-2259.
- Lindsell CE, Shawber CJ, Boulter J, Weinmaster G (1995) Jagged: a mammalian ligand that activates Notch1. Cell 80: 909-917.
- Tsai S, Fero J, Bartelmez S. (2000) Mouse Jagged2 is differentially expressed in hematopoietic progenitors and endothelial cells and promotes the survival and proliferation of hematopoietic progenitors by direct cell to cell contact. Blood 96: 950-957.
- Bettenhausen B, Hrabe de Angelis M, Simon D, Guenet J, Gossier A (1995) Transient and restricted expression during mouse embryogenesis of Dll1, a murine gene closely related to Drosophila Delta. Development 121: 2407-2418.
- Dunwoodie SL, Henrique D, Harrison SM, Bedington RSP (1997) Mouse Dll3: a novel divergent Delta gene which may complement the function of other Delta homologue during early pattern formation in the mouse embryo. Development 124: 3065-3076.
- Shutter JR, Scully S, Fan W, Richards WG, Kitajewski J, et al. (2000) Dll4, a novel Notch ligand expressed in arterial endothelium. Genes Develop 14: 1313-1318.
- Radtke F, Wilson A, Stark G, Bauer M, van Meerwijk J, et al. (1999) Deficient T cell fate specification in mice with an induced inactivation of Notch1. Immunity 10: 547-558.
- Schmitt TM, Zuniga-Pflucker JC (2002) Induction of T cell development from hematopoietic progenitor cells by Delta-like-1 in vitro. Immunity 17: 749-756.
- Adler SH, Chiffoleau E, Xu L, Dalton NM, Burg JM, et al. (2003) Notch signaling augments T cell responsiveness by enhancing CD25 expression. J Immunol 171: 2896-2903.
- Eagar TN, Tang Q, Wolfe M, He Y, Pear WS, et al. (2004) Notch 1 signaling regulates peripheral T cell activation. Immunity 20: 407-415.
- Palaga T, Miele L, Golde TE, Osborne BA (2003) TCR-mediated Notch signaling regulates proliferation and IFN-gamma production in peripheral T cells. J Immunol 171: 3019-3024.
- Mukherjee S, Schaller MA, Neupane R, Kunkel SL, Lukacs NW (2009) Regulation of T cell activation by Notch ligand, DLL4, promotes IL-17 production and Rorc activation. J Immunol 182: 7381-7388.
- Kuijk LM, Verstege MI, Rekers NV, Bruijns SC, Hooijberg E, et al. (2013) Notch controls generation and function of human effector CD8+ T cells. Blood 121: 2638-2646.
- Cho OH, Shin HM, Miele L, Golde TE, Faug A, Minter LM, Osborne BA (2009) Notch regulates cytolytic effector function in CD8+ T cells. J Immunol 182: 3380-3389.
- Sander GR, Powell BC (2004) Expression of Notch receptors and ligands in the adult gut. J Histochem Cytochem 52: 509-516.
- Shawber C, Bolter J, Lindsell CE, Weinmaster G (1996) Jagged2: a Serrate-like gene expressed during rat embryogenesis. Dev Biol 180: 370-376.
- Valsecchi V, Ghezzi C, Ballabio A, Rugarli E (1997) Jagged2: a putative Notch ligand expressed in the apical ectodermal ridge and in sites of epithelialmesenchymal interactions. Mech Dev 69: 203-207.
- Luo B, Aster JC, Hasserjian RP, Kuo F, Sklar J (1997) Isolation and functional analysis of a cDNA for human Jagged-2, a gene encoding a ligand for the Notch1 receptor. Mol Cell Biol 17: 6057-6067.
- Ferrara JL, Levy R, Chao NJ (1999) Pathophysiologic mechanisms of acute graftversus-host desease. Biol Blood Marrow Transplant 5: 347-356.
- Godfrey DI, Hammond KJL, Poulton LD, Smyth MJ, Baxter AG (2000) NKT cells: facts, functions and fallacies. Immunol Today 21: 573-583.
- Imbimbo BP (2008) Therapeutic potential of gamma-secretase inhibitors and modulators. Curr Top Med Chem 1: 54-61.
- Duffy MJ, Mullooly M, O’Donovan N, Sukor S, Crown J, et al. (2011) The ADAMs family of proteases: new biomarkers and therapeutic targets for cancer? Clin Proteomics 8: 9.
- Haining EJ, Yang J, Bailey RL, Khan K, Collier R, et al. (2012) The TspanC8 subgroup of tetraspanins interacts with A distintegrin and metalloprotease 10 (ADAM10) and regulate its maturation and cell surface expression. J Biol Chem 287: 39753-39765.
- SDornier E, Coumailleau F, Ottavi J-F, Moretti J, Boucheix C, et al. (2012) TspanC8 tetraspanins regulate ADAM10/Kuzbanian trafficking and promote Notch activation in flies and mammals. J Cell Biol 199: 481- 496.
- Ferrara JLM, Levine JE, Reddy P, Holler E (2009) Graft-versus-host disease. Lancet 373: 1550-1561.
- Socie G, Blazar BR (2009) Acute graft-versus-host disease: from the bench to the bedside. Blood 114: 4327-4340.