Journal of Forensic Investigation
Download PDF
Research Article
*Address for Correspondence:Laura Jane Heathfield, Division of Forensic Medicine and Toxicology, Faculty of Health Science, University of Cape Town, PO Box 13914, Mowbray, 7705, South Africa, Tel: +27 21 406 6569; Fax: +27 21 448 1249; E-mail: laura.heathfield@uct.ac.za
Citation: Heathfield LJ, Prins AM, Schall R. Comparison of Footprint Ridge Density between Two South African Ethnic Groups. J Forensic Investigation. 2016; 4(1): 4.
Copyright © 2016 Heathfield LJ, et al. This is an open access article distributed under the Creative Commons Attribution License, which permits unrestricted use,distribution, and reproduction in any medium, provided the original work is properly cited.
Journal of Forensic Investigation | ISSN: 2330-0396 | Volume: 4, Issue: 1
Submission: 05 February, 2016 | Accepted: 03 March, 2016 | Published: 07 March, 2016
 which is approximately equal to 2. Ultimately the court would want to know the posterior odds; the probability of the hypotheses given the evidence (i.e. the probability of the individual who left the foot mark is a particular ethnicity given a particular ridge density). The likelihood ratio calculated using the probabilities such as those presented here would need to be multiplied with the prior odds, such as data on the respective population sizes from the most recent census, in order for the court to accurately assess the posterior odds. Our results suggest that, based on a ridge density measurement, the prior odds could approximately be doubled.
Comparison of Footprint Ridge Density between Two South African Ethnic Groups
Laura Jane Heathfield1*, Ashlon Meagan Prins2 and Robert Schall3
- 1Division of Forensic Medicine and Toxicology, Faculty of Health Science, University of Cape Town, South Africa
- 2Department of Genetics, Faculty of Natural and Agricultural Sciences, University of the Free State, South Africa
- 3Department of Mathematical Statistics and Actuarial Science, Faculty of Natural and Agricultural Sciences, University of the Free State, South Africa
*Address for Correspondence:Laura Jane Heathfield, Division of Forensic Medicine and Toxicology, Faculty of Health Science, University of Cape Town, PO Box 13914, Mowbray, 7705, South Africa, Tel: +27 21 406 6569; Fax: +27 21 448 1249; E-mail: laura.heathfield@uct.ac.za
Citation: Heathfield LJ, Prins AM, Schall R. Comparison of Footprint Ridge Density between Two South African Ethnic Groups. J Forensic Investigation. 2016; 4(1): 4.
Copyright © 2016 Heathfield LJ, et al. This is an open access article distributed under the Creative Commons Attribution License, which permits unrestricted use,distribution, and reproduction in any medium, provided the original work is properly cited.
Journal of Forensic Investigation | ISSN: 2330-0396 | Volume: 4, Issue: 1
Submission: 05 February, 2016 | Accepted: 03 March, 2016 | Published: 07 March, 2016
Abstract
Fingerprints and footprints are common forms of forensic evidence and can be used to aid identification of individuals or link them to scenes. Ridge density refers to the number of friction ridges in particular demarcated areas, typically on the hand or foot. Previous studies have suggested ridge density as a marker for sexual dimorphism, and to a lesser extent, for ethnicity, which both have forensic significance in terms of presumptive demographic profiling of marks left on crime scenes. Here we studied footprint ridge density in two South African ethnic groups and report that ridge density in the heels was significantly higher in South African white Afrikaners (n = 50) than in Cape Coloured individuals (n = 50); left heel: white Afrikaans 9.88 ± 1.87, Cape Coloured 8.84 ± 2.16 (p < 0.05); right heel: white Afrikaans 10.02 ± 2.17, Cape Coloured 8.94 ± 1.80 (p < 0.05) (13-72 years old; 64 females and 36 males). As shown, logistic regression analysis can be used to generate receiver operating characteristic curves for a rule for ethnicity approximation based on ridge density measurements, from which a likelihood ratio can be determined. The value of these probabilities within a forensic context requires consideration in relation to Bayes’ theorem which links the likelihood ratio and prior odds to yield the overall posterior odds. Our results suggest that, based on a ridge density measurement, the prior odds could approximately be doubled, and that footprint ridge density could be used as an attribute for ethnicity approximation. Ridge density was studied for the first time in Cape Coloured and white Afrikaans individuals and even though these two ethnic groups share some ancestry, significant differences in ridge density were observed between the groups in the heel areas of the feet.Keywords
Footprint ridge density; Friction ridge; Ethnicity; Likelihood ratio; ForensicsIntroduction
Human fingerprints and footprints are formed during gestation from patterns in friction ridge skin on raised portions of the epidermis, and their development is based on genetic, epigenetic, environmental and other factors [1-3]. Friction ridge patterns are considered unique to an individual and remain unchanged throughout life; thus fingerprints and footprints are used in forensic investigations for identification purposes [4,5].Fingerprints are classified according to three levels of characteristics; level one refers to the overall pattern type (loop, whorl, arch) [6]; level two to ridge formations or bifurcations; and level three to the ridge path deviation including pore configuration and ridge shape and width [4]. Friction ridge patterns on feet can also be also analysed based on the principles defined above for fingerprints [7]. Furthermore, the ridge density of friction ridges can be analysed; as defined by Acree, ridge density refers to the number of ridges in a defined area on a print or mark and is influenced by ridge width and the distance between ridges [8].
Numerous studies have recorded significant differences between sexes in the ridge densities of fingerprints [8-13], palm prints [14,15] and footprints [16,17], with ridge density being significantly higher in females than in males. This difference was observed in fingerprints regardless of which area of the finger was used to determine ridge density [12]. These findings are consistent with an explanation proposed in the 1940s which noted that friction ridges in males are wider than in females; thus fewer ridges are observed in a given area in males, resulting in a lower ridge density [18,19]. Gutiérrez-Redomero et al. suggested that ridge density of fingerprints could also be used to predict the ancestral origin of unknown individuals; whereby a ridge density of 14 or less could indicate a north west sub-Saharan African as opposed to Spanish origin [12].
The potential of ridge density in footprints to predict ethnic group or origin in South Africa has not yet been investigated. This information would be particularly valuable in a South African context where predicting the ethnic group to which a mark or print belongs could add discriminatory value in terms of the presumptive demographic profile of the person leaving the mark. Therefore, the aim of this study was to investigate footprint ridge density in two South African ethnic groups. The applicability of this study is highlighted in the South African case Makwakwa and Others v S (A294/10) (2011) ZAFSHC 27 (11 February 2011), where four out of seven appellants were found and arrested barefoot.
Materials and Methods
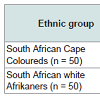
CohortIn the selection of the initial ethnic groups for this pilot study it was important to consider the fact that South African ethnic groups are not completely distinct from one another, and individuals from different ethnic groups may exhibit mixed ancestry. In this study, race was defined according to the South African Census population groups, while ethnicity encompassed race together with cultural meaning. The two ethnic groups chosen for study were both Afrikaans speaking but from distinct geographical areas within South Africa, namely (i) South African white Afrikaners from Bloemfontein in central South Africa where White individuals comprise 29.8% of the total population (Census 2011); and (ii) Cape Coloured individuals from Touws River, a small railway town approximately 160 km northeast of Cape Town, where Coloured individuals comprise 84.9% of the total population (Census 2011). These groups were chosen for study since they generally reside in geographically separate areas but nevertheless share partial ancestry (mainly Dutch); thus making the results of this study more applicable to a South African context. The cohort therefore comprised a total of 100 unrelated individuals (aged 13-72 years) from two ethnic groups, South African Cape Coloureds (n = 50; 30 females and 20 males) and South African white Afrikaners (n = 50; 34 females and 16 males) (Table 1).Ethics approval for this study was obtained from the University of the Free State; Faculty of Natural and Agricultural Sciences Ethics Committee, (reference number: UFS-HSD2014/0292) and the study was executed in accordance with the Declaration of Helsinki (1964) as amended in Brazil (2013). All volunteers gave written informed consent, or assent, to participate in the study and provided information about their ethnicity and ancestry on a data sheet.
Sample collection and analysis
Prints from the great toe and heel areas of both feet were collected from each participant using ink (45 x 65 mm SM-1 Micro ink pad). Participants were seated during sample collection and the collection card was placed onto the floor. This was carried out in an attempt to account for varying weight of participants. This is because the more downward pressure applied, the more distort the ridge density would appear. In this study, we wanted to assess the inherent footprint ridge density as a baseline for these ethnic groups, and not the influence of weight on ridge density. The variable of ‘weight’ therefore needed to be controlled. Since standing and walking increases the amount of weight on the foot (and distorts ridge density), footprints were collected whilst subjects were seated. However, this is also a limitation to the practical application of these results to forensic science. Therefore, after baseline footprint ridge densities have been established, future studies should investigate footprint ridge density of individuals whilst standing, walking and running, in order provide a more practical meaning of these results to forensic science investigators.
Ink was applied to the specific regions on the foot after which the participant applied moderate downward pressure onto the collection card for approximately 1-2 seconds. The ridge density was determined in a 25 mm 2 area in the medial border area of the great toe, and in the central region of the heel as previously described [8,16]. Ridges were counted under 8X magnification (eyepiece - 10X; and objective piece - 0.8X) using the EZ4 high definition stereo microscope (Leica Microsystems) and images were captured using the integrated high definition camera (3M pixel) and Leica Application Suite software.
Statistical analysis
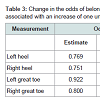
The four measurements of ridge density in footprints (left heel, right heel, left great toe and right great toe) were subjected to two-way analysis of variance with the factors sex and ethnicity (SAS procedure GLM) [20]. In addition, logistic regression models, fitting, one at a time, the four measurements of ridge density in footprints as predictors, were fitted to the binary variable ethnicity. Based on the logistic regression models the odds ratios, that is, the change in the odds of belonging to the Cape Coloured ethnic group associated with an increase of one unit in ridge density was calculated.
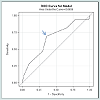
Similarly, receiver operating characteristic (ROC) curves associated with the logistic regression analyses were determined (SAS procedure LOGISTIC) [20]. The ROC curve plots sensitivity against 1-sensitivity, for a range of cut-off values c. The closer the area under the curve is to 1, the more sensitive and specific is prediction of ethnic group membership using the ridge density measurement in question.
Results and Discussions
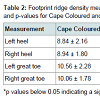
Prints from the great toe and heel areas of both feet were collected from each of the 100 participants. Ridge density was calculated for the heel and great toe regions from each participant’s feet [8, 16]; the mean and standard deviation measurements are given in Table 2. Statistically significant differences in ridge density were observed between the ethnic groups for both the left and right heels (p < 0.05) but not for the left and right great toes (Table 2).Based on logistic regression analysis, the odds ratios, that is, the change in the odds of belonging to the Cape Coloured ethnic group associated with an increase of one unit in ridge density was calculated. The odds ratios are presented in Table 3.
ROC analysis associated with the logistic regression analysis illustrates the sensitivity and specificity of prediction of ethnic group membership using a measurement of ridge density; in the example the left heel ridge density measurement was used (Figure 1). Consider a prediction rule for ethnic group membership whereby we declare a footprint as coming from a Coloured individual if the ridge density measurement R is below or equal to a given cut-off value c. Then the sensitivity of the prediction rule is the conditional probability Prob (R ≤ c | Individual is Coloured), and similarly, its specificity is the conditional probability Prob (R > c | Individual is White). The point of the graph indicated in Figure 1 by an arrow is associated with the most suitable cut-off value, namely c = 9 for the case of left heel ridge density. For this cut-off, the sensitivity and specificity of the prediction rule are 0.694 and 0.640, respectively.
The value of these probabilities within a forensic context requires consideration in relation to Bayes’ theorem which links the likelihood ratio and prior odds to yield the overall posterior odds [21,22]. The probabilities estimated here refer to the likelihood ratio and not directly to the posterior odds. The likelihood ratio considers the probability of the evidence given the prosecutor’s and defence’s hypotheses, respectively. For example, the evidence could be: the ridge density of the foot mark from the left heel is R = 7.5 ≤ c = 9; the prosecutor’s hypothesis could be: the individual who left the foot mark is a Cape Coloured; and the defence’s hypothesis could be: the individual who left the foot mark is not a Cape Coloured (in this case, a white Afrikaner). The likelihood ratio (LR) in this case is equal to
The limitation of this interpretation within the present study is that not all ethnic groups in South Africa were included the study and therefore the calculated likelihood ratio is conditional on individuals being either from the South African white Afrikaans or from the Cape Coloured groups. However, the statistical method described here could easily be extended to include other ethnic groups, should their footprint ridge density data become available at a later stage.
Footprint ridge density has traditionally been used to discern between males and females and can thus provide an investigative lead regarding the sex of a suspect [16,23]. This association has not been reported in a South African population yet and since this cohort comprised mostly females, the ridge densities were not compared between sexes here. Rather, ridge densities were compared between two South African ethnic groups. The mean ridge densities of the left and right heels were 9.88 ± 1.87 and 10.02 ± 2.17 for South African white Afrikaners; and 8.84 ± 2.16 and 8.94 ± 1.80 for the Cape Coloureds, respectively. The mean ridge densities for both the left and right heels were significantly higher in South African white Afrikaners than Cape Coloureds (p < 0.05). The mean ridge densities reported for both South African ethnic groups however, were generally lower than those mean ridge densities reported in an Indian population: left heel = 10.4 ± 0.9 for males and 11.0 ± 0.9 for females; right heel = 10.4 ± 0.9 for males and 10.9 ± 1.0 for females [16].
The weight of an individual would impact the resulting ridge density, as heavier individuals would create more distorted prints and an apparent lower ridge density [24,25]. The weight of individuals was not recorded in this study and it is a limitation; however, participants sat while prints were taken in order to reduce the influence of their weight and to rather capture their feet’s ridge densities itself. Yet the exact amount of downward pressure could not be controlled, and likewise this may have had an influence on the resulting ridge density of the prints; the more downward pressure applied, the more distort and larger the friction ridges would appear in a particular sized area, and this would result in an apparent lower ridge density. Therefore, it must also be considered that a lower ridge density could have been observed as a result of more downward pressure as opposed to an individual belonging to a particular ethnic group. These observations and hypotheses would need to be verified in a larger cohort. Ideally, the height and weight of the individual should be recorded and assessed in relation to the foot’s ridge density (for both static and dynamic prints). In this study it was not clear how much distortion of friction ridges was due to increased weight or pressure while making the print.
Conclusion
Ridge density in two areas of the footprint was studied for the first time in Cape Coloured and white Afrikaans individuals. Although these two ethnic groups share some ancestry, significant differences in ridge density were observed between the groups in the heel areas of the feet. Although the likelihood ratio estimated in this study cannot be used directly since not all ethnic groups in South Africa were considered, it nevertheless provides a framework of methodology for analysis, as well as acknowledges the limitations of dealing with such data.References
- Cummins H, Midlo C (1943) Finger prints, palms and soles: An introduction to dermatoglyphics. The Blakiston Co, Philadelphia, pp. 227-229.
- Kücken M, Newell AC (2005) Fingerprint formation. J Theor Biol 235: 71-83.
- Kücken M, Champod C (2013) Merkel cells and the individuality of friction ridge skin. J Theor Biol 317: 229-237.
- Galton F (1892) Finger Prints. MacMillan Publishers Ltd, New York, London.
- Kennedy RB, Chen S, Pressman IS, Yamashita AB, Pressman AE (2005) A large-scale statistical analysis of barefoot impressions. J Forensic Sci 50: 1071-1080.
- Henry ER (1897) Classification and uses of fingerprints. Government of India.
- Robbins LM (1978) The individuality of human footprints. J Forensic Sci 23: 778-785.
- Acree MA (1999) Is there a gender difference in fingerprint ridge density? Forensic Sci Int 102: 35-44.
- Gutiérrez-Redomero E, Alonso C, Romero E, Galera V (2008) Variability of fingerprint ridge density in a sample of Spanish Caucasians and its application to sex determination. Forensic Sci Int 180: 17-22.
- Gutiérrez-Redomero E, Alonso MC, Dipierri JE (2011) Sex differences in fingerprint ridge density in the Mataco-Mataguayo population. Homo 62: 487-499.
- Nithin MD, Manjunatha B, Preethi DS, Balaraj BM (2011) Gender differentiation by finger ridge count among South Indian population. J Forensic Leg Med 18: 79-81.
- Gutiérrez-Redomero E, Quirós JA, Rivaldería N, Alonso MC (2013) Topological variability of fingerprint ridge density in a sub-Saharan population sample for application in personal identification. J Forensic Sci 58: 592-600.
- Kapoor N, Badiye A (2015) Sex differences in the thumbprint ridge density in a central Indian population. Egypt J Forensic Sci 5: 23-29.
- Krishan K, Kanchan T, Sharma R, Pathania A (2014) Variability of palmprint ridge density in a North Indian population and its use in inference of sex in forensic examinations. Homo 65: 476-488.
- Gutiérrez-Redomero E, Alonso-Rodríguez C (2013) Sexual and topological differences in palmprint and ridge density in the caucasian Spanish population. Forensic Sci Int 229: 159.e1-e10.
- Kanchan T, Krishan K, Aparna KR, Shyamsunder S (2012) Footprint ridge density: a new attribute for sexual dimorphism. Homo 63: 468-480.
- Abledu JK, Abledu GK, Offei EB, Antwi EM (2015) Determination of sex from footprint dimensions in a Ghanaian population. PLoS One 10: e0139891.
- Cummins H, Waits WJ, McQuitty JT (1941) The breadths of epidermal ridges on the finger tips and palms: a study of variation. Am J Anat 68: 127-150.
- Ohler EA, Cummins H (1942) Sexual differences in breadths of epidermal ridges on finger tips and palms. Am J Phys Anthropol 29: 341-362.
- (2009) SAS/STAT 9.2 User’s Guide, Second Edition, The MCMC procedure (Book excerpt) SAS Institute Inc, Cary, North Carolina, USA.
- Jeffreys H (1973) Scientific Inference. (3rd Edn), Cambridge University Press.
- Blair JP, Rossmo DK (2010) Evidence in Context: Bayes’ Theorem and investigations. Police Q 13: 123-135.
- Krishan K, Kanchan T, DiMaggio JA (2015) Emergence of forensic podiatry--a novel sub-discipline of forensic sciences. Forensic Sci Int 255: 16-27.
- Krishan K (2008) Establishing correlation of footprints with body weight--forensic aspects. Forensic Sci Int 179: 63-69.
- Fawzy IA, Kamal NN (2010) Stature and body weight estimation from various footprint measurements among Egyptian population. J Forensic Sci 55: 884-888.


